Line shape effects on intensity measurements of solar features:
Brightness correction to SoHO
MDI continuum images
Abstract
Continuum intensity observations obtained with the Michelson Doppler Imager (MDI) on-board the SoHO mission provide long time series of filtergrams that are ideal for studying the evolution of large-scale phenomena in the solar atmosphere and their dependence on solar activity. These filtergrams, however, are not taken in a pure continuum spectral band, but are constructed from a proxy, namely a combination of filtergrams sampling the Ni I 6768 Å line. We studied the sensitivity of this continuum proxy to the shape of the nickel line and to the degradation in the instrumental transmission profiles. We compared continuum intensity measurements in the nearby of nickel line with MDI proxy values in three sets of high resolution spectro-polarimetric data obtained with the Interferometric Bidimensional Spectrometer (IBIS), and in synthetic data, obtained from multi-dimensional simulations of magneto-convection and one-dimensional atmosphere models. We found that MDI continuum measurements require brightness corrections which depend on magnetic field strength, temperature and, to a smaller extent, plasma velocity. The correction ranges from 2% to 25% in sunspots, and is, on average, less than 2% for other features. The brightness correction also varies with position on the disk, with larger variations obtained for sunspots, and smaller variations obtained for quiet sun, faculae and micropores. Correction factors derived from observations agree with those deduced from the numerical simulations when observational effects are taken into account. Finally, we found that the investigated potential uncertainties in the transmission characteristics of MDI filters only slightly affect the brightness correction to proxy measurements.
1 Introduction
The continuum intensity measurements obtained with MDI have provided extensive time series of data unaffected by seeing for over 13 years. These data are ideal for studying large-scale phenomena in the solar atmosphere and their dependence on solar magnetic activity. They have been utilized in many investigations, concerning the analysis of large-scale patterns in plasma motions (e.g., Meunier et al., 2008, 2007, and references therein), the measurement of the radiative properties of magnetic elements over the activity cycle (e.g. Ortiz et al., 2002, 2006; Mathew et al., 2007), and the modeling of irradiance variations (e.g. Krivova et al., 2003; Wenzler et al., 2006, 2009).
Nevertheless, MDI continuum data are a by-product of the instrument, which was designed mainly for Doppler measurements. Specifically, intensities in the continuum are derived by the combination of five narrow-band filtergrams, obtained with filters sampling a passband of 94 mÅ FWHM, equally spaced by 75 mÅ around the Ni I 6768 Å mid-photospheric line. The filtergrams are labeled , where is divided over two bands taken near the continuum, on either side of the line, and are centered on the wings of the nickel line, and and are centered around its core. Even at the instrument does not sample true continuum. Instead, a proxy continuum-intensity filtergram is constructed by combining the five nominal filtergrams in the following way (Scherrer et al., 1995):
| (1) |
where is the average of the five filtergrams and is the line depth, which is given by:
| (2) |
The components of sum theoretically have cancelling systematic errors as a function of solar velocity, so that the continuum image is claimed to be free of Doppler induced cross-talk at the 0.2% level (Scherrer et al., 1995).
The accuracy of the MDI continuum estimate (called the MDI method hereafter) is, however, inherently limited by the shape of the spectral line and its sensitivity to both strength and inclination of the magnetic field, local thermal stratification, and line-of-sight motions of the observed region. In addition, MDI measurements may also suffer from substantial errors because of uncertainties in the actual transmission characteristics of the filters utilized (Wachter, 2008).
Several previous studies have focused on the accuracy of magnetic flux estimates obtained from MDI observations (e.g. Berger & Lites, 2003; Tran et al., 2005; Ulrich et al., 2009; Wang et al., 2009; Demidov & Balthasar, 2009; Zhendong et al., 2010), as well as the accuracy of dynamic measurements (Wachter et al., 2006; Rajaguru et al., 2007; Wachter, 2008). Results indicate a substantial underestimate of magnetic flux and spurious contributions affecting Doppler measurements. This lead to recalibration of magnetograms and dopplergrams series, with the most recent results suggesting that the calibration of these data could be improved yet further. By contrast, the accuracy of continuum intensity measurements has only been investigated by Mathew et al. (2007), using spectral calculations based on one-dimensional atmospheric models. Their results indicate that MDI continuum measurements underestimate intensity in sunspots, with an error depending on both the magnetic field strength and temperature stratification.
The objective of this study is to further investigate the uncertainties affecting MDI continuum intensity measurements, by considering both high spatial resolution spectro-polarimetric observations and numerical simulations. To this aim we defined a brightness correction factor and investigated its variation with the physical properties of the analyzed solar features and observational conditions, such as spatial and spectral scattered light, finite spatial and spectral resolution and position on the solar disk. We also investigated possible effects resulting from degradation of MDI filter transmission profiles.
The paper is organized as follows. We describe the data analyzed and provide some details of the reduction applied (Sect. 2). Then, we present the spectral synthesis method and the results obtained from our measurements and synthesis computations (Sect. 3). We also investigate sensitivity of results to filter profiles uncertainties (Sect. 4). We finally discuss the results obtained and present our conclusions (Sect. 5).
2 Spectral data
To investigate the sensitivity of the MDI continuum measurement proxy we employed profiles of the Ni I 6768 Å line obtained from two different sources, namely high-resolution spectro-polarimetric observations acquired with the Interferometric Bidimensional Spectrometer (IBIS Cavallini, 2006; Reardon & Cavallini, 2008) at the NSO/Dunn Solar Telescope, as well as with theoretical line synthesis calculations, as described below.
2.1 Observed spectra
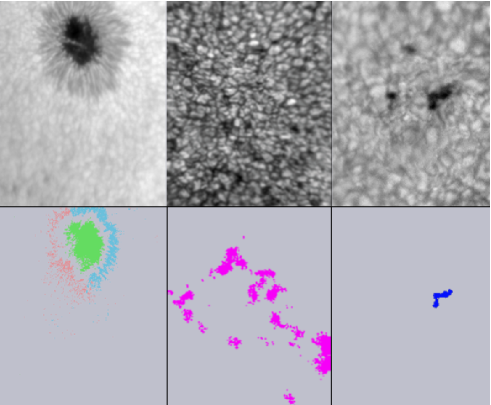
The observed spectra used in this work were extracted from three IBIS data sets. These will be referred to as the Pore, Sunspot, and Faint Plage sets hereafter, alluding to the main solar features in their field-of-view (FOV). The Pore set is a spectral scan of the Ni I 6768 Å line acquired near the disk centre with diffraction limited spatial sampling at 0083/pixel. The Sunspot and the Faint Plage sets are Full-Stokes spectropolarimetric scan of the Ni I 6768 line, acquired at and , respectively, with a spatial sampling of 017/pixel. The IBIS spectral profile at 6768 Å has a FWHM of 25 mÅ (Reardon & Cavallini, 2008) and the spectral sampling was about 30 mÅ for the three sets. The datasets were reduced following standard procedures (Cauzzi et al., 2008; Viticchié et al., 2009; Judge et al., 2010) which also correct for the instrumental blue-shift, and for instrument and telescope polarization in the case of spectropolarimetric data. The pipeline includes a MFBD image reconstruction technique (Van Noort, Rouppe van der Voort & Lofdahl, 2006) to reduce seeing degradation and possible seeing induced crosstalk.
Note that all observed line profiles suffer from finite spectral resolution and spectral scattered light contamination. This last effect was estimated by comparison of observed average quiet Sun profile with Atlas measurements by Kurucz et al. (1984), following the procedure described in Cabrera Solana et al. (2007, their eq. 1). We found a consistent light contamination level of 12% on all the three datasets analyzed.
To estimate the magnetic flux density along the Line-of-Sight () in image pixels of the Sunspot and Faint Plage sets, we applied the Center Of Gravity method (COG) by Rees & Semel (1979). This method provides a reasonable estimate of the at the formation height of the line core as demonstrated by Uitenbroek (2003) for several lines of Fe I. We applied the method to synthetic sunspot profiles from the 3D MHD simulations (described in Sect. 2.2) taking into account both spatial and spectral scattered light and found that the COG in the Ni I line can underestimate magnetic flux by up to 28% for 1.5 kG. The value deduced for each image pixel was compensated for LOS projection by applying the relation (Landi & Landolfi, 2004, p. 660)
| (3) |
where the inclination angle derives from
| (4) |
, and is computed at the left wing of the line.
As an aid in classification of the observed pixels (see Table 1), we computed the total polarization signal T in each image pixel, which is defined as
| (5) |
where is the intensity in the continuum near the Ni I line.
Finally, line-of-sight velocities were estimated by Doppler shifts of line cores with respect to the average quiet Sun line center position.
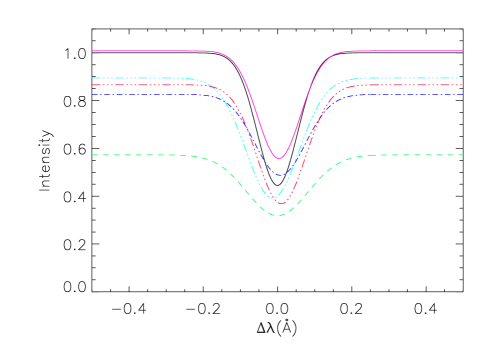
Characteristic maps of the continuum intensity of each set are shown in Fig. 1. The FOVs include a large variety of solar features, characterized by different physical properties and therefore different shapes of line profiles. An example of such variety is reported in Fig. 2, which shows average line profiles of pixels selected according to the criteria described in Table 1.
| Solar feature | Criterion | Data set |
|---|---|---|
| quiet Sun | Spot | |
| Faint Plage | ||
| facula | 0.2 kG | Faint Plage |
| and 10% | ||
| umbra | 1.5 kG | Spot |
| penumbra blue sh. | kG 1.1 kG | Spot |
| and | ||
| penumbra red sh. | kG 1.1 kG | Spot |
| or | ||
| pore | Pore |
2.2 Synthetic spectra

.
To better understand the results obtained from observations and to distinguish between observational and methodological effects, we also computed synthetic spectra of the Ni I line by utilizing various numerical atmospheres: two two-dimensional cross sections from a three-dimensional simulation of magneto-convection of an active region with average vertical field of 250 G (Stein & Nordlund, 1998), a vertical cross section of an umbral magneto-convection simulation (Vitas et al., 2010), and various one-dimensional hydrostatic models. The one-dimensional static models we considered ranged from the semi-empirical umbral models E, L, and M from Maltby et al. (1986), the model by Socas-Navarro et al. (2004, Socas, hereafter) to the most recent radiative equilibrium models of Kurucz 111http://wwwuser.oat.ts.astro.it/castelli/grids.html. In all the Maltby and Kurucz models, we assumed vertical height-independent magnetic fields. For the Maltby models, we assumed magnetic field strengths ranging from 2.0 kG to 4.0 kG. The full set of one-dimensional models, which are all representative of umbral regions, and the corresponding magnetic field strengths are listed in Table 2. The field strength of the Socas model listed in this table, however, is the value at at 5000 Å, since this model was used with its original depth-dependent magnetic field structure. Note that we set the turbulent velocity value in Kurucz models to zero, since other values in these models are more representative of non-magnetic and convectively unstable atmospheres.
| Model | B(kG) |
|---|---|
| Kur_5.50 | 1.10 |
| Kur_5.25 | 1.70 |
| Kur_5.00 | 2.25 |
| Kur_4.75 | 2.25 |
| Kur_4.50 | 2.50 |
| Kur_4.25 | 3.00 |
| Kur_4.00 | 3.50 |
| Kur_3.75 | 4.00 |
| Maltby L | 2.00 |
| Maltby L | 2.50 |
| Maltby L | 3.00 |
| Maltby M | 2.50 |
| Maltby M | 3.00 |
| Maltby M | 3.50 |
| Maltby E | 3.00 |
| Maltby E | 3.50 |
| Maltby E | 4.00 |
| Socas | 2.3 |
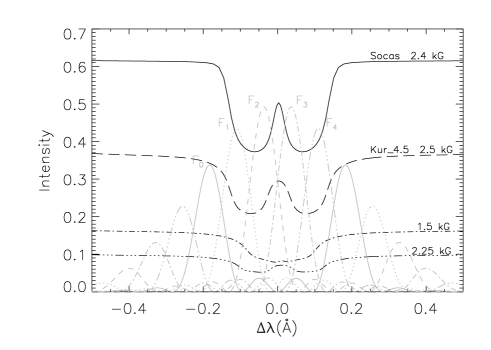
The spectral synthesis was performed in non-local thermal equilibrium (NLTE) with the RH code by Uitenbroek (2002, 2003), and employing the model atom of Bruls (1993). The emergent spectra were calculated at various lines of sight for a 1.Å wide spectral interval centered on the Ni I line. Figure 3 shows examples of line profiles derived from the synthesis in the various atmospheres, all normalized to the intensity value calculated from the FAL-C model of Fontenla et al. (1993), which is representative of the quiet Sun. This normalization provides a common intensity reference value for the different simulations. Similarly to observations, the line profiles derived from the synthesis display a large variety of shapes, because of the different physical conditions in the simulated atmospheres. The synthetic profiles differ from those deduced from observations of magnetic features mostly in terms of the line core reversal. This must be mainly ascribed to the transverse Zeeman component (Stix, 2004), which, especially for high values of magnetic field strength, can considerably modify the shape of the line core, and the fact that all observations were taken slightly off disk center.
3 Simulation of MDI continuum measurements
To test the algorithm for the MDI continuum proxy we compare the values it predicts with the real continuum values in the observed and simulated spectra of the Ni I 6768 line. We first evaluate the intensities in each of the five filter positions by multiplying the spectra with the filter passband and integrating over wavelength, then add the integrated intensities according to Eq. 1. The MDI transmission profiles were centered on the core of the average line profile of the Quiet Sun. This was defined as in Table 1 in the case of Sunspot and Faint Plage dataset, while for the Pore dataset we considered an area in the FOV of 80 square arcsec far from the pores. As for simulations, we centered the transmission profiles to the core of the line profile derived from the FAL-C model.
Since we generally do not measure absolute intensities in observations, but rather intensities relative to some average intensity, we analyze validity of the MDI continuum estimate by measuring contrast, where contrast is defined as the ratio between the intensity of an analyzed feature and the intensity of the quiet Sun. For observed spectra, the contrast was estimated after compensation for the center-to-limb variation (CLV) of quiet Sun intensity across the FOV on each frame. The CLV was derived from the second order polynomial surface best fitting the intensity pattern of quiet Sun regions in the image, after masking dark magnetic features by applying an intensity criterion thresholding, and application of a smoothing function to pixel intensities. Concerning numerical simulations, intensity values were normalized by the intensity at the Ni I continuum calculated with the FAL-C model for the appropriate disk positions. Furthermore, we define as brightness correction factor to MDI continua measurements the ratio , where is the contrast value obtained in the continuum near the Ni I line (hereafter called the continuum contrast) and is the contrast derived with the MDI method (hereafter called the MDI contrast). In the following we investigate the dependence of this correction factor on various properties of the analysed regions, e.g. the contrast, magnetic field strength, and plasma velocity, as well as observational conditions.
3.1 Results from observed spectra
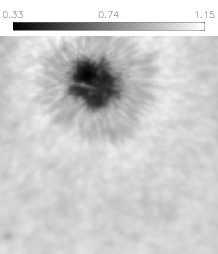
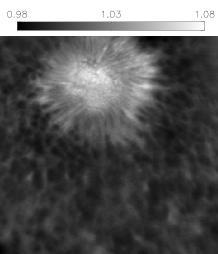
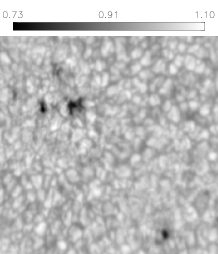
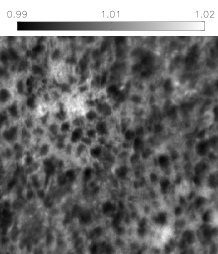
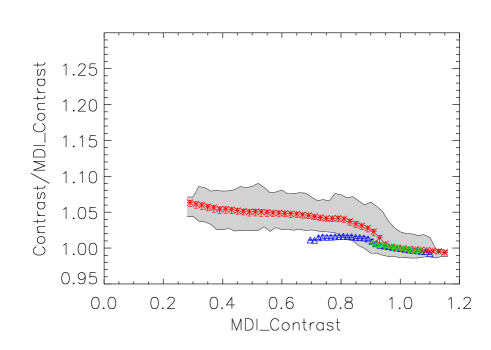
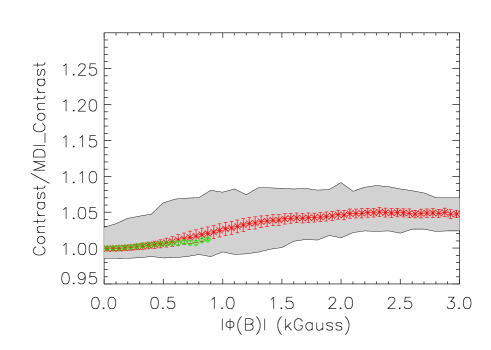
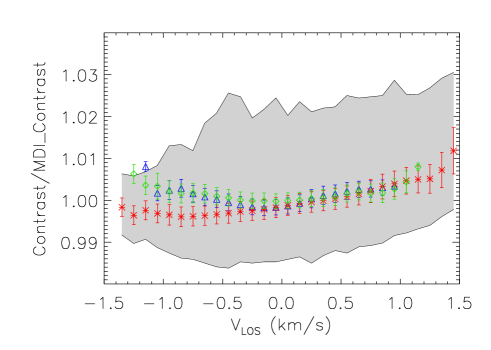
Figure 4 shows maps of the intensity contrast (left panels) in the Sunspot (top) and Pore (bottom) sets and the corresponding maps of the brightness correction to MDI measurements (right panels). We found that the correction factor is, on average, lower than 2% of the MDI contrast, but increases up to 8-10% in regions with high magnetic field strength. The figure also shows that the MDI contrast is, on average, overestimated in upflow regions (granules), while it is underestimated in regions with downflows (intergranular lanes), and in particular in regions with strong magnetic fields. The map of the brightness correction in the Pore (lower right panel) looks very similar to a map of the inverse granulation as it would appear in core intensity of a photospheric spectral line, implying that the correction factor depends strongly on the photospheric temperature gradient, which is steep over granules and shallow over inter-granular lanes. The reason that the MDI continuum estimate depends on this temperature gradient lies in the corresponding widths of the spectral line profile, which are narrow and deep in granules, and wide and shallow over intergranular lanes. Profiles that are wider than that of the average quiet Sun cause an underestimate of the line depth (Eq. 2), and consequentially an underestimate of the MDI continuum (Eq. 1). The effect is also visually enhanced by the fact that magnetic field concentrations preferentially reside in downflow regions. This is further explained in Section 3.2 below.
Figure 5 shows the brightness correction to the MDI contrasts derived from all the image pixels in all three data sets. Symbols and error bars of a given colour show the average and standard deviation of the correction factor derived from a given data set by considering the MDI contrast values for the set collected into bins with 0.02 width. We found that the brightness correction is close to unity for bright features, because of the opposite contribution from Doppler shifts and magnetic fields to the line shape, though we note some dispersion of results. On the other hand, the correction factor increases with the decrease of the MDI contrast derived from the images, reaching 1.08 for MDI contrasts 0.3.
Next we investigated the effects of the magnetic field strength on MDI contrast estimates in more detail. Figure 6 shows the results derived from a sample of Sunspot and Faint Plage images (7 and 5 IBIS line scans, respectively). We found that the brightness correction increases with the increase of the magnetic field strength, although a saturation value of 1.04 is reached at magnetic flux larger than 1.5 kG. In spite of the small standard deviation values, we also notice a large scatter of results, especially for the regions with 1.5 kG. In the range 0.7 kG 1.2 kG this is due to combined effect of LOS velocity and magnetic field strength, since this range also comprises pixels belonging to the sunspot penumbra. At lower values of magnetic flux the large scatter of results likely derives from uncertainties in the COG estimations of magnetic field, which are due to limited spatial resolution and residual cross-talk in Stokes signals.
Finally, we investigated the effects of LOS velocity on brightness correction, restricting the analysis to finite ranges of magnetic field strength values. Results obtained for quiet Sun regions selected on the three datasets are shown in Fig. 7. In agreement with visual inspection of images in Fig. 4 the brightness correction is, on average, larger than unity for downflow regions and smaller than unity for upflow regions, but with large dispersion. Due to the lower image quality of Pore and Faint Plage datasets, this effect is more evident on the Sunspot data.
3.2 Results from synthetic spectra
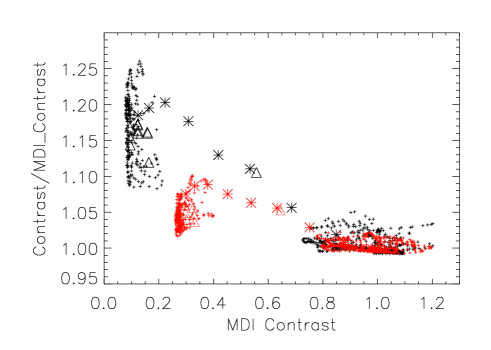

Our analysis of observations performed with the observed Ni I spectra indicates that the brightness correction to MDI measurements depends on the solar feature analysed. This is confirmed by the results derived from various numerical simulations. Similarly to Fig. 5 derived from observations, Fig. 8 shows the brightness correction deduced from the various atmospheres described in Sect. 2. Here the set of points with contrast close to unity stems from the magneto-convection simulation of active region, the set of points with contrast close to 0.1 stems from the magneto-convection simulation of sunspot umbra and the intermediate contrast points stem from hydro-static models. We found that the brightness correction is close to unity, with some dispersion of results due to magnetic field and velocity effects, for MDI contrast values ranging from 0.8 to 1.2, as also derived from the three IBIS data sets. However, the correction factor increases up to 1.15-1.25 for MDI contrast 0.5, i.e., by a larger fraction than derived from observations. We also found a large dispersion of results from the magneto-convection simulations of umbral regions, because of the wide range of field strengths in the analysed atmosphere models. The dispersion of correction values from simulations is also larger than those from observations.
To assess the importance of observational effects on the results derived from the three data sets and to place them in context with the results deduced from model calculations, we computed synthetic spectra from the various model atmospheres at the heliocentric angles of our observations (e.g. = 0.88 for the Sunspot set) and degraded the results to account for the finite spectral resolution, spurious spectral light contamination, and spatially scattered light degradation affecting the observations.
This latter effect was mimicked by applying the formula , where indicates the level of spurious spatial light contamination, and is the quiet Sun intensity value. Estimation and compensation on high spatial resolution data for scattered light results uncomplete, even employing the most sophisticated restoration algorithm available (e.g. MOMFBD Scharmer et al., 2010). In the lack of measurements, we assumed the value , which is within the range of values (0.17-0.25) found by Briand et al. (2006) for IPM/THEMIS data. The results obtained indicate that the observational conditions and degradations above listed all affect the brightness correction, specifically by decreasing its value. The difference between the three IBIS datasets must therefore be ascribed to the different image qualities. We also note that, among the observational effects considered, the brightness correction is affected the most by spurious spatial light contamination, which also contributes to a smaller dispersion of the results from observations (Mathew et al., 2007; Criscuoli & Ermolli, 2008).
Figure 9 shows the dependence of the brightness correction on the magnetic field strength in the synthetic atmospheres. The results deduced with simulations are qualitatively in agreement with those derived from observations, though the saturation value is reached only at B = 3 kG and the dispersion of results is larger than obtained from observations as a result of image degradation by limited spatial resolution and spatially spurious light. The plot clearly shows a double distribution: one for which the brightness correction value is smaller than 1.05 and one for which it is higher. We found that data from the active region magneto-convection simulation belong to the first group, whereas the second group is populated by sunspot models (with the exception of the two hottest Kurucz models) and the umbral simulation.
We found that the MDI continuum estimate method depends in a complicated way on both temperature and magnetic field intensity. The larger the magnetic field strength, the wider the line profile. If the line profile becomes so wide and/or shifted that it reaches into (one or two of) the outermost transmission passbands, the continuum (Eq. 1) is underestimated, resulting in a brightness correction larger than one. This effect is also discussed in Mathew et al. (2007) and illustrated in their Fig. 7. These authors also notice that for the largest magnetic field values considered in their study, a saturation of the error occurs because of the filling in of the line core, as is also clear in the line profiles in Fig. 3. By contrast, an increase in the effective temperature narrows the line and increases its depth (Mathew et al., 2007, their figure 8). As a consequence, for a given value of magnetic field strength the brightness correction is smaller for faculae rather than for sunspots. On the other hand, at the saturation limit, where the field mostly affects the width of the line, the error in the MDI continuum estimate increases with the effective temperature as the line narrows. We also note that the brightness correction factor for the synthesized spectra (Fig. 9) seems less affected by saturation than the one for the observed spectra (Fig. 6).

Next, we investigated the dependence of the brightness correction on the LOS velocity of the plasma. We found that, on average, the brightness correction is larger than unity and increases with the magnitude of the LOS velocity. This is illustrated in Fig.10, which shows the results derived for quiet-Sun portions (defined here by those pixels with 50 G) of the magneto-convection simulations representative of active region. As we can see, data from simulations allow to investigate a wider range of velocities with respect to observations (Cauzzi et al., 2006). When restricting the analyses to the range from -2 km/s to 2 km/s we note the same asymmetry we found for observations, namely a brightness correction smaller than unity for upflows and larger than unity for downflows. This asymmetry is the result of the correlation between temperature gradient and up- or downflows in the granulation. Granules correspond to upflows (negative ) and have steep temperature gradients resulting in narrow and deep profiles. The shallow temperature gradient over inter-granular lanes, where most downflows occur, leads to broader profiles. The spacing of the MDI filter positions is chosen such that it matches the width of the average quiet-Sun profile of the Nickel line in the sense that Eq. 2 gives the proper line depth. For substantially narrower profiles the filter positions and sample close to continuum values increasing the line depth estimate, overestimating the continuum. This leads to the correction factors below unity for small upflows. For larger line shifts to either sides, but already for smaller velocities in the downflows with their wider profiles, the correction factor is larger than one, because and (for blue shifts), or and (for red shifts) both end up close to the core, minimising their difference in sampled intensity, underestimating the line depth, and underestimating the continuum level.

Finally, we considered the dependence of the brightness correction on the position of the analysed feature on the solar disk. To this aim, we computed the synthetic spectra for 13 different viewing angles from various model atmospheres. In particular, we employed all the static sunspot models as well as the magneto-convection simulations representative of an active region. The Nickel line forms low enough in these models so that the vertical domain includes its formation height, even at high inclinations of the LOS. Figure 11 shows the correction factor for the different Kurucz models with cooler models and stronger fields (both leading to wider profiles, and larger correction factors) towards the top. For the models with 3 kG (or K), the brightness correction monotonically decreases with the decrease of the heliocentric angle, because the width of the line decreases with the line-of-sight component of the magnetic field, which changes linearly with for the assumed vertical fields. For models with 3 kG ( K), the CLV of the correction factor increases strongly with decreasing from 1.0 to 0.9, and then decreases again monotonically with decreasing . The initial rise is the result of the transverse magnetic Zeeman effect, which produces intensity decrease of the core of the profile for positions close to disk center, thus creating characteristic double-peaked profiles. These quickly disappear for . Figure 11 also shows the CLV of the correction factor for faculae (squares), designated as those areas that have a field strength larger than 0.2 kG and contrast greater than one) in the magneto-convection active region simulation. These facular regions show very little variation in their required correction factors accross the disk.
4 Sensitivity to passband uncertainties


To assess the importance of an inaccurate knowledge of the filter characteristics, we analysed the dependence of the brightness correction derived from observed spectra on potential inaccuracies in the precise tuning and width of the MDI passbands. In particular, we computed the variation of the brightness correction for displacements of the passband pattern ranging from -0.14 Å to +0.14 Å from its nominal position. These values correspond to Doppler shifts of km/s and are 1.5 times larger than the ones considered in the calibration of the MDI measurements (Scherrer et al., 1995, their Fig. 12). We also investigated the sensitivity of the required brightness correction to variations of the width of the MDI passband respect to the nominal value of 94 mÅ.
Figure 12 displays the resulting brightness correction as a function of displacement of the MDI pass band pattern, when considering the same average observed line profiles for quiet Sun, plage, pore, umbra, and the most blue-shifted penumbra (see Fig. 2). We found that, for moderate displacement values, the brightness correction decreases for displacements in the same direction as the line profile Doppler shift, while it increases for shifts in the opposite direction. This is particularly clear for the penumbral profile (triple-dot-dashed curve). For large displacements all the curves in Fig. 12 show a trend towards unity, because the offset between the line center and transmission pattern becomes so large that the passbands sample more and more true continuum. Note also the oscillatory variations of the curves, that, as pointed out by Wachter (2008), have a period proportional to the spacing of the transmission profiles of the filters.
Next, we computed variation of the brightness correction for different assumed widths of the tunable MDI passband by convolving the nominal profiles with Gaussians of widths that are multiples of the width of the profiles. This last quantity was estimated fitting the highest lobe of with a Gaussian function. Figure 12 shows the results for the various solar features. We found that the brightness correction decreases with the increase of the filter profile widths, and eventually drops below unity for the pore and facular profiles. This is the result of the transmission profile becoming wider than the line profile (see also the discussion in 3.2). Note also that the brightness correction for the penumbra is the least affected by the widening of transmission line profiles, since its value is mostly determined by the shift of the spectral line.
5 Discussion and Conclusions
We have presented a study of the accuracy of the MDI continuum intensity measurement, with the help of high spatial resolution spectro-polarimetric observations acquired with the IBIS/DST and outcomes from numerical simulations representative of different solar regions. In order to provide the reader with a quantity that clearly indicates the MDI uncertainties and allows their compensation on measurements, we defined as brightness correction the ratio between the contrast value in the continuum and the one estimated through MDI method and investigated the variation of this quantity with the physical properties of analyzed solar regions.
We found that the MDI brightness correction, on average, increases with the increase of the LOS magnetic field strength, the decrease of temperature, and the increase of LOS velocity. To summarize, the contrast is overestimated in quiet upflow regions, and is underestimated in magnetic and quiet downflow regions. The amount of correction is less than 1% in quiet regions and increases with the magnetic field strengths, reaching values up to 25% of the MDI continuum value in sunspots. However, line saturation effects limit the MDI error in regions with highest magnetic field strengths.
Results derived from observations agree with those deduced from simulations, when accounting for the observational conditions and instrumental degradations affecting the observations. Among the effects considered, spatially spurious light is the one that affects the most the brightness correction values. In the lack of a reliable estimate on our observational data, we therefore refrained from a direct comparison of results from MDI and IBIS data. On the other hand, we did not find any significant variation of the brightness correction values when degrading the results from IBIS data to the spatial resolution of MDI, thus suggesting that brightness correction is not significantly dependent on the spatial resolution of the observations.
Note that the brightness correction values that we found correspond to errors much higher than the 0.2% quoted in the instrument description of Scherrer et al. (1995, p. 163).
The brightness correction factor derived from synthetic spectra also depends on the position on the solar disk in different manners for the different features analyzed. We found that the brightness correction for sunspot models with strong field ( kG) varies by up 2% for disk positions corresponding to , reaching a maximum value for , and then decreasing towards the limb. For weaker fields the variation across the disk is much less (Fig. 11). Also for quiet Sun, faculae and micropores the variation in brightness correction is small, below 1%, across the disk.
Finally, we investigated effects of possible filter degradations on MDI continuum contrast estimates. We estimated variations with the shift of the passband pattern and with the change in the width of the transmission profiles of the instrument. Results are summarized in Fig. 12 for various features observed on the solar photosphere. We found that for small amounts ([-0.03,0.03] Å) of transmission profiles displacement the variation of the brightness correction is negligible for features not affected by Doppler shifts (i.e. faculae and quiet sun). For line profiles shifted with respect to quiet sun line center, a shift of filter center in the same direction as the line Doppler shift causes a reduction of the amount of correction, whereas a displacement in the opposite direction causes an increase. In addition, we found that broadening of the passband causes a decrease of the amount of correction when the width of the line profiles is larger than that of the passband. For transmission line profiles wider than the profile of the solar feature under study, the contrast is overestimated and the amount of deviation of the correction coefficient from unity increases with the increase of the filter degradation.
Our results are qualitatively in agreement with those presented by Mathew et al. (2007), who applied MDI procedure to synthetic line profiles obtained from Kurucz (1991) atmosphere models. Nevertheless, a comparison of results shows that they obtained brightness correction larger than the ones we have presented. These discrepancies must be ascribed to the differences in model atmospheres employed, assumptions for atomic parameters and micro and macro velocity values. Due to the arbitrariness of the choice of these quantities inherent to 1D models, this analyses should be repeated by a direct comparison of MDI data with observations in the Ni I continuum properly compensated for scattered light, or with the employment of magneto-convection simulations encompassing a larger variety of sunspots.
Results presented in this study show that photometric measurements obtained with MDI data should be revised by taking into account the brightness correction factors presented. Due to the dependence of this factor on observational conditions, continuum images should be compensated for spatial scattered light before any correction is applied. Since MDI Point Spread Function varies with time, this result contributes to question studies based on the temporal variation of photometric properties of solar features derived from MDI data analyses.
Finally, our study proofs forward modeling as a powerful tool also for instrumental calibration. In particular, results presented here are of interest for the interpretation of data acquired with the Helioseismic and Magnetic Imager onboard the Solar Dynamic Observatory.
References
- Berger & Lites (2003) Berger, T. & Lites, B. 2003, Sol. Phys., 213, 213
- Bruls (1993) Bruls, J.H.M.J. 1993, A&A, 269, 509
- Briand et al. (2006) Briand, C., Mattig, W., Ceppatelli, G. & Mainella, G. 2006, Sol. Phys., 234, 187
- Cabrera Solana et al. (2007) Cabrera Solana, D., Bellot Rubio, L. R., Beck, C. & del Toro Iniesta, J. C. 2007, A&A, 475, 1067
- Cauzzi et al. (2006) Cauzzi, G., Asensio Ramos, A., Reardon, K. P. & Janssen, K. 2006 in Solar MHD Theory and Observations: A High Spatial Resolution Perspective ASP Conference Series, Vol. 354, Proceedings of the Conference Held 18-22 July, 2005, NSO, Sacramento Peak, Sunspot, New Mexico, USA. Ed. by J. Leibacher, R. F. Stein, H. Uitenbroek. San Francisco: Astronomical Society of the Pacific.
- Cauzzi et al. (2008) Cauzzi, G., Reardon, K. P, Uitenbroek, H., Cavallini, F., Falchi, A. et al. 2008, A&A, 480, 515
- Cavallini (2006) Cavallini, F. 2006, A&A, 128, 589
- Criscuoli & Ermolli (2008) Criscuoli, S. & Ermolli, I. 2008, A&A, 484, 591
- Demidov & Balthasar (2009) Demidov, M.L. & Balthasar, H. 2009, Sol. Phys., 260, 261
- Fontenla et al. (1993) Fontenla, J. M., Avrett, E. H. & Loeser, R. 1993, ApJ, 406, 319
- Judge et al. (2010) Judge, P.G., Tritschler, A., Uitenbroek, H., Reardon, K. Cauzzi, G. & de Wijn, A. 2010, ApJ, 710, 1486
- Krivova et al. (2003) Krivova, N. A., Solanki, S. K., Fligge, M. & Unruh, Y. C 2003, A&A, 399, L1
- Kurucz et al. (1984) Kurucz, R. L., Furenlid, I., Brault, J. & Testerman, L. 1984, Solar flux atlas from 296 to 1300 nm, National Solar Observatory Atlas, Sunspot, New Mexico: National Solar Observatory
- Kurucz (1991) Kurucz, R. L. 1991 in Stellar Atmospheres: Beyond classical models, ed. L. Crivellari, I. Hubeny, & D. G. Hummer, NATI ASI Series (Dordrecht: Kluwer), 440
- Landi & Landolfi (2004) Landi degli Innocenti, E. & Landolfi, M. 2004, Polarization in spectral lines, Astrophysics and Space Science Library, Dordrecht: Kluwer Academic Publisher
- Maltby et al. (1986) Maltby, P., Avrett, E. H., Carlsson, M., Kjeldseth-Moe, O., Kurucz, R. L. & Loeser, R. 1986, ApJ, 306, 284
- Mathew et al. (2007) Mathew, S. K., Martínez Pillet, V., Solanki, S. K. & Krivova, N. A. 2007, A&A, 465, 291
- Meunier et al. (2007) Meunier, N., Roudier, T. & Tkaczuck, R. 2007, A&A, 466, 1123
- Meunier et al. (2008) Meunier, N., Roudier, T. & Rieutord, M. 2008, A&A, 488, 1109
- Ortiz et al. (2002) Ortiz, A., Solanki, S. K., Domingo, V., Fligge, M. & Sanahuja, B. 2002, A&A, 388, 1036
- Ortiz et al. (2006) Ortiz, A., Domingo, V., Sanahuja, B. 2006, A&A, 452, 311
- Rajaguru et al. (2007) Rajaguru, S. P., Sankarasubramanian, K., Wachter, R. & Scherrer, P. H. 2007, ApJ, 654, L175
- Reardon & Cavallini (2008) Reardon, K. P. & Cavallini, F. 2008, A&A, 481, 897
- Rimmele (2004) Rimmele, T.R. 2004 in Advancements in Adaptive Optics, presented at the Society of Photo-Optical Instrumentations Engineers (SPIE) Conf.; ed. D. B. Calia, B.L. Ellerbroek & R. Ragazzoni. Proc. SPIE, 5490, 34
- Rees & Semel (1979) Rees, D. E. & Semel, M. D. 1979, A&A, 74, 1R
- Scharmer et al. (2010) Scharmer, G. B., Löfdahl, M. G. & van Werkhoven, T. I. M., de la Cruz Rodriguez, J. 2010 A&Ain press
- Scherrer et al. (1995) Scherrer, P. H., Bogart, R. S., Bush, R. I., et al. 1995, Sol. Phys., 162, 129
- Socas-Navarro et al. (2004) Socas-Navarro, H., Martínez Pillet, V., Sobotka, M. & Vázquez 2004, ApJ, 614, 448
- Stein & Nordlund (1998) Stein, R. F. & Nordlund, A. 1998, ApJ, 499, 914
- Stix (2004) Stix, M. 2004, The Sun: an introduction, Astronomy and astrophysics library, Berlin: Springer.
- Tran et al. (2005) Tran, T., Bertello, L., Ulrich, R.K. & Evans, S. 2005, ApJS, 156, 295
- Uitenbroek (2002) Uitenbroek, H. 2002, ApJ, 565, 1312
- Uitenbroek (2003) Uitenbroek, H. 2003, ApJ, 592, 1225
- Uitenbroek & Tritschler (2006) Uitenbroek, H. & Tritschler, A. 2006, ApJ, 639, 525
- Ulrich et al. (2009) Ulrich, R. K., Bertello, L., Boyden, J. E. & Webster, L. 2009, Sol. Phys., 255, 53
- Van Noort, Rouppe van der Voort & Lofdahl (2006) Van Noort, M. Rouppe van der Voort, L. Lofdahl, M. 2006, ASP Conf. Ser., 354, 55
- Vitas et al. (2010) Vitas, N., Vögler, A. & Keller, C. submitted to A&A
- Viticchié et al. (2009) Viticchié, B., Del Moro, D., Berrilli, F., Bellot Rubio, L. & Tritschler, A. 2009, ApJ, 700L,745
- Wachter et al. (2006) Wachter, R., Schou, J. & Sankarasubramanian, K. 2006, ApJ, 648, 1256
- Wachter (2008) Wachter, R. 2008, Sol. Phys., 251, 491
- Wang et al. (2009) Wang, D., Zhang, M., Li, H. & Zhang, H. Q. 2009, Sol. Phys., 260, 233
- Wenzler et al. (2006) Wenzler, T., Solanki, S. K., Krivova, N. A. & Fröhlich, C. 2006 A&A, 460, 583
- Wenzler et al. (2009) Wenzler, T., Solanki, S. K. & Krivova, N. A. 2009, GeoRL, 36, 3 11, L11102
- Zhendong et al. (2010) Zhendong G. G., Zhao, Y. & Liu, Y. 2010, RAA, 10, 1041