Gigantic Maximum of Nanoscale Noncontact Friction
Abstract
We report measurements of noncontact friction between surfaces of NbSe2 and SrTiO3, and a sharp Pt-Ir tip that is oscillated laterally by a quartz tuning fork cantilever. At 4.2 K, the friction coefficients on both the metallic and insulating materials show a giant maximum at the tip-surface distance of several nanometers. The maximum is strongly correlated with an increase in the spring constant of the cantilever. These features can be understood phenomenologically by a distance-dependent relaxation mechanism with distributed time scales.
pacs:
68.35.Af, 68.35.Ja, 68.37.PsFriction has been studied for a long time as one of the fundamental subjects in physics. However, the microscopic mechanism of friction is still in dispute Persson (2000). Nanotribology, namely study of friction at nanoscale, is the most important subject not only for understanding friction but also for the development of micro- and nanoelectromechanical devices, which need control of friction at the nanoscale. A significant amount of research effort has been devoted to revealing the mechanism of friction at the nanoscale Bhushan (2008).
Interestingly, there is a novel type of friction, so-called noncontact friction, at the nanoscale. In contrast to the ordinary contact friction, noncontact friction occurs when two bodies are not in direct contact. It has been observed in scanning probe microscopy experiments, in which a sharp metal tip oscillates laterally near a flat surface Stowe et al. (1999); Stipe et al. (2001); Kuehn et al. (2006). Stipe et al. observed the noncontact friction between a Au(111) surface and a Au-coated probe tip attached to a very soft cantilever (spring constant N/m) Stipe et al. (2001). At temperatures 4300 K, the friction coefficient was approximately kg/s at a tip-sample distance 10 nm. As a possible mechanism of the noncontact friction, Ohmic losses caused by fluctuating electromagnetic fields were proposed Volokitin and Persson (2002); Chumak et al. (2004). However, the observed friction coefficient is 7 - 8 orders of magnitude larger than the values derived by the theories. Some additional mechanisms that could explain the large noncontact friction have been proposed Volokitin and Persson (2007); Zurita-Sánchez et al. (2004), but the discrepancy has not been solved.
The above-mentioned theories predict that noncontact friction is proportional to the electrical resistivity of samples. It is therefore expected to be higher on insulating materials than on metals Volokitin and Persson (2007); Zurita-Sánchez et al. (2004). It was found experimentally that the noncontact friction coefficients of insulating silica and polymer films were an order of magnitude larger than the value on the Au(111) surface Stipe et al. (2001); Kuehn et al. (2006). This tendency is qualitatively consistent with the theories, but quantitative contradiction still remains. On the other hand, Karrai and Tiemann (KT) observed a huge , which is estimated to be kg/s, between a conductive graphite surface and a gold probe tip attached to a hard ( N/m) quartz tuning fork (QTF) at 10 nm at room temperature Karrai and Tiemann (2000). They attributed the origin of the friction to the viscous damping caused by residual adsorbates such as carbon oxide. The friction observed by KT was therefore not discussed in terms of noncontact friction. However, it seems implausible that the viscous adsorbates always dominate the friction under high-vacuum conditions. It is desirable to perform the measurement of noncontact friction in a more systematic and controlled way with a variety of materials. It is also worthwhile to study the noncontact friction on superconducting surfaces. Theories predict elimination of noncontact friction on superconductors Zurita-Sánchez et al. (2004). The friction on superconductors has been also a controversial issue in the past decade Dayo et al. (1998); Pierno et al. (2010).
In this Letter, we report the measurements of the lateral friction force between a metal tip and metallic (superconducting) as well as insulating materials that provide clean and flat surfaces. We performed the measurements at low temperatures down to 4.2 K under high vacuum ( Pa), by using a lateral force microscope with a hard () QTF as a cantilever. The employment of the hard cantilever at low temperatures led us to the discovery of a quite unexpected feature of noncontact friction.
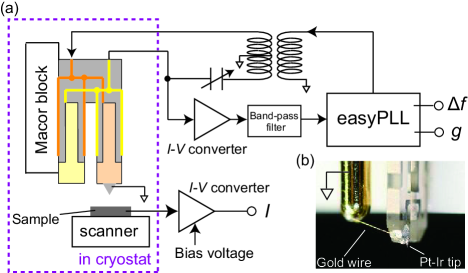
We modified a home-made frequency-modulation atomic force microscope (FM-AFM) working at low temperatures Saitoh et al. (2008, 2009) to detect lateral forces. A schematic diagram along with a photograph of the QTF is shown in Fig. 1. Electrochemically etched Pt-Ir tips were attached to one prong of the QTF. The curvature radius of the tip was approximately 100 nm, which is smaller than the value of the soft-cantilever tip used in Ref. Stipe et al. (2001)(). The QTF cantilever is mounted perpendicular to the sample, so the tip oscillates parallel to the sample’s surface. The QTF was driven to oscillate at its resonance frequency with constant amplitude by a commercial FM-AFM controller. The resonance frequency of the QTF, , was approximately 31.6 kHz. In high vacuum ( Pa), the quality factor was and at room temperature and 4.2 K, respectively.
Throughout our experiments, the friction coefficient and the friction-induced spring constant defined by the tip-sample interaction were measured as a function of tip-sample distance . The dissipation , which is the output of the automatic gain control circuit in the FM-AFM controller, and the resonance frequency shift were collected simultaneously, and converted to and , respectively: and , where and is the dissipation without the tip-sample interaction. We employed 2-NbSe2 and SrTiO3 as superconducting (7.2 K) and insulating samples, respectively. NbSe2 was cleaved in atmosphere just before being assembled on the microscope. The surface of SrTiO3 had been chemically etched by the manufacturer, and we utilized it as purchased. In order to minimize the contaminations on the tip and the samples, the inside of the vacuum can of a cryostat was pumped just after the QTF and the samples were installed in the microscope. The tip-sample distance was determined by the tunneling current .
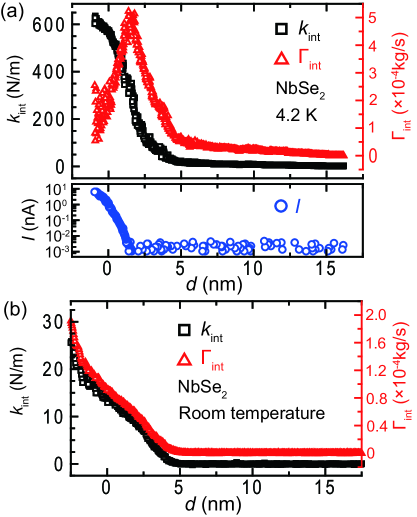
Figure 2 shows the and of NbSe2 as a function of , together with . The origin of the tip-sample distance was defined as the distance at which = 1 nA when the bias voltage applied is equal to 50 mV, i.e. the tunneling resistance is equal to 50 M. This definition was based on prior knowledge that a tunneling resistance of 50 M is much higher than the quantum resistance at which a point contact between the tip and the sample is formed Rubio-Bollinger et al. (2004). The electrical conduction at 50 M was largely dominated by electron tunneling; i.e., the tip was not in physical contact with the sample surface. Several novel features are identified in the data. At 4.2 K, as decreases, both and increase for 15 nm. The order of magnitude of the is kg/s, which is as huge as the value observed by KT Karrai and Tiemann (2000). Most surprisingly, exhibits a maximum at 1.5 nm, while increases in the same range. It is notable that at 4.2 K, is observed on a superconducting state. At 0, stops to decrease, while tends to remain constant. At room temperature (Fig. 2(b)), and increase monotonically with decreasing , but does not show any maximum down to 0.
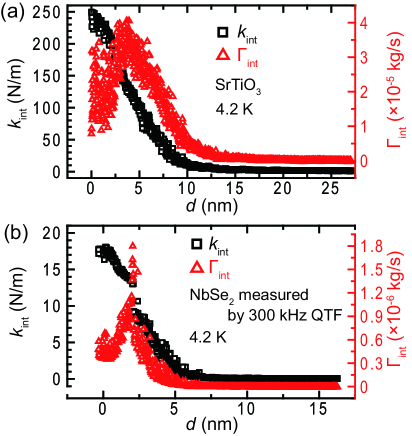
Similar patterns are observed in the data collected with SrTiO3. Figure 3(a) shows and at 4.2 K. Since SrTiO3 is an insulator, the smallest tip-sample distance at which reasonable data are available has been determined to be the zero of . The overall behavior, which is a maximum of associated with an increase in , is quite similar to the results obtained with NbSe2. We found that both and start to increase at a relatively longer distance of 25 nm than in the case of NbSe2. The magnitude of is approximately kg/s. This value is an order of magnitude smaller than the observed in NbSe2.
Figure 3(b) shows the data collected by using NbSe2 at 4.2 K and a different QTF, oscillating at a resonance frequency of 300 kHz. The definition of the zero of is the same as in Fig. 2. Once again, exhibits a maximum associated with an increase in at 10 nm. We also found that changes abruptly at 2 nm. This abrupt change was not due to an irreversible change of the tip, e.g. plastic deformation or the damage in the tip, because the abrupt change always occurred at a single tip-sample distance, and it was reproduced at different lateral positions. is approximately kg/s, which is 2 orders magnitude smaller than the value obtained with the QTF oscillating at 32 kHz. On the other hand, is about 10 N/m, namely, an order of magnitude smaller than the obtained with the 32 kHz QTF.
The maxima of and the increase in were reproducibly observed in superconducting and insulating materials over a wide range of frequencies. Furthermore, on NbSe2, the behaviors were also observed at temperatures above the superconducting transition temperature 7.2 K up to 10 K. These facts definitely show that the maximum associated with the increase is an universal feature of noncontact friction. We can also conclude that the conductivity of the materials has negligible contribution to the observed giant noncontact friction. The mechanism underlying the behavior of our is expected to be different from the existing theoretical notions providing an interpretation of noncontact friction.
We will argue below that the maximum with the increase is an intrinsic property of noncontact friction. First, in the NbSe2 data, the maximum was observed at 2 nm, where no tunneling current was detected. Therefore, the possibility that the maximum was caused by the tip coming in physical contact with the sample is excluded. Second, during the measurements the oscillation amplitude of the QTF was kept constant to about 0.3 nm, which is close to the lattice constant of NbSe2. It is much smaller than 15 nm, where starts to increase. Moreover, the behaviors of and were reproduced for many different lateral positions on the samples’ surface. Therefore, we conclude that there was no intermittent contact in the lateral direction, i.e., no instantaneous collisions of the probe tip to protrusions or steps on the samples’ surface. The possibility of physical contact of the tip with the surfaces is excluded once again. Third, the possibility of energy dissipation due to viscous adsorbates that KT claimed Karrai and Tiemann (2000) is excluded, because all adsorbates, if there are such materials present, freeze at low temperatures. In addition, helium atoms, which exceptionally remain in liquid form, did not exist in the experimental apparatus, because the microscope was cooled down to 4.2 K without using any thermal exchange gas such as helium. On the grounds of these observations, we conclude that the anomalies identified in and reflect a novel, universal feature of nanoscale noncontact friction.
KT observed a minimum in , which corresponded to a maximum in , only when they used a long probe tip and hence the spring constant of the tip was 2 orders of magnitude smaller than that of their QTF Karrai and Tiemann (2000). In this case, the minimum in is attributed to an experimental artifact caused by the deformation of the soft tip. In our experiment, the spring constant of the probe tip is an order of magnitude larger than that of the QTF. Therefore, our maximum is not an artifact but an intrinsic property of noncontact friction.
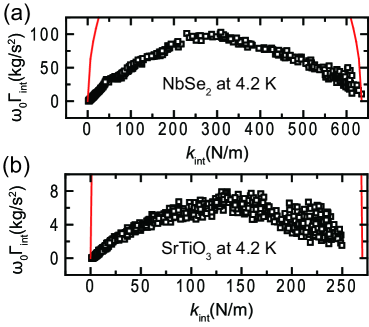
We noticed that the overall behavior of and bear a striking resemblance to the Debye-like relaxation response function of dielectrics Fröhlich (1958). It is therefore reasonable to explain our noncontact friction in terms of the characteristic timescale of some relaxation mechanism taking place on the samples’ surface. More specifically, the behavior of as well as of can be simultaneously determined based on the relaxation time that depends on the tip-sample distance . Based on this idea, we replotted the data shown in Fig. 2(a) and Fig. 3(a) on a plane, as shown in Fig. 4. This is similar to the so-called Cole-Cole plot for dielectric phenomena Cole and Cole (1941), because and are represented as in the equation of motion of a cantilever, where is the displacement of the cantilever. Here corresponds to the response function. The plots for NbSe2 and SrTiO3 exhibit an ellipse rather than a semicircle. When we compared these plots with the results of a Cole-Cole analysis Cole and Cole (1941), it was made evident that the ellipses indicate that the relaxation process cannot be described by a single time scale but by a wide distribution of relaxation times. It is worth noting that the ellipse for NbSe2 is wider than that for SrTiO3. This observation led us to the conclusion that the relaxation time depends on the materials and is more distributed for SrTiO3 than for NbSe2. In addition, the dependence of the relaxation time changes with temperature. The absence of a maximum for in the case of NbSe2 at room temperature can be attributed to the change of the dependence with temperature and the possibility that the probe tip comes in contact with the sample surface before reaches its maximum.
The next step is to propose a model to describe the relaxation mechanism. The lateral oscillation of the probe tip causes the crystal lattice of the sample surface to deform and the surface atoms to vibrate. It is natural to assume that the sample atoms are vibrated more easily as decreases, so the vibration of the sample atoms following the tip depends on . Given that the -dependent sliding friction forces drive the vibratory motion of the atoms on the samples’ surface, we propose to model the lateral force interaction by a dashpot connected in series with a spring . In other words, and are represented as follows: and , where is the relaxation time and is defined as . Assuming that increases as decreases, the behaviors of and in our experiments can be explained consistently. In reality, the lattice deformation depends on the lateral position of the atoms on the samples’ surface and furthermore, the apex of the tip might be deformed. Therefore, the lattice deformation should be described by a distribution of relaxation times. The deviation from the semicircle in the Cole-Cole plot can originate from such a distribution.
The above-mentioned lattice deformation might be associated with the so-called phonon friction, which was proposed as a potential origin of noncontact friction Volokitin and Persson (2007). However, the order of magnitude of the friction due to the lattice deformation mediated by van der Waals or electrostatic forces is calculated to be kg/s Volokitin and Persson (2007). Clearly, the giant noncontact friction observed during our experiments cannot be explained by the phonon friction and other theories proposed so far. New theoretical concepts are required to understand the microscopic origin of the noncontact friction.
Finally, we comment on the effect of superconductivity on the noncontact friction. We found no change in both and at the of NbSe2 (7.2 K) within the experimental accuracy. This shows again that the conducting electrons have a negligible contribution to the giant noncontact friction. However, this does not deny the possibility of the contribution of superconductivity to noncontact friction: It might be masked by the giant friction. Experiments under a magnetic field may reveal the superconducting effect by comparing the friction inside and outside the vortex cores.
In summary, we discovered that the noncontact friction probed by a hard quartz tuning fork cantilever shows a giant maximum at low temperatures. The friction maximum is associated with a change in the friction-induced spring constant of the cantilever. This associated behavior is phenomenologically described by a Debye-like relaxation mechanism with multiple time scales. Our results show that there are some hidden mechanisms producing the gigantic maximum of the noncontact friction. The abrupt change in the friction-induced spring constant that was observed in the 300 kHz QTF might be a clue for elucidating the mechanisms of the giant noncontact friction. Studies of the giant noncontact friction will contribute to understanding general friction phenomena and to the development of nanotribology.
Acknowledgements.
The authors thank Koki Takita for the synthesis of NbSe2. This work was supported by a Grand-in-Aid for Scientific Research from MEXT, Japan.References
- Persson (2000) B. N. J. Persson, Sliding Friction - Physical Principles and Applications, 2nd ed. (Springer-Verlag, 2000).
- Bhushan (2008) B. Bhushan, ed., Nanotribology and Nanomechanics - An Introduction, 2nd ed. (Springer-Verlag, 2008).
- Stowe et al. (1999) T. D. Stowe et al., Appl. Phys. Lett. 75, 2785 (1999).
- Stipe et al. (2001) B. C. Stipe et al., Phys. Rev. Lett. 87, 096801 (2001).
- Kuehn et al. (2006) S. Kuehn et al., Phys. Rev. Lett. 96, 156103 (2006).
- Volokitin and Persson (2002) A. I. Volokitin and B. N. J. Persson, Phys. Rev. B 65, 115419 (2002).
- Chumak et al. (2004) A. A. Chumak et al., Phys. Rev. B 70, 085407 (2004).
- Volokitin and Persson (2007) A. I. Volokitin and B. N. J. Persson, Rev. Mod. Phys. 79, 1291 (2007), and references therein.
- Zurita-Sánchez et al. (2004) J. R. Zurita-Sánchez et al., Phys. Rev. A 69, 022902 (2004).
- Karrai and Tiemann (2000) K. Karrai and I. Tiemann, Phys. Rev. B 62, 13174 (2000).
- Dayo et al. (1998) A. Dayo et al., Phys. Rev. Lett. 80, 1690 (1998).
- Pierno et al. (2010) M. Pierno et al., Phys. Rev. Lett. 105, 016102 (2010).
- Saitoh et al. (2008) K. Saitoh, K. Hayashi, Y. Shibayama, and K. Shirahama, J. Low. Temp. Phys. 150, 561 (2008).
- Saitoh et al. (2009) K. Saitoh, K. Hayashi, Y. Shibayama, and K. Shirahama, J. Phys. Conf. Series 150, 012039 (2009).
- Rubio-Bollinger et al. (2004) G. Rubio-Bollinger et al., Phys. Rev. Lett. 93, 116803 (2004).
- Fröhlich (1958) H. Fröhlich, Theory of Dielectrics, 2nd ed. (Oxford University Press, 1958).
- Cole and Cole (1941) K. S. Cole and R. H. Cole, J. Chem. Phys. 9, 341 (1941).