Measurement of Reciprocity Failure in Near Infrared Detectors
Abstract
Flux dependent non-linearity (reciprocity failure) in HgCdTe near infrared detectors can severely impact an instrument’s performance, in particular with respect to precision photometric measurements. The cause of this effect is presently not understood. To investigate reciprocity failure, a dedicated test system was built. For flux levels between 1 and 50,000 photons/s, a sensitivity to reciprocity failure of approximately 0.1%/decade was achieved. A wavelength independent non-linearity due to reciprocity failure of about 0.35%/decade was measured in a 1.7m HgCdTe detector.
Subject headings:
cosmology – photometry – astronomical instrumentation1. Introduction
Near infrared (NIR) detector technology has made great strides over the past two decades and large format arrays with excellent performance are now commercially available. Substrate-removed devices extend the wavelength sensitivity of near infrared detectors into the UV and highly integrated read-out ASICS provide compact, low power front-end electronics. Advances in detector technology make NIR detectors well suited for space-based wide-field imaging instruments, which are critical for pursuing some of the major scientific questions of our time. One of the most far-reaching problems in physics today is the lack of understanding of the nature of dark energy. The investigation of dark energy is most efficiently pursued with experiments that employ a combination of different observational probes, such as type-Ia supernovae, weak gravitational lensing, galaxy and galaxy cluster surveys, and baryon acoustic oscillations. Most of these approaches rely on photometric calibrations over a wide range of intensities using standardized stars and internal reference sources. Hence, a complete understanding of the linearity of the detectors is necessary. As part of a comprehensive program to study HgCdTe detector properties that impact precision photometry, we have studied flux dependent detector non-linearity. This effect was observed in the Near Infra-Red Camera and Multi-Object Spectrometer (NICMOS) on the Hubble Space Telescope (HST) (Bohlin et al., 2005; deJong et al., 2006). The NICMOS instrument, installed onboard HST during the second servicing mission in 1997, employs three 256 256 NIR detectors. These m cut-off HgCdTe devices were fabricated by Rockwell Science Center (now Teledyne Imaging Sensors, TIS). This vendor also supplied the 1024 1024 m cut-off HgCdTe detector for the Wide Field Camera 3 (WFC3) instrument (Baggett et al., 2008), which was recently installed on HST during the final servicing mission. The m cut-off HgCdTe detector used for the reciprocity study described here was also supplied by TIS.
The NICMOS team concluded that the NICMOS detectors exhibit a significant flux dependent non-linearity which strongly varies with wavelength (Bohlin et al., 2005). This non-linearity, referred to here as “reciprocity failure”, must be carefully distinguished from the well-known non-linearity of total signal, referred to here as “classical non-linearity”, which is observed in near infrared detectors that integrate charge on the junction capacitance of the pixels. Classical non-linearity in NIR detectors is caused by dependence of diode capacitance on voltage and non-linearity in the readout multiplexer, and is usually measured by integrating a constant flux for different exposure times. Reciprocity failure in turn can be measured by varying the flux for exposure times that produce a constant integrated signal.
The mechanism responsible for reciprocity failure is not yet understood. It has been suggested that image persistence in HgCdTe detectors is caused by the slow release of trapped charge in the bulk material (Smith et al. 2008). It is conceivable that charge traps are also the cause of reciprocity failure. For a trap density that is small but not negligible compared to the photon density at low illumination levels, a small fraction of the signal would be lost due to the traps. An increase in the photon flux then will not result in a proportionally reduced signal, since charge is not efficiently exposed to traps with long fill-time constants. However, longer illumination at low flux levels could result in the filling of traps with long fill time constants and thus a reduced integrated signal. Such a detector behavior would produce the observed effect: for a given total integrated signal a pixel’s response to a high flux is larger than to a low flux. Mathematically, reciprocity failure can be characterized by a logarithmic behavior over most of the dynamic range of a detector and the deviation from a linear system is expressed as fractional deviation per decade of total signal response.
Reciprocity failure impacts photometry as residual pixel-level uncertainties directly propagate to the estimated uncertainty on the derived magnitude. Detailed knowledge of the degree of reciprocity failure for a detector will affect the calibration strategy and the calibration devices needed. A profound understanding of the cause of this effect could influence the detector manufacturing process, possibly reducing or even eliminating this non-linearity.
2. Instrument
To quantify reciprocity failure in NIR detectors, a dedicated test system was designed and built. Based on the measurements reported by the NICMOS team it was determined that a sensitivity to reciprocity failure of at least 1%/decade over the full dynamic range of a typical NIR detector had to be achieved. To measure reciprocity failure a detector was exposed at different illumination intensities, and the incident flux was precisely monitored with photodiodes. The exposure time at each illumination intensity was adjusted to integrate to similar total integrated signals. A parametrization including classical non-linearity and reciprocity failure was used to describe the data and to extract a measurement of the non-linearity due to reciprocity failure (see Appendix). Knowledge of the linearity of the photodiodes is essential to this method. Therefore, deviation from linearity of the photodiodes was measured independently as described in Section 2.2.
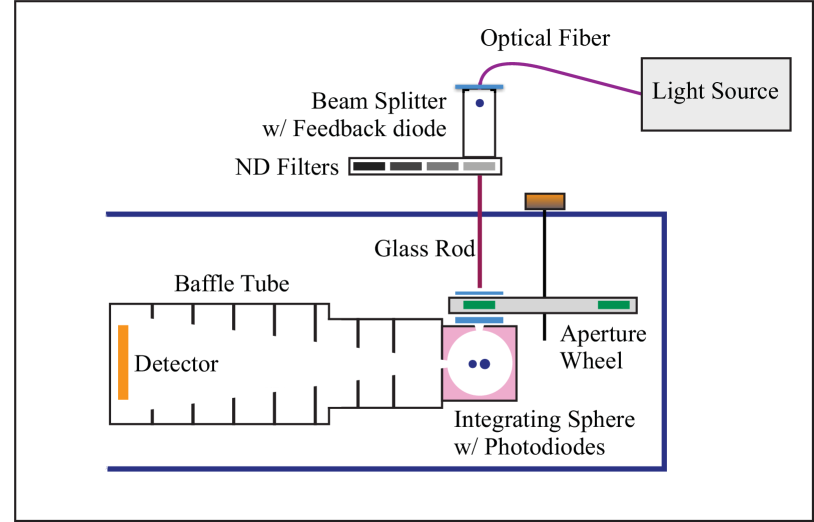
The experimental set-up utilizes a fixed illumination geometry. The illumination intensity is varied through a combination of neutral density filters and pinhole apertures, as schematically illustrated in Fig. 1. A regulated light source placed outside the dewar is connected via a liquid light guide to a glass rod that illuminates a pinhole mounted on the aperture wheel inside the dewar. To avoid stray light entering the dewar, the glass rod is surrounded by a bellows that attaches to the cold shield and the aperture wheel. The detector is illuminated by an integrating sphere, placed immediately below the aperture wheel, with fixed aperture and baffling. This produces an illumination profile at the detector that is independent of illumination intensity. The baffle tube, located between the integrating sphere and the detector, prevents stray light and reflected light from reaching the detector and keeps the illuminating geometry fixed. A set of six pinhole apertures at the input of the integrating sphere combined with neutral density filters at the entrance of the dewar extension allow a dynamic range in intensity of approximately to be covered. Because all measurements are relative to the photodiodes that monitor the incident flux, knowledge of the exact area of the pinholes is not critical. Furthermore, knowledge of the exact optical densities of the neutral density filters is also not essential. Since neutral density filters can show spectral dependence, pinhole apertures were used to verify the spectral flatness of the ND filters utilized in the set-up at a level sufficient for the measurements reported here.
2.1. Illumination
The detector inside the dewar is illuminated by one of two light sources: a feedback controlled 50 W Quartz-Tungsten-Halogen (QTH) lamp or alternatively a 790 nm diode laser. Light from the QTH light source is guided by a liquid light guide (Newport 77634) to a 70/30 beam splitter for feedback diode pick-up. A Si feedback diode connected to the QTH lamp control electronics stabilizes the QTH light source. Bulbs were changed frequently to avoid end-of-life fluctuations and spectral variations. A filter stack in front of the beam splitter provides for pass-band selection. Depending on the wavelength selected for the measurement, either a 900 nm long-pass filter or a stack of a 1100 nm short-pass filter and a 1000 nm short-pass filter (to improve out-of-band blocking) was inserted into the light path. The pass filter is then followed by one of four band-pass filters.111The following band-pass filters were used: 700 nm central wavelength, 80 nm wide; 880 nm, 50 nm wide; 950 nm, 50 nm wide; and 1400 nm, 80 nm wide. Following the splitter, the re-focussed light beam passes through a filter slide, housing a selectable set of neutral density filters with optical densities 0, 1, 2, and 3. The connection from the warm optics into the dewar is made by a glass rod. Light from the glass rod is then incident on the selected aperture inside the aperture wheel. The aperture wheel has a total of eight positions, six of which house pinholes ranging in diameter from 30 m to 11 mm (30 m, 100 m, 330 m, 1 mm, 3.3 mm, and 11 mm), one position completely blocks the light, and one position is fully open with no aperture ( 13 mm diameter).
The pinhole illuminates the entrance port of a 2-inch integrating sphere (SphereOptics SPH-2Z-4) as shown in Fig. 1. An optional short-pass cold filter (Asahi YSZ1100) between two diffusers just in front of the integrating sphere is used for measurements below 1000 nm. The inside of the integrating sphere is coated with polytetrafluoroethylene (PTFE) based material providing good reflectivity at NIR wavelengths and good low temperature performance.
2.2. Photodiode Calibration
The reciprocity set-up was designed for measurement of substrate removed NIR HgCdTe detectors which exhibit spectral response at visible and NIR wavelengths. Two photodiodes, an InGaAs photodiode and a Si photodiode, were selected for good wavelength coverage. The NIR photodiode is a blue extended InGaAs PIN diode (Hamamatsu Photonics G108799-01K) with an effective area of 0.785 mm2 and spectral response range of 0.5 m to 1.7 m. For improved sensitivity in the visible, a Si photodiode (Edmund Optics 53371) with an effective area of 5.1 mm2 and spectral response between 0.5 m and 1.1 m was used. The two photodiodes were mounted adjacent to each other to an open port of the integrating sphere as shown in Fig. 1 and were read out in parallel.
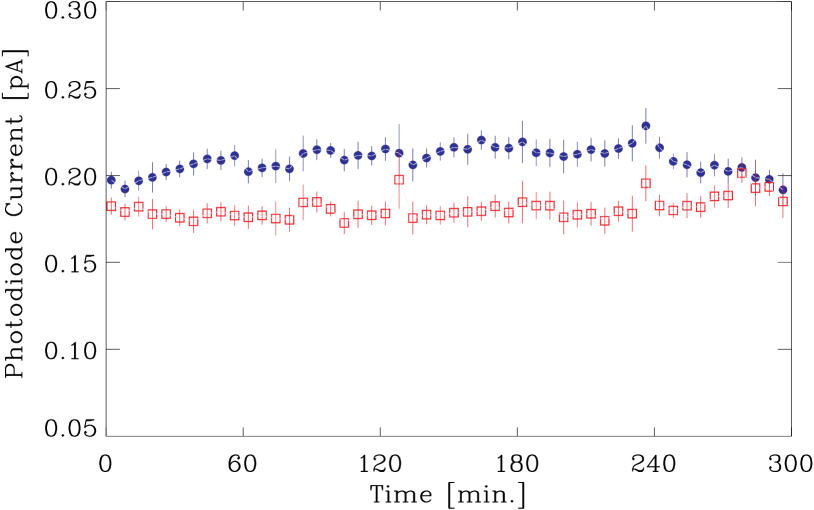
The photodiode currents were recorded by two Keithley 6485 pico-ammeters that were read out through a GPIB interface by the data acquisition computer. For stable performance, the pico-ammeter was turned on at least 1 hour prior to every series of measurements. Typical photodiode currents were of order 1 pA to 10 nA for the InGaAs photodiode and 10 pA to 100 nA for the Si photodiode. An accurate photodiode current measurement requires multiple samples. This was achieved by operating the pico-ammeter in sampling mode and by averaging over ten such samplings. Instrument drift during very long exposures was tracked by a reference photodiode and subtracted from the photodiode signal as shown in Fig. 2.
Our measurement technique requires that any deviation from photodiode linearity be well characterized and corrected for. Since precise linearity specifications were not available from the photodiode vendors, photodiode linearity was measured in our laboratory. We used a beam-addition method in which a small, constant “test signal” was intermittently added to “base signals” of varying intensities as illustrated in Fig. 3.
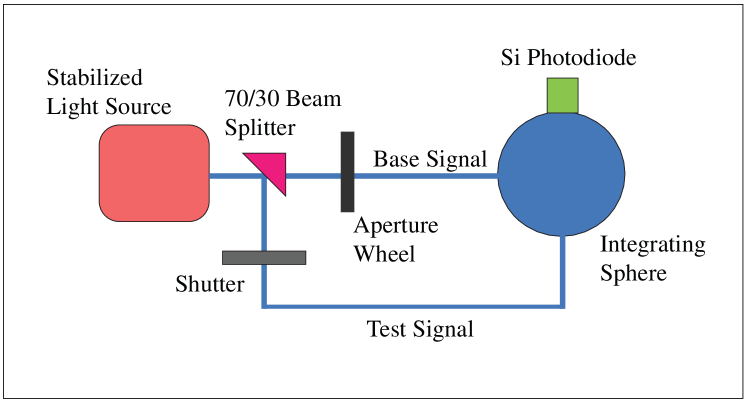
A 70/30 beam splitter following the stabilized light source extracts a constant amount of light, the test signal, that is attenuated and guided through a shutter into the integrating sphere. The direct light beam, the base signal, passes through an aperture wheel allowing to vary base signal intensities. A photodiode is mounted to the integrating sphere and, for different base signals, its response to the base signal alone and to base signal plus test signal is registered. The Si photodiode, which served as the the primary monitoring photodiode for the reciprocity measurement, was used for this calibration. It was illuminated 222Pass-band selected light of 95025 nm was used. at different intensities spanning five orders of magnitude, and a power law model was fitted to evaluate the photodiode linearity. In order to cover five orders of magnitude in illumination, three test signals of approximately 9 pA, 55 pA and 488 pA were used as shown in Fig. 4. The magnitudes of these test signals were fitted along with a power law exponent, resulting in a non-linearity of %/decade. This non-linearity was later utilized to correct the detector response measurements, and its error was assigned as a systematic uncertainty.
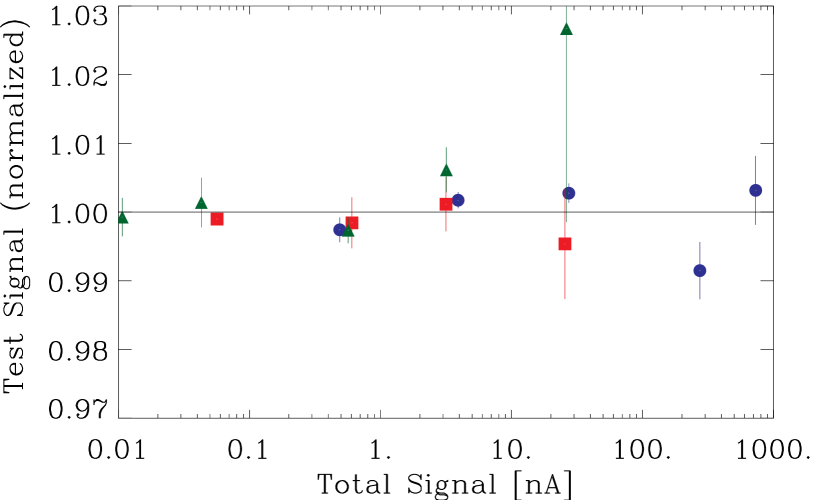
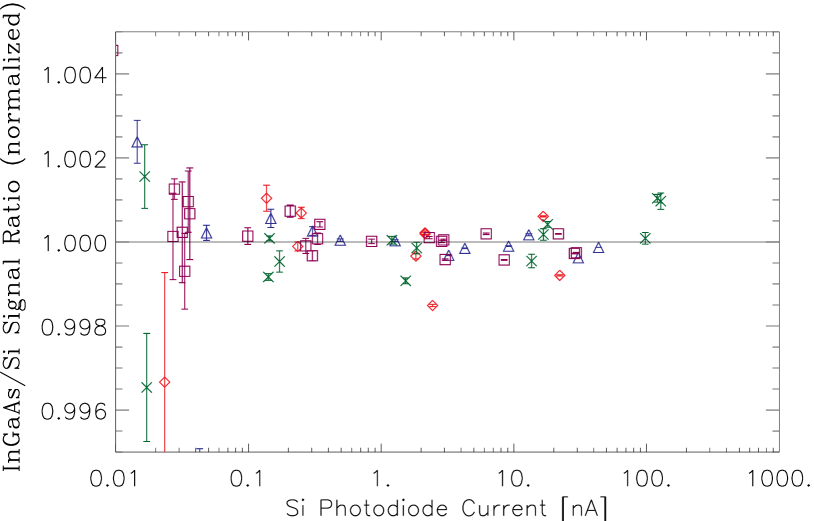
As shown in Fig. 5, the relative linearity of the Si and InGaAs photodiodes is better than 0.1% over the dynamic range of illumination 333The dynamic range corresponds to photodiode currents between approximately 1 pA and 100 nA. and wavelength used during the reciprocity measurements. This agreement gives us confidence that the absolute linearity of the InGaAs photodiode is also of the order of 0.1%/decade, which is consistent with previous linearity studies of Si and InGaAs photodiodes (Budde, 1979; Yoon et al., 2003).
2.3. Cryogenic System
Reciprocity failure in NIR devices was characterized at a baseline temperature of 140 K in an 8-inch dewar manufactured by IR Labs. The hold time of the system is typically 6 to 8 hours, longer than the longest sampling sequence which takes about 5 hours to complete. This guarantees that measurements are not disrupted by the liquid nitrogen refill process. For all measurements, the NIR detector was mounted to a fixed copper heater plate which is weakly thermally coupled to the liquid nitrogen reservoir and thermally stabilized to 10 mK. The cool-down and warm-up ramp of 1 K/min as well as temperature stabilization of the NIR detectors at the operating temperature was controlled and monitored by a precision temperature controller (Lakeshore 330). With the temperature of the detector held constant at K, the illumination system inside the dewar was allowed to cool down to below K at the integrating sphere over a time period of about 8 hours. This is much colder than required to suppress thermal background radiation in the m detector material. A second temperature control loop was used to eliminate temperature dependence in the response of the two photodiodes, which were always temperature stabilized at K.444It was observed that at lower temperatures the InGaAs photodiode response becomes slightly non-linear.
2.4. Read-out and Control Electronics
For detector read-out and control, a commercially available data acquisition system from Astronomical Research Cameras (ARC) was used. In this system, 32 channels of parallel read-out are available from four 8-channel infrared video processor boards combined with clock driver boards and a 250 MHz timing and PCI card. This read-out electronics is described in detail in Leach & Low (2000). Data are stored in FITS format for subsequent analysis. In the current set-up no shutter was employed and thus each detector pixel starts to integrate signal immediately after reset. Consequently, the shortest “illumination time” is determined by the amount of time it takes to read the array. In the default clocking mode (100 kHz) the read-out of the whole array takes 1.418 seconds. To reduce the illumination time, only a partial strip of the detector, 300 2048 pixels was read out for most of the measurements. This decreased the read-out time to 211 milliseconds.
Several detector characteristics depend on the bias voltage settings; the full integration capacity for instance is a function of the reset voltage. All measurements reported here were performed with bias settings that were established to optimize low noise performance. The following voltages were applied: detector substrate voltage Dsub = 0.35 V, reset voltage Vreset = 0.10 V, pixel source follower bias voltage Vbiasgate = 2.45 V, and pixel source follower source voltage Vbiaspower = 3.23 V.
3. Measurements
Following the discovery of dark energy in 1998, one of the earliest experiments put forward to investigate the mysterious new property of the Universe was the Supernova Acceleration Probe (SNAP), a space-based telescope with a large wide field imager comprised of CCD and NIR detectors. The project pursued a strong detector procurement and development program for 1.7 m HgCdTe Focal Plane Arrays (FPAs) with the goal of producing a low read-noise, high quantum efficiency (QE) device suitable for the proposed instrument (Schubnell et al., 2006). Several lots were produced by TIS, with fabrication based on the WFC3 development of 1 k 1 k HgCdTe material. Low read-noise and dark current, high QE as well as substrate removal were addressed during different material growth runs.
One of the devices procured from TIS, H2RG-102, an engineering grade 2 k 2 k 1.7 m cut-off detector mounted on a molybdenum pedestal was characterized with our reciprocity set-up. This FPA is a hybridized detector consisting of a highly integrated CMOS multiplexer and a layer of infrared sensitive detector material. Photon conversion takes place in a very thin layer of HgCdTe, about 5 to 10 m thick (typically grown on a much thicker substrate layer) with metallized contact pads defining the active area. The accumulation of photogenerated electron-hole pairs on the junction capacitance of the pixel causes a decrease in reverse bias which is sensed by a MOSFET source follower. The multiplexer is an array of discrete read-out transistors and, unlike a conventional CCD, can be read non-destructively. Detector layer and multiplexer are indium bump-bonded and mounted to a pedestal which equilibrates the temperature across the FPA.
3.1. System Optimization
Many challenges had to be overcome to achieve the 0.1%/decade sensitivity to reciprocity failure in our system. Initial testing of the set-up indicated that it suffered from light leaks. The cryogenic ports identified as the source of the leaks were shielded, and the internal baffling system was extended to fully cover the detector to eliminate stray light in the system. The drifts in the photodiode readout affecting low illumination measurements were first reduced with better cable shielding and grounding, and finally corrected for in the analysis using the signal from a reference photodiode. It was noticed that dark images (where the aperture was closed) were brighter when the lamp was on than when it was off. This was caused by the light heating the aperture mounts causing them to glow in the NIR. It was mitigated by facing the reflective side of the mounts towards the light and by using a cold short-pass filter between the apertures and the integrating sphere for measurements below 1000 nm. At longer wavelengths, matched dark images were taken with the lamp on to allow a complete subtraction of this small dark glow. One of the greatest challenges involved the spectral mismatch of the detector and photodiode responses. The comparison of the signals from both, the Si and InGaAs photodiodes indicated that the pass-band filters leaked in the red. This was confirmed using a single wavelength laser. Either short-pass or long-pass filters were placed in the light path to improve out-of-band rejection. Monitoring photodiode signal ratios also confirmed that the neutral density filters used were spectrally flat to better than 0.1% in the region we operated. This was not the case for other neutral density filters we checked. Using apertures instead of neutral density filters to control illumination avoids the spectral dependence issue. Hence they were used as the primary means of illumination control. It turned out, however, that the integrating sphere used was not large enough to fully wash out the image of the aperture at its entrance and therefore different apertures resulted in slightly different illumination patterns on the device. This was remedied by two layers of spectrally flat diffusers, added between the apertures and the integrating sphere. Ultimately, the different but complementary means of attenuating the illumination, the apertures and the ND filters, and the different spectral bands probed by the two photodiodes were essential in reaching the required sensitivity in our measurements.
3.2. Test and Analysis Procedure
A comprehensive reciprocity test was performed on device H2RG-102. For all measurements the detector temperature was held constant at 140 K. Measurements were made with the QTH illumination system at wavelengths of 700 nm, 880 nm, 950 nm and 1400 nm and with the laser at 790 nm.
H2RG-102 is a well performing engineering grade device. The detector is substrate removed and has an anti-reflective coating. The QE is greater than 90% from 0.9 m to 1.7 m and the detector response extends far into the visible: at 0.45 m QE is about 40%. The dark current and read-noise performance is good, with a Fowler-16 noise of for a s exposure at K.
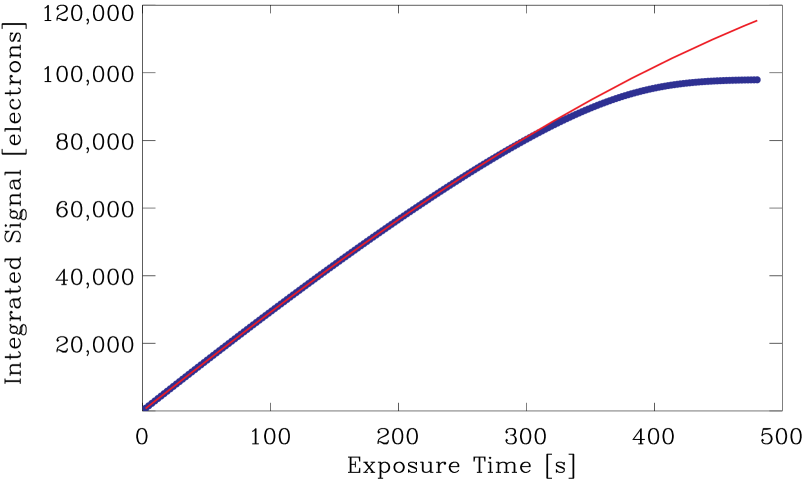
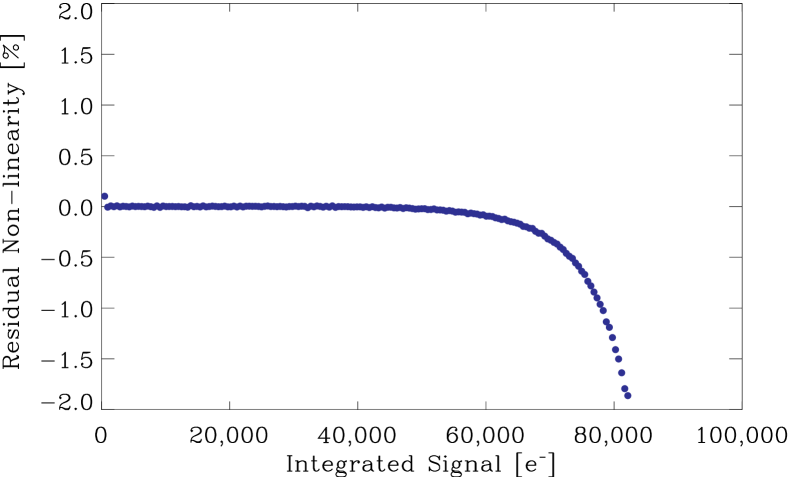
During a typical reciprocity measurement the detector was first reset then repeatedly read non-destructively in a procedure that is generally called “Sample Up the Ramp” (SUR) mode, with up to 200 frames read during an exposure. For every SUR sequence “matched darks” were obtained. Measurement conditions for the matched darks were in every way identical to the reciprocity measurement conditions but exposures were taken with the aperture closed. The integrated signal, , in the detector is parameterized as , where represents the detector count-rate as a function of time , and takes into account classical non-linearity (for details see Appendix). As can be seen in Fig. 6, applying this parametrization describes the observed behavior well. After the correction, the classical non-linearity for signals below 60% of the saturation level is less than 0.1%. Exposed images and matched darks were then included in the fit procedure used in calculating the NIR detector response.
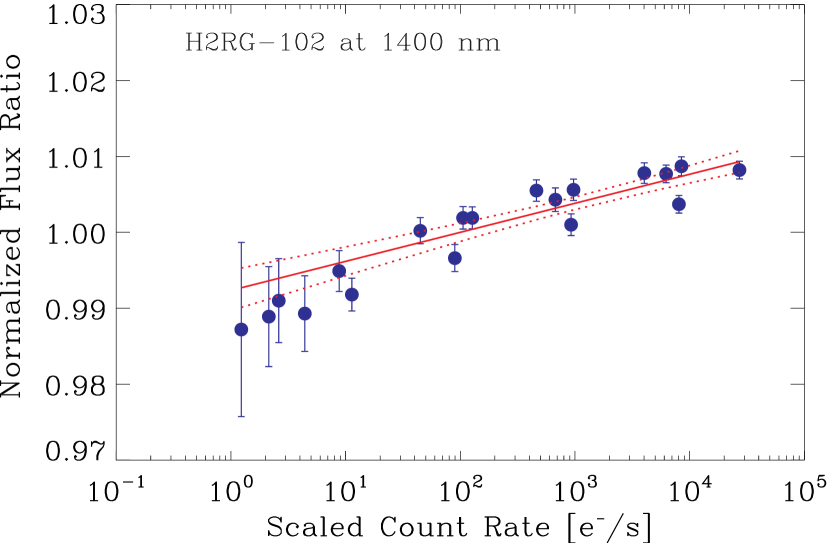
Monitoring photodiode currents were recorded for each frame in the sample and corrected as shown in Fig. 2. Long exposures over several hours were typical at the lowest illumination levels of a few electrons/pixel/second at the detector. It was observed that at the most sensitive setting the pico-ammeter drifts at the 10% level. Those fluctuations were tracked by a reference photodiode connected to a pico-ammeter and removed from the data. The residual variation in the current measurement is dominated by statistical fluctuations and the variance of the mean improves linearly with the number of measurements in the exposure. The Si photodiode itself was found to deviate from linearity at a level of %/decade, requiring a correction that reduced the photodiode signal by this amount. The uncertainty in the Si photodiode calibration along with the InGaAs to Si photodiode ratios constitute the systematic limit of our sensitivity to reciprocity failure of 0.1%/decade. The fitted detector response is divided by the photodiode current resulting in the flux ratios shown in Fig. 7. Normalized flux ratios were obtained at different illumination intensities and at different wavelengths. At wavelengths below 1000 nm, current readings from the Si photodiode and above 1000 nm, readings from the InGaAs photodiode were used for calculating the flux ratios.
 |
 |
In our ad-hoc model, the two non-linearity parameters were fitted simultaneously to all the different illumination intensity sets, while the flux was fit separately. This ensures that reciprocity failure is not hidden in the possible degeneracy of those parameters. It also reduces the uncertainties on the estimated parameters. As a check we also fitted each illumination set separately. The values for reciprocity failure so obtained agreed with the combined fit results. Details of the parametrization are discussed in the Appendix.
3.3. Results
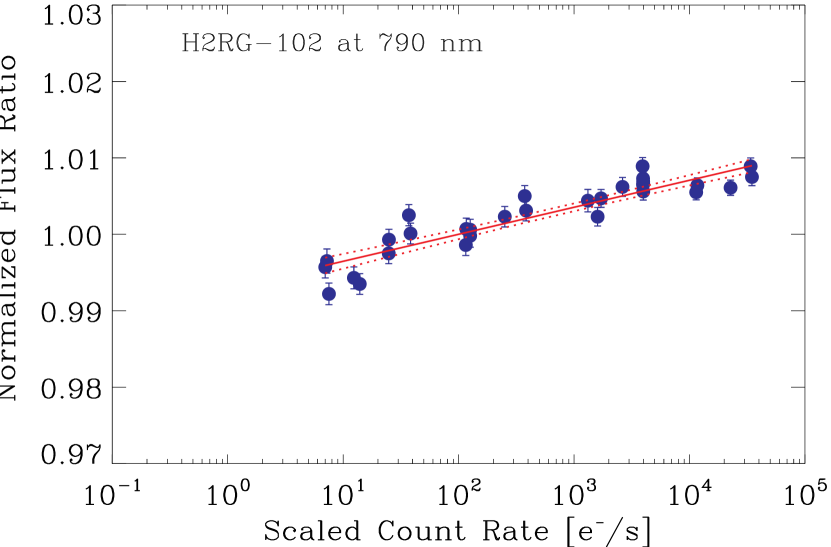
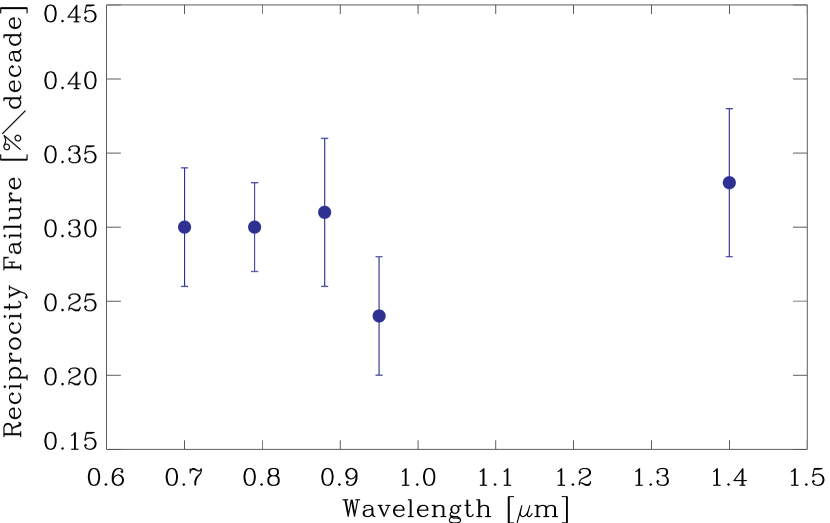
Figure 7 shows the flux ratios as a function of count rate with a logarithmic fit (linear in log illumination) that describes the data well. As indicated in the figure, reciprocity failure for the H2RG-102 detector tested in our set-up is very low. Measurements were performed at five different wavelengths (700 nm, 790 nm, 880 nm, 950 nm and 1400 nm) with no significant wavelength dependence observed as shown in Fig. 8. The NIR detector count rate is scaled relative to the photodiode current to remove flux dependence from the horizontal axis. Measured values for the reciprocity failure at the five wavelengths (in %/decade) are 0.350.04, 0.350.03, 0.360.04, 0.290.04, and 0.380.05. These reciprocity failure values are subject to a 0.08%/decade systematic uncertainty in the photodiode non-linearity correction. This result contrasts with the strong wavelength dependence for reciprocity failure in all three NICMOS detectors.
 |
4. Summary
We have built a test station for the measurement of reciprocity failure in NIR detectors and achieved a sensitivity of approximately 0.1%/decade. Initial measurements were performed on a 1.7m HgCdTe detector (HR2G-102) between 700 nm and 1400 nm which yielded a non-linearity due to reciprocity failure of about 0.35%/decade. We find no indication for wavelength dependence in the tested detector. This contrasts with the reported behavior of the NICMOS detectors on HST. The fabrication of JDEM/SNAP devices is based on WFC3 detector development. This is reflected in measurements on the final candidate detectors for WFC3 which show very similar results as H2RG-102 (Hill et al., 2009). The WFC3 team reports reciprocity failure ranging from 0.3%/decade to 0.97%/decade for three detectors. As they point out, this is significantly smaller than the effect seen for the 2.5 m HgCdTe NICMOS detectors on HST (6%/decade). NICMOS detector material was grown using the liquid phase epitaxy technique while molecular beam epitaxy was used for the growth of material for the WFC3 and for the JDEM/SNAP R&D detectors.
We plan to extend these measurements to a variety of detectors and to use spatial maps and temperature dependence of reciprocity failure to investigate this effect further.
5. Appendix
In order to properly evaluate detector response at differing illumination intensities, care must be taken to distinguish between reciprocity failure and classical non-linearity as the pixel integrates charge.
An ad-hoc three parameter model, intrinsically independent of the intensity level, was produced to describe the change in junction capacitance of the pixel as a function of integrated signal . In a perfectly linear detector the voltage changes by a constant amount for each collected electron until the voltage is sufficient to forward-bias the detector diode. In a real detector this voltage change decreases with increasing . Two parameters, and are used to parameterize this behavior, such that
| (1) |
where is defined to be unity when no charge, , has been collected , and zero when the pixel has “saturated” . The parameter describes how quickly the junction capacitance is changing, as the device becomes linear. The parameter is the maximum voltage that the pixel can record, that is, the pixel saturation level. The rate of signal integration by the device can be written as
| (2) |
where is the time dependent true flux.
Equation (2) can be integrated analyticaly only for certain models of the flux . We approximate the flux as constant illumination plus a dark current (with constant asymptotic value, , and an exponentially decaying component, ). The flux can then be written as
| (3) |
The dark current is fitted separately with the exponentially decaying model using data sets obtained in the dark resulting in the values of , , and being known at the time of the integrated signal fit.
Equation (2) is then integrated to the form
| (4) |
with and defined as
| (5) |
| (6) | |||||
After discarding the first frame to avoid turn-on effects, each SUR image, , is fitted for the three parameters, and . The value of serves as the detector response independent of the classical non-linearity and is divided by the corresponding photodiode current to compute the normalized flux ratio.
References
- Baggett et al. (2008) Baggett, S. M. et al. 2008, Proc. SPIE 7021, 70211Q
- Barron et al. (2006) Barron, N., Borysow, M., Beyerlein, K., Brown, M., Lorenzon, W., Schubnell, M., Tarlé, G., Tomasch, A., & Weaverdyck, C. 2007, PASP, 119, 466
- Bohlin et al. (2005) Bohlin, R., Linder, D. & Riess, A. 2005, NICMOS ISR 2005-002
- Budde (1979) Budde, W. 1979, Applied Optics, 18, 10, 1555
- Durak & Aslan (2004) Durak, M. & Aslan, M. H. 2004, Optics and Laser Technology, 36, 223
- Fischer & Fu (1993) Fischer, J. & Fu, L. 1993, Applied Optics 32, 22
- Hill et al. (2009) Hill et al. 2009, ESO Garching Workshop on Detectors for Astronomy
- deJong et al. (2006) de Jong, R. S., et al. 2006, arXiv:0604394 [astro-ph]
- Leach & Low (2000) Leach, R. W. & Low, F. J. 2000, Proc. SPIE 4008, 337
- Schubnell et al. (2006) Schubnell, M. et al. 2006, Proc. SPIE 6276, 62760Q
- Smith et al. (2008) Smith, R., Zavodny, M., Rahmer, G., Bonati, M. 2008, Proc. SPIE 7021 70210J
- Yoon et al. (2003) Yoon, H. W. et al., 2003, Metrologia 40, S154