The evolution of early-type galaxies in clusters from to : the ellipticity distribution and the morphological mix
Abstract
We present the ellipticity distribution and its evolution for early-type galaxies in clusters from to the current epoch, based on the WIde-field Nearby Galaxy-cluster Survey (WINGS) (), and the ESO Distant Cluster Survey (EDisCS) (). We first investigate a mass limited sample and we find that, above a fixed mass limit (), the ellipticity () distribution of early-types noticeably evolves with redshift. In the local Universe there are proportionally more galaxies with higher ellipticity, hence flatter, than in distant clusters. This evolution is due partly to the change of the mass distribution and mainly to the change of the morphological mix with z (among the early types, the fraction of ellipticals goes from at high-z to at low-z). Analyzing separately the ellipticity distribution of the different morphological types, we find no evolution both for ellipticals and for S0s. However, for ellipticals a change with redshift in the median value of the distributions is detected. This is due to a larger population of very round () elliptical galaxies at low-z. In order to compare our finding to previous studies, we also assemble a magnitude-“delimited” sample that consists of early-type galaxies on the red sequence with . Analyzing this sample, we do not recover exactly the same results of the mass-limited sample.his indicates that the selection criteria are crucial to characterize the galaxy properties: the choice of the magnitude-“delimited” sample implies the loss of many less massive galaxies and so it biases the final conclusions. Moreover, although we are adopting the same selection criteria, our results in the magnitude-“delimited” sample are also not in agreement with those of Holden et al. (2009). This is due to the fact that our and their low-z samples have a different magnitude distribution because the Holden et al. (2009) sample suffers from incompleteness at faint magnitudes.
keywords:
galaxies: clusters: general — galaxies: evolution — galaxies: formation — galaxies: structure — galaxies: ellipticals and lenticulars, cD1 Introduction
Ellipticals and lenticulars (S0s) belong to the class of early-type galaxies. This means that they have several properties in common: they dominate the total galaxy population at high masses, they preferentially inhabit dense regions of the universe, such as rich clusters (Dressler et al., 1997), they tend to be passive, they have red colors and their spectra show strong values of the characteristic feature (see e.g. Kauffmann et al. 2003; Brinchmann et al. 2004); they lack spiral arms and in most cases exhibit neither major dust features nor a large interstellar gas content. For these reasons, often they are considered together.
On the other hand, elliptical and S0 galaxies differ in several important ways: S0s are bulge-dominated systems with an identifiable disk (e.g. Scorza & van den Bosch 1998; Laurikainen et al. 2007), that is mainly rotationally supported (e.g. Erwin et al. 2003; Cappellari et al. 2005), their intrinsic shape is similar to that of spirals (Rood & Baum, 1967; Sandage et al., 1970) and their formation is still not well understood. Hubble (1936) first proposed their existence as transitional class between ellipticals and spirals. Understanding how they form and evolve is essential if we wish to have a complete picture of how galaxy morphology is related to galaxy formation and the environment.
Then again, ellipticals show ellipsoidal shapes, not rarely with significant kinematic twists, and kinematically decoupled components in their centres. Most of them are not characterized by strong rotation (Bertola & Capaccioli, 1975), and their luminosity profiles follow a Sersic’s law. In the Local Universe disky ellipticals are probably the high bulge mass end of S0.
Morphologically, Dressler et al. (1997) showed that, at least for bright galaxies, the raising fraction of early-type galaxies since corresponds mainly to an increase of lenticular S0 galaxies, with a roughly constant elliptical fraction. S0s are quite rare in clusters at high redshift (); as a consequence, they have to acquire their shapes with different time-scales and later than ellipticals. The evolving fraction of S0s in clusters might result from the evolving population of newly accreted spiral galaxies from infalling groups and the field.
Fasano et al. (2000) showed that the cluster S0 to elliptical ratio is, on average, a factor of higher at than at . At higher redshift, there is no evidence for any further evolution of the S0 fraction in clusters to : most of the evolution occurs since (see e.g. Postman et al. 2005; Desai et al. 2007; Wilman et al. 2009).
Dressler et al. (1997) and Postman et al. (2005) also investigated the ellipticity distributions of the S0 and elliptical galaxies in their magnitude limited samples. They found that the ellipticity distribution of S0 and elliptical galaxies show no evolution over the broad redshift ranges in their samples. Moreover, they differ from each other, providing evidence for the existence of two distinct classes of galaxies.
In contrast, in their magnitude-“delimited” sample (with both an upper and a lower magnitude limit), Holden et al. (2009) found no evolution in neither the median ellipticity nor the shape of the ellipticity distribution with redshift for early-type (ellipticals + S0s) red-sequence galaxies. This lead them to conclude that there has been little or no evolution in the overall distribution of bulge-to-disk ratio of early-type galaxies from to . Assuming that the intrinsic ellipticity distribution of both elliptical and S0 galaxies separately remains constant, they finally concluded that the relative fractions of ellipticals and S0s do not evolve from to for a red-sequence selected sample of galaxies.
All the cited works analyzed samples limited in some ways by magnitude cuts. For the first time, in this paper we analyze the evolution of the ellipticity distribution of early-type galaxies also in a mass-limited sample. For the sample in the Local Universe, we analyze the data of the WIde-field Nearby Galaxy-cluster Survey (WINGS) (Fasano et al., 2006), while for that in the distant Universe we use the ESO Distant Cluster Survey (EDisCS) (White et al., 2005). These large cluster samples and their high quality images (see §2) allow us to characterize properly the cluster environment at the two redshifts and to subdivide galaxies into the different morphological types and obtain robust estimates of ellipticity.
This paper is organized as follows: in §2 we present the cluster and galaxy samples (WINGS (Fasano et al., 2006) and EDisCS (White et al., 2005)), describing the surveys, the data reduction, the determination of morphologies, ellipticites and masses. We also depict the selection criteria we follow to assemble the mass-limited and the magnitude-“delimited” samples. In §3 we show the results of our analysis of the evolution of the ellipticity distribution with redshift in our mass-limited samples, while in §4 we show the same for the magnitude-“delimited” samples. In §5 we try to reconcile the results of the different samples, while in §6 we compare our results with those found in literature (in particular with the results drawn by Holden et al. 2009). Finally, in §7 we discuss and summarize our findings.
Throughout this paper, we assume , , . The adopted initial mass function is a Kroupa (2001) in the mass range 0.1-100 .
2 Cluster and Galaxy samples
To perform the study of the ellipticity (, b semi-minor axis, a semi-major axis) distribution and its evolution from to for early-type galaxies and for ellipticals and S0s separately, we assemble two different galaxy cluster samples in two redshift intervals: we draw the samples at low-z from the WIde-field Nearby Galaxy-cluster Survey (WINGS) (Fasano et al., 2006) and those at high-z from the ESO Distant Cluster Survey (EDisCS) (White et al., 2005).
First of all, we use a mass-limited sample, that ensures completeness, i.e. includes all galaxies more massive than the limit regardless of their color or morphological type. We think that this is the best choice to characterize properly galaxy properties.
Then, since Holden et al. (2009) have already analyzed the ellipticity distribution using a sample delimited in magnitude both at faint and bright magnitudes, in order to compare our results with theirs, we also assemble a magnitude-“delimited” sample, following their selection criteria.
2.1 Low-z sample: WINGS
The main goal of WINGS111http://web.oapd.inaf.it/wings (Fasano et al., 2006), a multiwavelength survey of clusters at , is to characterize the photometric and spectroscopic properties of galaxies in nearby clusters and to describe the changes of these properties depending on galaxy mass and environment. The project was based on deep optical (B, V) wide field images of 77 fields (Varela et al., 2009) centered on nearby clusters of galaxies selected from three X-ray flux limited samples compiled from ROSAT All- Sky Survey data (Ebeling et al., 1998, 2000) and the X-ray Brightest Abell-type Cluster sample (Ebeling et al., 1996).
WINGS clusters cover a wide range of velocity dispersion (typically ) and a wide range of X-ray luminosity (typically ).
The survey has been complemented by a near-infrared (J, K) survey of a subsample of 28 clusters obtained with WFCAM@UKIRT (Valentinuzzi et al., 2009), by a spectroscopic survey of a subsample of 48 clusters, obtained with the spectrographs WYFFOS@WHT and 2dF@AAT (Cava et al., 2009), and by U broad-band and narrow-band imaging of a subset of WINGS clusters, obtained with wide-field cameras at different telescopes (INT, LBT, Bok) (Omizzolo et al. 2010).
The spectroscopic target selection was based on the WINGS B, V photometry. The aim of the target selection strategy was to maximize the chances of observing galaxies at the cluster redshift without biasing the cluster sample. Galaxies with a total magnitude, a V magnitude within the fiber aperture of V 21.5 and with a color within a 5 kpc aperture of were selected, to reject background galaxies. The exact cut in color was varied slightly from cluster to cluster in order to account for the redshift variation and to optimize the observational setup. These very loose selection limits were applied so as to avoid any bias in the colors of selected galaxies.
Our optical imaging covers a field. This imaging corresponds to about 0.6 or more, for most clusters, although in a few cases only is covered. is defined as the radius delimiting a sphere with interior mean density 200 times the critical density of the Universe at that redshift, and is commonly used as an approximation for the cluster virial radius. The values for our structures are computed from the velocity dispersions by Cava et al. (2009).
2.1.1 Morphologies
Morphological types are derived from V-band images using MORPHOT, an automatic tool for galaxy morphology, purposely devised in the framework of the WINGS project. MORPHOT was designed with the aim to reproduce as closely as possible visual morphological classifications.
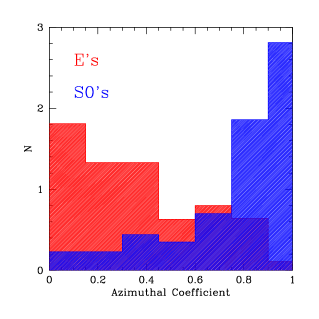
MORPHOT extends the classical CAS (Concentration/Asymmetry/clumpinesS) parameter set (Conselice, 2003), by using 20 image-based morphological diagnostics. Fourteen of them have never been used, while the remaining six [the CAS parameters, the Sersic index, the Gini and M20 coefficients (Lotz et al., 2004)] are already present in the literature, although in slightly different forms. An exhaustive description of MORPHOT will be given in a forthcoming paper (Fasano et al. 2010b), where also the morphological catalogs of the WINGS clusters will be presented and discussed. Provisionally, we refer the reader to Fasano et al. (2007) and Fasano et al. (2010, Appendix A therein) for an outlining of the logical sequence and the basic procedures of MORPHOT. Here we just mention that, among the 14 newly devised diagnostics, the most effective one in order to disentangle ellipticals from S0 galaxies turned out to be an Azimuthal coefficient, measuring the correlation between azimuth and pixel flux relative to the average flux value of the elliptical isophote passing through the pixel itself. From Vulcani et al. (2010b), we report here in Figure 1 a plot illustrating the capability of the distributions of the Azimuthal coefficient in disentangling elliptical from S0 galaxies, a crucial point in the present analysis.
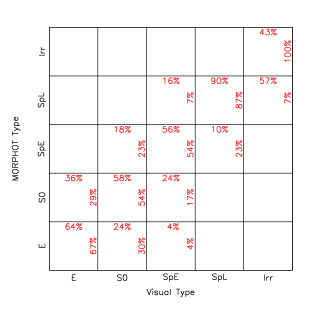
More importantly for our purposes, the quantitative discrepancy between automatic (MORPHOT) and visual classifications turns out to be similar to the typical discrepancy among visual classifications given by experienced, independent human classifiers (r.m.s.1.3-2.3 T types). The last one has been estimated from a sample of 233 SDSS galaxies included in the Third Reference Catalog of Bright Galaxies (de Vaucouleurs et al. 1991, RC3), whose visual classification was carried out independently by GF and AD and also compared with that given in the RC3. The comparison between visual (GF) and automatic (MORPHOT) classification is illustrated in Figure 2 for the MORPHOT calibration sample (931 galaxies). In this figure (from Vulcani et al. 2010b) the automatic classification is also shown to be bias-free in the overall range of morphological types, perhaps apart from the last bin, i.e. that relative to the very late and irregular galaxies.
For now, we can apply MORPHOT just to the WINGS imaging, because the tool is calibrated on the WINGS imaging characteristics, and we defer to a later time a more generally usable version of the tool. In the following, for EDisCS we will use visual morphological classifications. To verify directly that the two methods adopted at different redshifts (see Section 2.2) are consistent, we can apply the same “method” (visual classification and persons) that was used at high-z on the low-z images.
To this aim, 3 of the classifiers that in 2007 visually classified all the EDisCS galaxies (BMP, AAS, VD) now performed a visual classification of WINGS galaxies. This was done on the subset of WINGS galaxies that was used to calibrate MORPHOT on the visual WINGS morphologies, including only galaxies that enter the sample we analyze in this paper (173 galaxies).
The results (see Figure 3 from Vulcani et al. 2010b) show agreement between the three broad morphological classes assigned by the EDisCS classifiers with the WINGS visual classification in 83% of the cases, and with MORPHOT in 75% of the cases. Again, these discrepancies turn out to be similar to the typical discrepancy among visual classifications given by experienced, independent human classifiers, so we conclude that the different methods adopted provide a comparable classification.


2.1.2 Ellipticity measurements
Galaxy ellipticities have been computed using the tool GASPHOT (Pignatelli et al., 2006). This is heavily based on SExtractor (“Source Extractor”) galaxy photometry package (Bertin & Arnouts, 1996) and provides, among other quantities, ellipticity profiles of galaxies extracted from CCD frames. It fits simultaneously the major and minor axis light growth curves of galaxies with a 2D flattened Sersic-law, convolved by the appropriate, space-varying point-spread-function (PSF), which was previously evaluated by the tool itself using the stars present in the frame. This approach exploits the robustness of the 1D fitting technique, saving at the same time the capability, typical of 2D approaches, of dealing with PSF convolution of flattened galaxies. The tool was previously tested for non-Sersic profiles and blended objects and its results compared with other tools, such as GALFIT (Peng et al., 2002) and GIM2D (Marleau & Simard, 1998), as shown in Pignatelli et al. (2006).
Since in our analysis we are comparing the ellipticities of WINGS galaxies to those of EDisCS galaxies, that have been determined using the tool GIM2D (see Section 2.2), we also performed a comparison between the values estimated by the two different tools, for early-types galaxies in the WINGS cluster A119. As shown in Figure 4, the estimates are in good agreement (r.m.s.0.07).

2.1.3 Galaxy stellar masses
Stellar masses have been determined using the relation between and rest-frame color, following Bell & de Jong (2001), who used a spectrophotometric model finding a strong correlation between stellar mass-to-light ratio and optical colors of the integrated stellar populations for a wide range of star formation histories. This method was chosen to be consistent with that adopted for galaxy masses at high-z, and because it can be used also for galaxies with no spectroscopy in the magnitude-“delimited” sample.
We use the equation that Bell & de Jong (2001) give for the Bruzual & Charlot model with a Salpeter (1955) IMF (0.1-125 ) and solar metallicity,
| (1) |
The total luminosity has been derived from the total (SExtractor AUTO) observed B magnitude (Varela et al., 2009), corrected for distance modulus and foreground Galaxy extinction, and k-corrected using tabulated values from (Poggianti, 1997). The color used to calculate masses was derived from observed B and V aperture magnitudes measured within a diameter of 10 kpc around each galaxy baricenter, corrected as the total magnitude.
Then, we scaled our masses to the more used Kroupa (2001) IMF adding -0.19 dex to the logarithmic value of the masses.
Stellar masses for WINGS galaxies observed spectroscopically had been previously determined by fitting the optical spectrum (in the range Å) (Fritz et al. 2010), with the spectro-photometric model fully described in Fritz et al. (2007), and they are in good agreement with the masses used in this paper. For a detailed description of the determination of masses and a comparison of different methods see Fritz et al. (2010), Fig. 1 in Vulcani et al. (2010b) and Valentinuzzi et al. (2010).
2.1.4 Mass-limited sample
For the mass-limited sample, we rely on spectroscopy to be sure that we are using only cluster members. In WINGS, photo-z techniques cannot be used to assess cluster membership due to the low redshift and to the fact the we have at our disposal few photometric bands. Galaxies are considered members of a cluster if their spectroscopic redshift lies within from the cluster mean redshift, where is the cluster velocity dispersion (Cava et al., 2009). We use only spectroscopically confirmed members of 21 of the 48 clusters with spectroscopy. The clusters used in this analysis are listed in Table 1. This is the subset of clusters that have a spectroscopic completeness (the ratio of the number of spectra yielding a redshift to the total number of galaxies in the photometric catalog) larger than 50%. We apply a statistical correction to correct for incompleteness, weighting each galaxy by the inverse of the ratio of the number of spectra yielding a redshift to the total number of galaxies in the V-band photometric catalog, in bins of 1 mag (Cava et al., 2009).
In each cluster, we exclude the brightest cluster galaxy (BCG), defined as the most luminous galaxy of each cluster, that has peculiar properties and could alter the distributions (Fasano et al., 2010).
Only galaxies lying within 0.6 are considered, because this is the largest radius covered in the 21 clusters considered (except for A1644 and A3266 where the coverage extends to ).
To determine the galaxy stellar mass limit of our sample, we compute the mass of an object whose observed magnitude is equal to the faint magnitude limit of the survey, and whose color is the reddest color of a galaxy at the highest redshift considered.
| cluster name | z | DM | ||
|---|---|---|---|---|
| () | (mag) | kpc | ||
| A1069 | 0.0653 | 69068 | 37.34 | 1.65 |
| A119 | 0.0444 | 86252 | 36.47 | 2.09 |
| A151 | 0.0532 | 76055 | 36.87 | 1.83 |
| A500 | 0.0678 | 65848 | 37.42 | 1.58 |
| A754 | 0.0547 | 100048 | 36.94 | 2.41 |
| A957x | 0.0451 | 71053 | 36.50 | 1.72 |
| A970 | 0.0591 | 76447 | 37.11 | 1.84 |
| A1631a | 0.0461 | 64033 | 36.55 | 1.55 |
| A1644 | 0.0467 | 108054 | 36.58 | 2.61 |
| A2382 | 0.0641 | 88854 | 37.30 | 2.13 |
| A2399 | 0.0578 | 71241 | 37.06 | 1.71 |
| A2415 | 0.0575 | 69651 | 37.05 | 1.67 |
| A3128 | 0.06 | 88341 | 37.15 | 2.12 |
| A3158 | 0.0593 | 108648 | 37.12 | 2.61 |
| A3266 | 0.0593 | 136860 | 36.12 | 3.29 |
| A3376 | 0.0461 | 77949 | 36.55 | 1.88 |
| A3395 | 0.05 | 79042 | 36.73 | 1.91 |
| A3490 | 0.0688 | 69452 | 37.46 | 1.66 |
| A3556 | 0.0479 | 55837 | 36.64 | 1.35 |
| A3560 | 0.0489 | 71041 | 36.68 | 1.72 |
| A3809 | 0.0627 | 56340 | 37.25 | 1.35 |
The spectroscopic magnitude limit of the WINGS survey is V=20. Considering the distance module of the most distant WINGS cluster is , and the reddest galaxy has a color of , the magnitude limit corresponds to a mass limit , above which the sample is unbiased. Adopting this limit, the final sample consists of 951 early-type galaxies, of which 364 are ellipticals and 587 are S0s. The corresponding numbers weighted for incompleteness are: 1469 early-types, 557 ellipticals and 912 S0s. Numbers of WINGS galaxies above the EDisCS mass limit (, see below) are 594 early-types (920 once weighted), 224 ellipticals (341 once weighted) and 370 S0s (579 once weighted) (see Table 2).
| WINGS | EDisCS | |||||||
|---|---|---|---|---|---|---|---|---|
| mag | mag | |||||||
| Nobs | Nw | Nobs | Nw | N | N | |||
| ellipticals | 364 | 557 | 224 | 341 | 580 | 145 | 101 | |
| S0s | 587 | 912 | 370 | 579 | 914 | 61 | 43 | |
| early-types | 951 | 1469 | 594 | 920 | 1494 | 206 | 144 | |
2.1.5 Magnitude-“delimited” sample
| cluster name | z | DM | ||
|---|---|---|---|---|
| () | (mag) | kpc | ||
| A85 | 0.0521 | 105268 | 36.83 | 2.54 |
| A133 | 0.0603 | 81078 | 37.16 | 1.95 |
| A147 | 0.0447 | 66613 | 36.48 | 1.61 |
| A160 | 0.0438 | 56153 | 36.44 | 1.36 |
| A168 | 0.0448 | 50343 | 36.49 | 1.22 |
| A193 | 0.0485 | 75959 | 36.67 | 1.83 |
| A311 | 0.0657 | NULL | 37.35 | 0.00 |
| A376 | 0.0476 | 85249 | 36.62 | 2.06 |
| A548b | 0.0441 | 84859 | 36.45 | 2.05 |
| A602 | 0.0621 | 72073 | 37.22 | 1.73 |
| A671 | 0.0507 | 90658 | 36.77 | 2.19 |
| A780 | 0.0565 | 73410 | 37.01 | 1.26 |
| A1291 | 0.0509 | 42949 | 36.77 | 1.04 |
| A1668 | 0.0634 | 64957 | 37.27 | 1.56 |
| A1736 | 0.0461 | 85360 | 36.55 | 2.06 |
| A1795 | 0.0633 | 72553 | 37.27 | 1.74 |
| A1831 | 0.0634 | 54358 | 37.27 | 1.30 |
| A1983 | 0.0447 | 52738 | 36.48 | 1.28 |
| A1991 | 0.0584 | 59957 | 37.08 | 1.44 |
| A2107 | 0.0410 | 59262 | 36.29 | 1.44 |
| A2124 | 0.0666 | 80164 | 37.38 | 1.92 |
| A2149 | 0.0675 | 35353 | 37.41 | 0.85 |
| A2169 | 0.0578 | 50940 | 37.06 | 1.22 |
| A2256 | 0.0581 | 127364 | 37.07 | 3.06 |
| A2271 | 0.0584 | 50410 | 37.08 | 1.21 |
| A2457 | 0.0584 | 58039 | 37.08 | 1.40 |
| A2572a | 0.0390 | 63110 | 36.18 | 1.53 |
| A2589 | 0.0419 | 81688 | 36.34 | 1.98 |
| A2593 | 0.0417 | 70160 | 36.33 | 1.70 |
| A2622 | 0.0610 | 69655 | 37.18 | 1.67 |
| A2626 | 0.0548 | 62562 | 36.94 | 1.51 |
| A2657 | 0.0400 | 38183 | 36.23 | 0.92 |
| A2665 | 0.0562 | NULL | 37.00 | 0.00 |
| A2717 | 0.0498 | 55352 | 36.73 | 1.34 |
| A2734 | 0.0624 | 555 42 | 37.23 | 1.33 |
| A3164 | 0.0611 | NULL | 37.19 | 0.00 |
| A3497 | 0.0680 | 72647 | 37.43 | 1.74 |
| A3528a | 0.0535 | 89964 | 36.89 | 2.17 |
| A3528b | 0.0535 | 86264 | 36.89 | 2.08 |
| A3530 | 0.0544 | 56352 | 36.92 | 1.36 |
| A3532 | 0.0555 | 62153 | 36.97 | 1.50 |
| A3558 | 0.0477 | 91550 | 36.63 | 2.21 |
| A3667 | 0.0530 | 99384 | 36.87 | 2.39 |
| A3716 | 0.0448 | 83339 | 36.49 | 2.07 |
| A3880 | 0.0570 | 76365 | 37.03 | 1.84 |
| A4059 | 0.0480 | 71559 | 36.64 | 1.73 |
| IIZW108 | 0.0483 | 51375 | 36.66 | 1.24 |
| MKW3s | 0.0444 | 53937 | 36.47 | 1.30 |
| RX0058 | 0.0484 | 63797 | 36.66 | 1.54 |
| RX1022 | 0.0548 | 57749 | 36.94 | 1.39 |
| RX1740 | 0.0441 | 58265 | 36.45 | 1.41 |
| Z1261 | 0.0644 | NULL | 37.31 | 0.00 |
| Z2844 | 0.0503 | 53653 | 36.75 | 1.29 |
| Z8338 | 0.0494 | 71260 | 36.71 | 1.72 |
| Z8852 | 0.0408 | 76563 | 36.28 | 1.86 |
For the magnitude-“delimited” sample we use the photometric data for 76 WINGS clusters.222A3562 was excluded due to bad V-band seeing. The clusters used are those presented in Table 1 plus those in Table 3.
We follow the selection criteria proposed by Holden et al. (2009). They selected a sample of early-type galaxies (ellipticals and S0s) that lie on the red sequence (determined with spectroscopic members and accepting all galaxies lying within from the sequence – for details see Mei et al. 2009). At low-z, they used only spectroscopically confirmed members. At high-z they considered all red sequence galaxies in the photometric catalogue except those that are interlopers confirmed by spectroscopy. Moreover, they selected galaxies within a magnitude range, taking into account passive evolution: . Finally, they considered only galaxies within of the cluster center. They computed ellipticities using the results from GALFIT (Peng et al., 2002) and adopted visual morphologies from the literature (Dressler 1980 for the sample at low-z, Desai et al. 2007 and Postman et al. 2005 for the sample at high-z).
For our WINGS magnitude-“delimited” sample, to be strictly consistent with what we do for the EDisCS data-set, we consider all galaxies in the photometric catalogue, excluding those that are non-members based on the spectroscopy. Contamination on the red sequence at low-z is minimal, and we have checked that the results remain the same using only spectroscopic members corrected for completeness. We exclude from our analysis galaxies located outside of , to be consistent with what we do at high-z (see §2.2.2).
We then select only galaxies lying within from the red sequence. Like Mei et al. (2009), we define the red sequence using only spectroscopic members and we build a color-magnitude diagram for each cluster. To do this, we use the observed B and V aperture magnitude measured within a diameter of 5 kpc around each galaxy baricenter and the total V SExtractor AUTO magnitude, both corrected for distance modulus and foreground Galaxy extinction, and k-corrected using tabulated values from Poggianti (1997). For those clusters for which spectroscopy was not available, we define the red sequence using the photometry of morphologically selected early-type galaxies. We determine the slope and the dispersion of the red sequence in the color- magnitude diagram perfoming a weighted least-square-fit on the data, giving less weight to the outliers and reiterating 10 times to have a better determination of the parameters.
We include galaxies with , where is the magnitude derived from the total (SExtractor AUTO) observed B magnitude (Varela et al., 2009), corrected as the color. In this way we automatically exclude the BCGs. Finally, we consider only galaxies that are elliptical and S0 following our morphological classification.
Our final magnitude-”delimited” sample consists of 580 ellipticals and 914 S0s, for a total of 1494 early-type galaxies (see Table 2).
2.2 High-z sample: EDisCS
The multi-wavelength photometric and spectroscopic survey of distant clusters named EDisCS (White et al., 2005) has been developed to characterize both the clusters themselves and the galaxies within them. It observed 20 fields containing galaxy clusters at .
Clusters were drawn from the Las Campanas Distant Cluster Survey (LCDCS) catalog (Gonzalez et al., 2001). They were selected as surface brightness peaks in smoothed images taken with a very wide optical filter ( Å). The 20 EDisCS fields were chosen among the 30 highest surface brightness candidates, after confirmation of the presence of an apparent cluster and of a possible red sequence with VLT 20 min exposures in two filters (White et al., 2005).
For all 20 fields, EDisCS has obtained deep optical multiband photometry with FORS2/VLT (White et al., 2005) and near-IR photometry with SOFI/NTT (Aragón-Salamanca et al., 2010). Photometric redshifts were measured using both optical and infrared imaging (see Pelló et al. 2009 and Rudnick et al. 2009 for details). They were computed for every object in the EDisCS fields using two independent codes, a modified version of the publicly available Hyperz code (Bolzonella et al., 2000) and the code of Rudnick et al. (2001) with the modifications presented in Rudnick et al. (2003). Photo-z membership (see also De Lucia et al. 2004 and De Lucia et al. 2007 for details) was established using a modified version of the technique first developed in Brunner & Lubin (2000), in which the probability of a galaxy to be at redshift () is integrated in a slice around the cluster redshift to give for the two codes. A galaxy was rejected from the membership list if was smaller than a certain probability for either code. The value for each cluster was calibrated from EDisCS spectroscopic redshifts and was chosen to maximize the efficiency with which spectroscopic non-members are rejected while retaining at least of the confirmed cluster members, independent of their rest-frame (B-V) color or observed (V-I) color. In practice it was possible to choose thresholds such that this criterion was satisfied while rejecting 45%-70% of spectroscopically confirmed non-members. Applied to the entire magnitude limited sample, these thresholds reject 75%-93% of all galaxies with 24.9. A posteriori, it was verified that in the sample of galaxies with spectroscopic redshift and above the mass limit described below, 20% of those galaxies that are photo-z cluster members are spectroscopically interlopers and, conversely, only 6% of those galaxies that are spectroscopic clustermembers are rejected by the photo-z technique.
Deep spectroscopy with FORS2/VLT was obtained for 18 of the fields (Halliday et al., 2004; Milvang-Jensen et al., 2008). Spectroscopic targets were selected from I-band catalogs, producing an essentially I-band selected sample with no selection bias down to at and at (Halliday et al., 2004; Milvang-Jensen et al., 2008). Typically, spectra of more than 100 galaxies per field were obtained.
ACS/HST mosaic imaging in of 10 of the highest redshift clusters was also acquired (Desai et al., 2007), covering with four ACS pointings a field with an additional deep pointing in the center. This field covers the of all clusters, except for 1232.5-1250 where it reaches (Poggianti et al., 2006). The values for our structures are computed from the velocity dispersions by Poggianti et al. (2008).
2.2.1 Morphologies, ellipticity measurements and galaxy stellar masses
Morphologies are discussed in detail in Desai et al. (2007). The morphological classification of galaxies is based on the visual classification of HST/ACS F814W images sampling the rest-frame Å range, similarly to WINGS.
The determination of ellipticities is presented in Simard et al. (2009). They have been estimated using the tool GIM2D (Galaxy IMage 2D) version 3.2, a fitting program (Simard et al., 2002) that performs a detailed surface brighteness profile analysis of galaxies in low signal-to-noise (S/N) images in a fully automated way. In this paper, we use the ellipticities derived fitting every source in the HST/ACS images with a single Sersic fit model. Since the shape of the PSF on the HST/ACS images varies significantly as a function of position, spatially-varying PSF models for the EDisCS cluster images were constructed.
In this analysis, we consider only 8 of the 10 EDisCS clusters for which HST images are available. In fact, ellipticity measurements are not available for cl 1227.9-1138 and no galaxies of cl 1037.9-1243 enter our final samples (see below the selection criteria).
For EDisCS galaxies, we use stellar masses estimated using the same relation we use for the WINGS dataset, hence again following the Bell & de Jong (2001) method and then converting masses to a Kroupa (2001) IMF. Total absolute magnitudes are derived from photo-z fitting (Pelló et al., 2009), rest-frame luminosities have been derived using Rudnick et al. (2003) and Rudnick et al. (2006) methods and presented in Rudnick et al. (2009). Stellar masses for spectroscopic members were also estimated using the kcorrect tool (Blanton & Roweis, 2007),333http://cosmo.nyu.edu/mb144/kcorrect/ that yields masses in agreement with those used in this paper. For a detailed discussion of our mass estimates and of the consistency between different methods see Vulcani et al. (2010b).
2.2.2 Mass-limited sample
| cluster name | z | ||
|---|---|---|---|
| () | |||
| cl 1040.7-1155 | 0.70 | 418 | 0.70 |
| cl 1054.4-1146 | 0.70 | 589 | 0.99 |
| cl 1054.7-1245 | 0.75 | 504 | 0.82 |
| cl 1103.7-1245 | 0.62 | 336 | 0.41 |
| cl 1138.2-1133 | 0.48 | 732 | 1.41 |
| cl 1216.8-1201 | 0.79 | 1018 | 1.61 |
| cl 1232.5-1250 | 0.54 | 1080 | 1.99 |
| cl 1354.2-1230 | 0.76 | 648 | 1.08 |
For the EDisCS mass-limited sample we use all photo-z members, following the membership criteria described above.
The choice to use the photo-z membership instead of spectroscopically confirmed members is dictated by the fact that otherwise the number of galaxies would be low, not allowing a statistically meaningful analysis.
Moreover, the spectroscopic magnitude limit ranges between I=22 and I=23 depending on redshift, and the corresponding spectroscopic stellar mass limit is (Vulcani et al., 2010). The photo-z tecnique allows us to push the mass limit to much lower values than the spectroscopy. We adopt a conservative magnitude completeness limit for the EDisCS photometry equal to (though the completeness remains very high to magnitudes significantly fainter than , White et al. 2005). We consider the most distant cluster, cl 1216.8-1201, that is located at and determine the value of the mass of a galaxy with an absolute B magnitude corresponding to , and a rest-frame color , which is the reddest color of galaxies in this cluster. In this way, the EDisCS mass completeness limit based on photo-z’s is . This is the mass limit we adopt for our analysis. As we discuss in Vulcani et al. (2010b), spectroscopic and photo-z techniques give very consistent results for the galaxy mass functions in the mass range in common. Also comparing the ellipticity distribution determined using spectroscopic and photo-z data down to the spectroscopic mass limit, we find that they are not statistically different: a Kolmogorov-Smirnov test cannot reject the null hypothesis that the distributions are drawn from the same parent distribution with a probability of (for details on the K-S test see §3). This gives additional support to our choice to use photo-z data.
As for the WINGS mass-limited sample, both BCGs and all galaxies at radii greater than have been excluded from the analysis. Table 4 presents the list of clusters used and some relevant values.
The final mass-limited EDisCS sample of galaxies with a measured ellipticity for consists of 206 early-type galaxies, 145 of which are classified as ellipticals and 61 as S0s (see Table 2).
2.2.3 Magnitude-“delimited” sample
For the magnitude-“delimited” sample at high-z, to follow the same criteria of Holden et al. (2009), we do not consider the photo-z membership, but we exclude only those galaxies that have been identified spectroscopically as non-members. Then, we use all early-type galaxies within of the red sequence and with .
To determine the red sequence of each cluster, as Mei et al. (2009) did, we use only spectroscopic members of our clusters (Halliday et al., 2004; Milvang-Jensen et al., 2008). We build color-magnitude diagrams using the color (that corresponds to in WINGS). Only for cl 1232.5-1250 we use the color because the band is not available.
Similarly to what we do for WINGS, we determine the red sequence by performing a weighted least-square-fit of our data. However, since the resulting red sequences are not always reliable, for all clusters but cl 1232.5-1250, for which we use a different color, we determine a mean slope using only cl 1216.8-1201 and cl 1054.4-1146, two clusters located almost at the same redshift for which the red sequence is well defined from the spectroscopy, and adopt this slope for all clusters. The mean dispersion is determined averaging the dispersion of all clusters except cl 1354.2-1230 that has been excluded because, having too few points, it would give too small a value of the dispersion. Then, we determine separately the red sequence of each cluster, using the slope and the dispersion just determined and finding the most appropriate value of the intercept. Obviously, the red sequence for cl1232.5-1250 is determined separately using its spectroscopic data.
Subsequently, we consider only galaxies within (as for WINGS), instead of 2 as Holden et al. (2009) did, to improve the statistics.
Our final sample consists of 101 ellipticals and 43 S0s, for a total of 144 early-type galaxies (see Table 2).
3 Results: the ellipticity evolution in Mass-limited samples
In this section, we analyze the ellipticities of galaxies in our mass limited samples.
3.1 Ellipticity and S0/E number ratio as a function of galaxy stellar mass
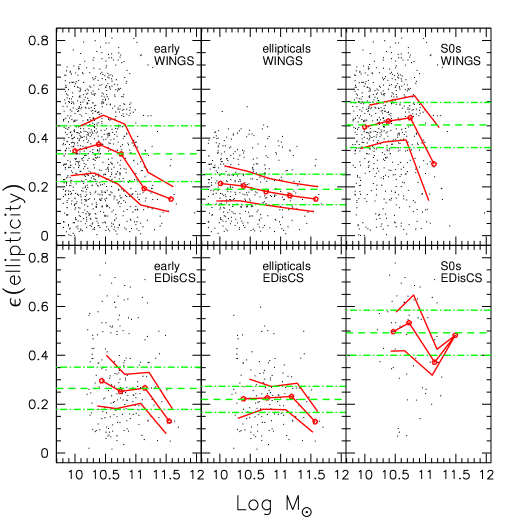
Figure 5 shows the trend of ellipticity as a function of galaxy stellar mass for early-type, elliptical and S0 galaxies for the WINGS and EDisCS samples, above their mass completeness limits. We compute the median values of ellipticity both over the whole mass range (green dashed lines) and in mass bins of 0.4 dex (red solid lines).
At both redshifts, the trend of the ellipticity of all early-type galaxies together clearly depends on galaxy mass. Less massive galaxies tend to have ellipticities that extend to much higher values compared to higher mass galaxies which populate only the lower end of the range. Considering only ellipticals, the trend is much less striking, though still present over the whole mass range in WINGS, while a drop is observed only above in EDisCS. The median ellipticity of S0s shows no clear trend with galaxy mass, at least below in WINGS. At high masses, both the apparent fall in WINGS and the rise in EDisCS may be simply due to low number statistics.
We note that ellipticals always have an ellipticity lower than 0.6 and mostly below 0.4, while S0s cover a wider range of ellipticities, with the majority being concentrated at high values of ellipticities, above 0.4. Furthermore, ellipticals reach higher mass values than S0s (see Vulcani et al. (2010b) for the mass distribution of ellipticals and S0s in these samples, see also §5).
Clearly, the strong trend of ellipticity with mass observed in early-types is due both to the trend of ellipticity of elliptical galaxies with mass, and, mostly, to the fact the ellipticals and S0s are found in different proportions at different masses: S0 galaxies, with their average higher ellipticities, become more frequent going to lower masses. Figure 6 shows the ratio of the number of S0 to elliptical galaxies at different masses. In WINGS (left panel), the S0/Ell ratio strongly depends on mass: at higher masses there are proportionally more elliptical galaxies than at lower masses. In the highest mass bin, the ratio drops to 0, indicating that there are almost only elliptical galaxies, while at S0s are twice as numerous as ellipticals. In contrast, in EDisCS (right panel) we find that the trend is almost flat up to and S0s are less than half of the ellipticals.
EDisCS clusters are seen at an epoch prior to the build up of the S0 cluster population and Figure 6 clearly shows that such build-up occurs mainly at masses below .

| WINGS | EDisCS | ||
|---|---|---|---|
| ellipticals | 0.1900.011 | 0.1790.011 | 0.2200.011 |
| S0s | 0.4540.014 | 0.4620.015 | 0.4930.032 |
| early-types | 0.3360.012 | 0.3280.016 | 0.2650.013 |
3.2 The evolution of the median ellipticity and of the ellipticity distributions
Table 5 summarizes the median values of ellipticities for both samples over the whole range of masses. Errors are estimated using the bootstrap resampling method. We adopt these estimates because we want to characterize the errors on the medians and not the dispersion of the points around the median value (that is the standard deviation). In WINGS, the choice of the mass limit ( or ) does not alter the final results.
Comparing low- and high-z, the median ellipticity of S0s is compatible within the errors at the two redshifts, while it slightly changes with redshift for ellipticals, and more noticeably for early-types. In particular, it slightly decreases going to the current epoch for ellipticals, while it clearly increases for the early-types. This raise for early types isdue to the fact that, as shown in Figure 6, the fraction of S0s increases at low-z, mainly in the low mass range. Since S0s are more flattened than ellipticals, the median ellipticity of early-types shifts to higher values at low redshift. As for the evolution of the median of elliptical galaxies, this will be discussed later in this section.
We now compare the high- and low-z ellipticity distribution,
to see if it evolves. At both redshifts, we consider only galaxies above the common mass limit that is .

We build both the cumulative distributions and histograms (in bins of ellipticity equal to 0.05) for each class of galaxies analyzed. For WINGS, both of them take into account the spectroscopic completeness weights.
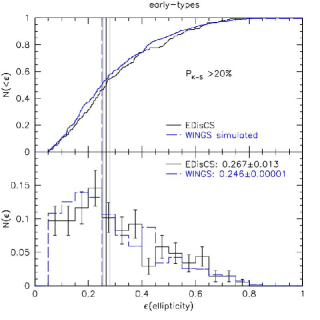
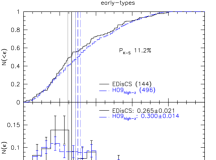
Figure 7 shows how the ellipticity distribution of early-type galaxies evolves with redshift. As expected given the evolution of the median ellipticity, there are proportionally more galaxies with higher ellipticities at low- than at high-z, indicating that low-z early-type galaxies are on average more flattened. The overall WINGS distribution (blue dashed lines) is quite flat, in particular at intermediate values of ellipticity. Instead, the ellipticity distribution of EDisCS early-type galaxies (black solid lines) shows a peak around .
To quantify the differences between the two distributions, we perform a Kolmogorov-Smironov (K-S) test.444The standard K-S, in building the cumulative distribution, assigns to each object a weight equal to 1. Instead, our WINGS data are characterized by spectroscopic completeness weights. So, we modified the test, to make the relative importance of each galaxy in the cumulative distribution depend on its weight, and not being fixed to 1. In the following, we will always use this modified K-S test. Obviously, when using photo-z’s all galaxies have a weight equal to 1, and using the modified test is equivalent to using the standard one. Throughout this paper, we will consider significantly different two distributions if the K-S test gives a probability . For early-type galaxies, the K-S test allows us to exclude the similarity of the ellipticity distributions at the two redshifts, giving a probability of .
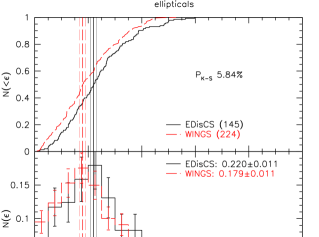
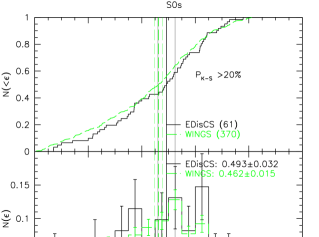
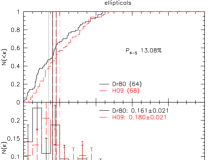
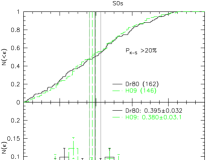
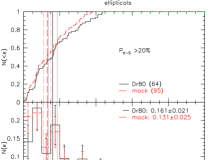
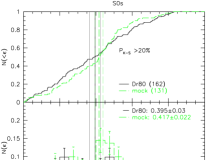
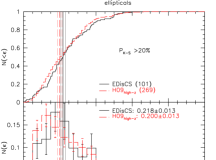
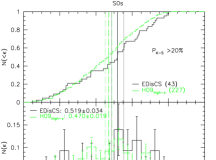
Next, we investigate whether the observed differences are due to an evolution of the ellipticity distribution of ellipticals, of S0s, or both. Figure 8 shows that for ellipticals results are ambiguous: the K-S test, giving a probability of 5.84% of similarity of the distributions, is not strictly conclusive. In contrast, for S0s the distributions are compatible with being similar (P20%). EDisCS S0s are very few and this could influence the results of the K-S test; however, the cumulative distributions appear to resemble each other, indicating that the result of the K-S test should be reliable.
We wish to go deeper into our analysis, trying to understand if the K-S results are confirmed and above all if they are driven by a different shape of the distributions or simply by a different location of the two populations. To do this, we perform two other statistical non-parametric tests (i.e. they do not assume the normal distribution) which make no assumptions about the distributions of the populations.
In Appendix A we present the detailed analysis of the Moses (1963) and Mann & Whitney (1947) tests. In summary, although the K-S test is inconclusive, from these additional tests it emerges that some mild differences exist in the ellipticity distribution of ellipticals at high- and low-z.
3.2.1 Round ellipticals at low-z
Inspecting the histograms in Figure 8, it is clear that, at both redshifts, there are no ellipticals with 0.6 and both distributions are peaked around . It seems that the greatest differences are confined to the extremes of the distributions: in the highest ellipticity bins there are proportionally more EDisCS elliptical galaxies than WINGS’, and more noticeably, in the first bin there are proportionally more WINGS galaxies with than EDisCS galaxies. It is important to stress that this goes in the opposite direction of what could be expected from morphological classification biases at high-z: face-on S0s would be systematically mistaken for ellipticals more frequently at high- than at low-z. Analyzing more accurately the first bin (plot not shown), we find that it is mainly dominated by a second peak around that instead is not detected in the EDisCS distribution. At the moment, we are not able to explain why at low redshift there is an exceeding population of rounder ellipticals compared to high-z; anyway we think it is real, having accurately checked both morphologies and ellipticities for those galaxies.555We find a similar peak also in our low-z magnitude-“delimited” sample (see §4) and also in the low-z sample analyzed by Holden et al. (2009) (see §6), so it can neither due to the adopted selection criteria nor to a bias in our samples.
We have also visually inspected the ellipticity profiles of these round WINGS ellipticals. For a few of them, the profile is altered by crowding, for some other the twist of the isophotes is very marked and the ellipticity value strongly changes with radius. However, 60% of the analyzed galaxies really have a very low ellipticity at all radii. Analyzing and understanding this population goes beyond the scope of this work and it will be discussed in a forthcoming paper. Here, we just notice that this population exists and that it could be the result of dry merger events (van Dokkum et al., 1999; Tran et al., 2005) which might preferentially result in round galaxies building over time.
If elliptical galaxies with are excluded, the WINGS and EDisCS ellipticity distributions for ellipticals are indistinguishable (the K-S test gives a probability that the poopulations are drawn from the same parent distribution).
3.3 What drives the evolution of the ellipticity distribution of early-type galaxies: the evolution of the galaxy mass distributions, or the evolution of the relative proportions of ellipticals and S0s?
To summarize the most important points, in the previous sections we have found that, for mass-limited samples, the ellipticity distribution of early-type galaxies strongly changes with redshift. The ellipticity distributions of ellipticals and S0s on the whole do not evolve significantly, although for ellipticals there is a non negligible shift of the medians of the distributions due to a relative excess of round ellipticals at low-z compared to high-z.
We have found in Figure 5 that above all for early-types there is a trend of ellipticity with mass, and that these trends are different in EDisCS and in WINGS. Moreover, as we have discussed at length in a previous paper (Vulcani et al., 2010b), WINGS and EDisCS have different galaxy stellar mass distributions. We have found that the mass distribution of each morphological type evolves with redshift and that all types have proportionally more massive galaxies at high- than at low-z. As a consequence, if we want to understand the origin of the ellipticity distribution of galaxies of different morphological types and at different redshifts, we have to try to disentangle the influence of the evolution of the mass distribution from the effects of the morphological evolution.
3.3.1 The evolution of the galaxy mass distribution
First, we analyze separately ellipticals and S0s. We perform 1000 Monte Carlo simulations extracting randomly from the WINGS sample a subsample with the same mass distribution as the EDisCS sample, separately for the two different morphological classes. Each time we extract from WINGS the same number of galaxies that are in the EDisCS sample (i.e. 145 ellipticals and 61 S0s). For each simulation we determine the ellipticity distribution, the median value of the ellipticity and we perform a K-S test to compare the result of the simulation with the EDisCS data-set. Then, taking into account all the simulations, we determine both the median value of the K-S and the fraction of simulations that give a conclusive statement (see Table 6).
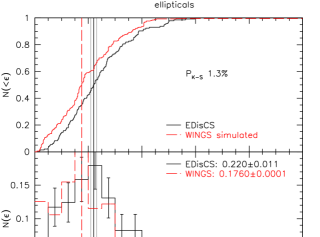
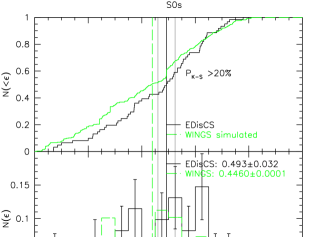
Figure 9 shows our results for the two morphological classes.
| median | ||||||
| mass-matched simulations | ||||||
| ellipticals | 50% | 30% | 9% | 11% | 1.3% | |
| S0s | 1% | 6% | 4% | 89% | 20% | |
| early-types | 18% | 30% | 20% | 32% | 5.2% | |
| morphology-matched simulations | ||||||
| early-types | 0% | 3% | 8% | 89% | 20% | |
The plotted WINGS histogram and cumulative distribution (dashed lines) are the average of the 1000 Monte Carlo simulations. The K-S probabilities and WINGS medians reported in the plots are the medians of the values of all the simulations. Adopting the same mass distribution, for elliptical galaxies, the match of the mass distributions at high- and low-z makes the ellipticity distribution of WINGS galaxies (red dashed lines in the left panel of Figure 9) become significantly different from the EDisCS one. The K-S test gives conclusive results (%) in 80% of the simulations, with a median value of 1.3%, rejecting the null hypothesis of similarity of the two distributions. This seems to imply that WINGS ellipticals tend to be on average rounder than EDisCS ellipticals of the same mass. This effect is mitigated in the observed WINGS vs EDisCS distributions (Figure 8) (yielding a non-significant K-S test) by the fact that a) there are proportionally more less massive galaxies at low- than at high-z (for details on the mass functions see Vulcani et al. 2010b); and b) low-mass ellipticals are more flattened (on average) than high-mass ones. Hence, the increase in the number of low mass ellipticals at low-z largely compensates the existence of a significant evolution in the ellipticity distribution of ellipticals with the same mass distribution (Figure 9), and produces an ambiguous or at best weak evidence for evolution in our analysis of §3.2.
If we neglect galaxies with ,666In this way we wish to compare the whole general distribution without being too much influenced by galaxies located in only one bin. for which the most oustanding differences are detected (see §3.2), adopting the same mass distribution, the median value of the K-S test is , indicating that the major differences between the ellipticals at high- and low-z is indeed the enhanced population of round ellipticals at low-z. Turning to S0s (green dashed lines in right panel of Fig. 9), the mass matched ellipticity distributions of WINGS and EDisCS remain statistically indistiguishable: the K-S test cannot reject the null hypothesis, giving a probability in 93% of the simulations and a median value .
Now we wish to test if the different mass distribution at different redshifts alters the ellipticity distribution of early-types, so we put together WINGS ellipticals and S0s, being sure to extract randomly galaxies in order to have the same EDisCS mass distribution and maintaining the WINGS morphological fractions (i.e. ellipticals and S0s - see Table 7). In this way we test whether the observed evolution of the ellipticity distribution of early-type galaxies can be entirely explained by the evolution of the mass distributions.
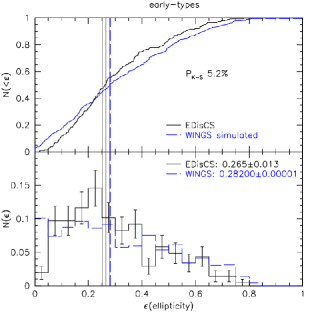
In Figure 10 the K-S gives a probability that the two distributions are driven from the same parent distribution in 48% of the simulations (Table 6), and a median probability for all simulations of 5.2%. Excluding galaxies with , the K-S results remain similar (median , in 55% of the simulations, plot not shown). These values suggest that the different mass distribution at the different redshifts influences at some level the evolution of the ellipticity distribution, even if probably it is not the main factor as it cannot fully explain the observed evolution.
| WINGS | EDisCS | |||||||
| Mass-limited | Mag-delimited | Mass-limited | Mag-delimited | |||||
| %obs | %w | %obs | %w | % | % | % | ||
| ellipticals | 38.31.7% | 37.91.3% | 37.72.1% | 37.11.7% | 38.81.3% | 70.43.3% | 70.14.0% | |
| S0s | 61.71.7% | 62.11.3% | 62.32.1% | 62.91.7% | 61.21.3% | 29.63.3% | 29.94.0% | |
3.3.2 The evolution of the morphological fractions
We now wish to assess the role played by the evolution with redshift of the relative morphological fractions. In Table 7 we show how much the morphological fractions change with time, both for the mass-limited sample and for the magnitude-“delimited” one (see §4). We observe that while at high redshift ellipticals are more common than S0s ( and respectively), in the Local Universe S0s dominate, representing of the early-types.
To analyze the importance of this evolution, we now perform a second test, extracting randomly from the WINGS data-set a subsample of galaxies with approximately the same relative fraction of S0s and ellipticals as EDisCS (i.e. in each simulation we extract 70 ellipticals and 30 S0s from the WINGS sample) and paying attention to maintain the WINGS mass distribution. In this way we wish to test whether the morphological evolution can account for the ellipticity evolution of early-type galaxies, letting the mass distribution to naturally evolve. We perform 1000 such simulations.
We then compare the ellipticity distribution of the “modified” WINGS sample, to the real EDisCS one. Considering all galaxies (also those with ), (plot not shown) the K-S test is conclusive () in 69% of the simulations, while the median value of the probability is 0.2%, indicating that even assuming the same morphological fraction in the two samples, differences between the two ellipticities distributions are still detected.
Next, we exclude from our analysis those galaxies (both ellipticals and S0s) with , since their presence likely alters the final results. In fact, increasing the number of elliptical galaxies in WINGS from being 40% to 70% of the whole population, the contribution of galaxies with is hugely magnified and it would strongly influence the whole population. For galaxies with , Figure 11 shows that, if at both redshifts we had the same fractions of ellipticals and S0s, the ellipticity distributions for early-type galaxies would be indistinguishable. The K-S test is conclusive () only in 3% of the simulations, while the median value of the probability is .
Importantly, doing the same in the observed distributions and excluding all galaxies with from Fig. 7, the low- and high-z early-type ellipticity distributions remain significantly different, with a K-S test probability to be drawn from the same parent distribution of only 0.002%. Except for the excess of round ellipticals at low-z, the evolution of the ellipticity distribution of early-type galaxies can be fully explained by the morphological evolution.
From this whole section we conclude that it is mainly the relative contribution of each morphological type to the total that is responsible for the evolution of the ellipticity distribution of early-type galaxies, even if the role of the evolution of the mass distribution with redshift is non-negligible. Morphology appears to be the most decisive factor in the evolution of the ellipticity distribution of early-type galaxies: WINGS and EDisCS have a different morphological mix and their ellipticity distribution is regulated by the different relative proportions of ellipticals and S0s.
4 Results: the ellipticity distribution in the Magnitude-“delimited” sample
| WINGS | EDisCS | Holden et al. (2009) | Holden et al. (2009) | |
|---|---|---|---|---|
| Mag-delimited | Mag-delimited | low-z | high-z | |
| ellipticals | 0.1760.0073 | 0.2180.01 | 0.180.010 | 0.20 0.010 |
| S0s | 0.4400.0088 | 0.5190.034 | 0.380.020 | 0.47 0.020 |
| early-types | 0.3000.0093 | 0.2650.021 | 0.290.020 | 0.30 0.010 |
From EDisCS and WINGS, we have also selected a magnitude-“delimited” sample of galaxies following the criteria adopted by Holden et al. (2009), as described in §2, with the aim to directly compare our finding with their results.
First of all, we wish to check if the different selection criteria implicate a change in our findings compared to the mass-limited sample.
In the magnitude-“delimited” sample, we qualitatively find the same ellipticity-mass relation we found in Figure 5 (plots not shown) for the mass-limited sample: no trend of ellipticity with mass for S0s, slight trend for ellipticals, and a striking trend for early-type galaxies.
Values of the median ellipticities of the different morphological types can be found in Table 8.
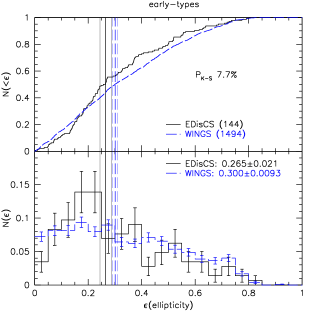
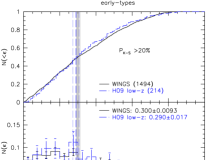
Analyzing the ellipticity distributions in the magnitude-“delimited” sample, for early-types (Figure 12) the K-S test cannot detect a significant evolution with redshift, as it gives a probability of that the two populations are drawn from the same parent distribution. However, the median ellipticities are different: the median is higher at low-z (see also Table 9).
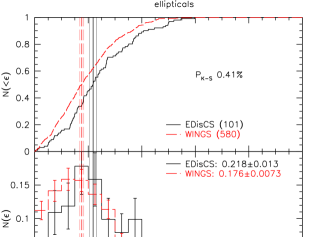
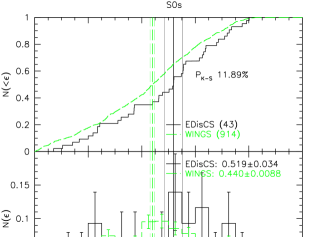
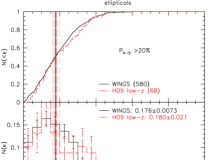
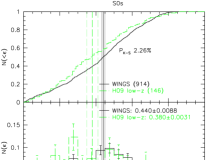
Figure 13 shows separately the ellipticity distribution for elliptical and S0 galaxies. We find that the ellipticity of elliptical galaxies evolves noticeably with redshift: in WINGS (red dashed lines in the left panel of Figure 13) there are proportionally more galaxies with low values of ellipticity, (), while in EDisCS (black solid lines) there is a noticeable peak around . The K-S test excludes that elliptical galaxies have a common ellipticity distribution at the different redshifts, giving a probability of that they are drawn from the same parent distribution. In contrast, the same test cannot distinguish any differences between the distributions of S0s, giving a probability of . However, we note that the median ellipticity of S0s is significantly lower at low-z.777Performing the Moses test, we can conclude that the early-types are unlikely to have the same scale parameter (with a probability of in 53% of the simulations), while for both ellipticals and S0s we cannot exclude a compatibility of the scale parameter, with a probability in 39% and in 10% of the simulations respectively. From the Mann- Whitney test, we cannot exclude compatible medians for early-types (with a probability of ), while we can do it for ellipticals and S0s (with a probability of 0.07% and 3.4% respectively) (for details on the tests see Appendix A).
4.1 How can results from different samples be reconciled?
Our mass- and magnitude- (de)limited samples give different results. In Appendix B we discuss the reasons for the observed discrepancies, comparing directly the ellipticity distributions of the mass-limited and magnitude-“delimited” samples for the same type of galaxies at the same redshift. Briefly, the origin of the observed differences in the distributions lies in the fact that galaxies in the two samples are characterized by different properties; in particular the magnitude-“delimited” samples are biased and so they are not representative of the overall population. In fact, selecting early-type galaxies on the red sequence only in the magnitude range , we are loosing (the few) most massive galaxies, and a large fraction of the less massive galaxies.
5 Comparison with literature results
We now show that, even adopting the same selection criteria, our results are not in agreement with those reached by Holden et al. (2009), who investigated the evolution in the ellipticity distribution using two magnitude-“delimited” samples of cluster early-type galaxies in two redshift ranges. Their sample in the local Universe () consisted of 10 clusters (for a total of 210 galaxies), while the sample in the distant Universe () consisted of 17 clusters (for a total of 487 galaxies) of galaxies with HST images.
With this selection, their main conclusion is that there is no evolution neither in the median ellipticity nor in the shape of the ellipticity distribution of cluster early-type galaxies with redshift from to . Their median ellipticity at is statistically identical with that at and the shapes of the distributions broadly agree. Moreover, they find a statistically significant evolution in the S0s ellipticity distribution, while they do not detect evolution for the ellipticals.
In Table 8 we compare our median ellipticities with theirs.
Summarizing, comparing the two magnitude-“delimited” samples selected in the same way, even if we both do not detect an overall evolution in the ellipticity distribution for early-types galaxies, we do find an evolution in the median which they do not. Moreover, we find a significant evolution for ellipticals and no evolution for S0s (though again we do find an evolution in the median), while they find no evolution for ellipticals and strong evolution for S0s. This leads us to believe that the agreement for the early-types is not real, but simply due to a particular combination of the distributions of ellipticals and S0s.
We note that both at low and at high redshift, there are some clusters that are in common between our and their samples: at low redshift there are 4: A119, A168, A957x, A1983, at high redshift there are 5: cl 1040.7-1155, cl 1054.4-1146, cl 1054.7-1245, cl 1216.8-1201 and cl 1232.5-1250. For these 5 EDisCS clusters in common at high-z, also the morphological classifications (Desai et al., 2007) and the images used to measure ellipticities are the same.
So we can use this information to try to understand the reason for the discrepancy of the results.
5.1 Origin of the discrepancies
We proceed by comparing separately our WINGS and EDisCS samples with the Holden et al. (2009) samples, trying to identify the reason of the observed differences.
5.1.1 WINGS and Holden et al. (2009)
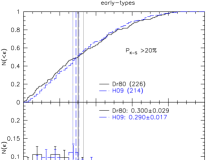
In Figure 14 we compare our results at with those of Holden et al. (2009) at . While the ellipticity distributions of early-type galaxies and ellipticals are consistent with being similar in the two samples (in both cases the K-S test cannot reject the null hypothesis of similarity of the distributions, giving a probability of 888This could be a problem linked to the poor statistic: if we double the number of Holden et al. (2009) galaxies the test becomes conclusive.), those of S0s is remarkably different: WINGS S0s (black solid lines in the right panel of Figure 14) peak around 0.5, while S0s of Holden et al. (2009) (green dashed lines in the same plot) peak around 0.3-0.35, indicating that in the Holden et al. (2009) sample galaxies are on average rounder than in WINGS. The K-S test finds that the distributions can be drawn from the same parent distribution with a probability of only .
Since we adopted Holden et al. (2009) selection criteria, if there are differences, they can be due either to differences in the morphological classification, differences in the measurement of the ellipticities, or to variations of some other galaxy properties. Here we try to analyze each one of these factors.
Since Holden et al. (2009) draw morphologies from Dressler (1980) and in their sample at low redshift there are some clusters in common with WINGS, we select from the catalog of Dressler (1980) galaxies in common with WINGS and see if there are some noticeable differences among them. On the whole, there are 18 clusters in the Dressler (1980) catalog that belong also to WINGS999For this comparison we include in the analysis also those clusters from Dressler (1980) that do not enter the Holden et al. (2009) sample, in order to improve the statistics..
First of all, we select those galaxies that are early-types according to the Dressler (1980) classification and we assign to them our measurements of ellipticity. In this way, we can compare directly our values of ellipticity with those calculated by Holden et al. (2009). Figure 15 shows the ellipticity distribution of the two datasets, for early-type, elliptical and S0 galaxies: the K-S probability is always inconclusive ( respectively).
This is consistent with the assumption that Holden et al. (2009) estimates of galaxy ellipticity are compatible with ours.
Second, we check that using only WINGS clusters classified also by Dressler is equivalent to using the whole WINGS dataset: in fact the ellipticity distributions for WINGS clusters in common with Dressler (1980) (18 clusters) are in agreement with that of our whole sample (76 clusters) (plots not shown, K-S probabilities for all the morphological types). The 3 distributions (early-types, ellipticals and S0s) are very similar, indicating that the WINGS clusters in common with Dressler (1980) are not a biassed subsample of the whole WINGS dataset.
Since ellipticity measurements do not seem to be responsible for the differences between the two datasets, we focus our attention on the other possible sources of differences, starting with the morphological classifications.
We find that 27% (79/296) of the galaxies have been classified differently from us and Dressler (1980). This corresponds to the typical agreement between independent classifiers, see also §2.1. However, we have checked that they are too few to influence the overall ellipticity distribution. Even re-classifing them and moving them to the other morphological class, they do not alter the ellipticity distribution of the class in which they have been inserted.
Moreover, comparing the ellipticity distribution of galaxies belonging to the same morphological class for us and for Dressler (1980), once again we find no significant differences (the K-S test is always largely inconclusive) (plots not shown).
So, the inconsistency is not even linked to the different morphological classification, and we have to focus on possible biases due to other factors.
Third, we investigate the magnitude distributions of Holden et al. (2009) and WINGS samples, to be sure that all samples are equally deep. In Figure 16 we compare the magnitude distribution of the analyzed samples and we find that the magnitude distribution of the subsample of galaxies with Dressler (1980) morphologies (therefore those used by Holden et al. 2009) (red filled histogram) is very different from that of our galaxies, both if we consider only the clusters that are in common (green filled histogram) and if we consider the whole WINGS sample (blue filled histogram). Performing a K-S test on the magnitude distributions, we find that the whole WINGS sample and the subsample of galaxies with Dressler (1980) morphologies are drawn from different parent distributions (). Since we are following exactly the same selection criteria, the magnitude distributions should have been similar. It seems that the Dressler (1980), and hence the Holden et al. (2009), low-z sample misses galaxies at fainter magnitudes. Probably they are too faint to have been morphologically classified by Dressler (1980) who used photographic plates for the classification.
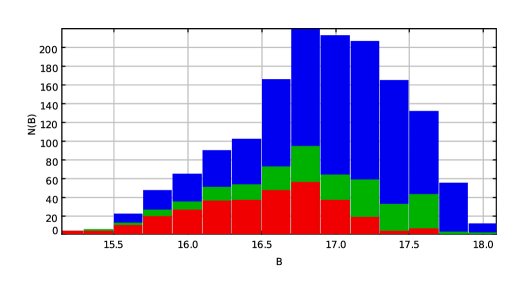
To test whether this bias considerably alters the ellipticity distribution, we create magnitude matched samples, selecting from our WINGS sample a subsample of galaxies with the same magnitude (within 0.05 mag), the same morphology and in the same cluster as the sample of Dressler (1980) used by Holden et al. (2009). As shown in Figure 17, comparing the WINGS magnitude matched simulated sample with the Dressler (hence Holden et al. 2009) sample the ellipticity distributions are compatible, both for early-types, for ellipticals and for S0s (the K-S test can not reject the null hypothesis of common origin of the distribution, giving a probability always ).
We conclude that the differences observed between the WINGS and the Holden samples in the Local Universe are due to the fact that the latter includes only those galaxies that were morphologically classified by Dressler (1980) and does not correspond to a complete sample within the adopted magnitude limits. Therefore, when comparing WINGS and the low-z Holden et al. (2009) sample we are not comparing samples with the same properties, i.e. with the same magnitude distribution.
5.1.2 EDisCS and Holden et al. (2009)
Now we wish to check if there are some differences also between EDisCS and the Holden et al. (2009) sample.
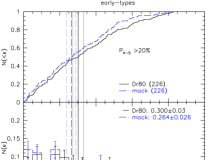
Having the ellipticities of both samples, we can compare directly the ellipticity distributions of the two samples at high redshift. Figure 18 shows the comparison between the EDisCS and Holden high-z ellipticity distributions for the different morphological types. We find that there are no significant differences ( , and for early-types, ellipticals and S0s respectively). Also comparing the ellipticity distribution of galaxies belonging only to the clusters in common (plots not shown), we can state that there are no discrepancies between the samples, as the K-S is always largely inconclusive ( always ).
5.2 Conclusions
To conclude, the different results drawn analyzing our samples and that of Holden et al. (2009) mainly arise from the fact that, despite the fact that in principle galaxies are selected following the same criteria, actually at low redshift they have a different magnitude distribution. The Holden et al. (2009) low-z sample suffers from incompleteness at faint magnitudes, likely due to the lack of availability of Dressler (1980) morphologies at faint magnitudes. No differences have been detected instead at high redshift between Holden’s sample and ours.
6 summary and conclusions
In this paper we have analyzed the ellipticity distribution of early-types galaxies, and of ellipticals and S0s separately, in clusters at and . We have taken into account both a mass-limited sample and a magnitude-“delimited” sample of galaxies.
-
•
In our mass-limited samples, above the common mass limit () the ellipticity distribution of early-type galaxies strongly varies with redshift. This is due to a change both of the median and of the shape of the distributions with redshift. For ellipticals, no statistically significant differences are observed in the high- and low-z distribution, even if an evolution of the medians is detected and we observe an excess population of round ellipticals at low-z compared to high-z. Finally, no evolution is observed for S0s. The evolution of early-type galaxies is not simply related to the different mass distributions at high- and low-z. In fact, removing the influence of the mass, the results remain inconsistent. Instead, it is mainly related to the evolution of the morphological mix with redshift and hence to the relative contribution of ellipticals and S0s at the two epochs.
-
•
As mentioned in the previous point, in our low-z sample, we find a population of very round () elliptical galaxies that is less conspicuous at high-z. This population seems real and not due to selection effects or measurement problems.
-
•
In our magnitude-“delimited” sample, for early-types and S0s the evolution is not evident (though the medians of both early types and S0s change with z), while for ellipticals we have found a change of the distribution with redshift.
-
•
The observed differences between the mass-limited sample and the magnitude-“delimited” one can be due to the different mass distribution of the two samples: in fact in the magnitude-“delimited” samples we are loosing some galaxies that enter the mass-limited one, both at high but especially and more importantly at low masses.
-
•
Our magnitude-”delimited” results are not in agreement with those of Holden et al. (2009), who also analyzed a magnitude-“delimited” sample of early-types belonging to the red sequence. The main reason of the observed discrepancy is that, despite galaxies being selected following in principle the same criteria, in practice the two low-z samples have a different magnitude distribution because the Holden et al. (2009) sample suffers from incompleteness at faint magnitudes.
Acknowledgments
We want to thank B. P. Holden for providing us the lists of ellipticities from his paper. We thank G. Rudnick for his useful comments that improved our paper. BV and BMP acknowledge financial support from ASI contract I/016/07/0.
Appendix A Additional statistical tests
In § 3.2 we characterize the evolution of the ellipticity distribution performing the K-S test. Anyway, since this test is as general as possible, we wish to go deeper into our analysis, trying to understand if the K-S results are confirmed and above all if they are driven by a different shape of the distributions or simply by a different location of the two populations. To do this, we perform two other statistical non-parametric tests (i.e. they do not assume the normal distribution) which make no assumptions about the distributions of the populations.
We use the Moses (1963) test to check the equality of the scale parameter, taking into account that each population has a different median. This test is very useful to compare the shape of two distributions and to evaluate their dispersion. Following this procedure, we subdivide each population into a certain number of groups, each one containing 10 observations. For each group, we compute its average and the sum of the residuals. Then we put all together the residuals of the two populations, paying no attention which one each value belongs to, and we sort them. Afterwards, we sum the rank of each population separately and we compare the sums. If they are very different, the probability that the populations are drawn from the same parent distribution is very small. Since this test requires to consider randomly a subsample of the observations of the populations, we repeat the test 1000 times.101010Since this test is based on random samples, we do not take into account the WINGS’s weights. It emerges that early-type galaxies at different redshifts are unlikely to have the same scale parameter (with a probability in 85% of the simulations), while both ellipticals and S0s show a high compatibility of it (with a probability only in 14% of the simulations in both cases), suggesting that the shapes of the distributions are similar at different redshifts.
Then, to test if there could be a shift in location between the populations, we adopt the U-statistic proposed by Mann & Whitney (1947). This allows us to assess if there are differences in the median values, regardless of the choice of the errors adopted to characterize the medians. This procedure requires to rank all the values, without regard to which population each value belongs to.111111To take into account the WINGS incompleteness, here we consider rounded WINGS’ weights, so that WINGS galaxies can weigh 1, 2 or 3, according to their real weight. Similarly to what we did for the Moses test, we sum the ranks of each population and we compare the sums. Again, if they are very different, the hypothesis that the two populations are drawn from the same parent distribution is ruled out. This test strongly supports the hypothesis that early-types and ellipticals have a different median at different redshifts, while for S0s it cannnot exclude the similarity of them (giving, respectively, a probability of 0.06%, 1.17% and 17.12%). We note that these results are fully in agreement with the bootstrap errors (see Table 5).
A detailed summary and comparison of the results of the different tests is shown in Table 9, both for the mass-limited sample and the magnitude-“delimited” ones (see §4).
| test | early-types | ellipticals | S0s | ||||||
|---|---|---|---|---|---|---|---|---|---|
| KOLMOGOROV- | MASS: | 0.04% | MASS: | 5.84% | = | MASS: | 20% | = | |
| SMIRNOV | MAG: | 7.7% | = | MAG: | 0.41% | MAG: | 11.9% | = | |
| MASS: | in 60% | MASS: | in 3% | = | MASS: | in 2% | = | ||
| 1-5% in 25% | 1-5% in 11% | 1-5% in 12% | |||||||
| 5-10% in 7% | 5-10% in 12% | 5-10% in 10% | |||||||
| MOSES | in 8% | in 74% | in 76% | ||||||
| simulations | MAG: | in 28% | MAG: | in 16% | = | MAG: | in 1% | = | |
| 1-5% in 25% | 1-5% in 23% | 1-5% in 9% | |||||||
| 5-10% in 17% | 5-10% in 10% | 5-10% in 13% | |||||||
| in 30% | in 51% | in 77% | |||||||
| MANN-WHITNEY | MASS: | 0.06% | MASS: | 1.17% | MASS: | 17.12% | = | ||
| MAG: | 13.18% | = | MAG: | 0.07% | MAG: | 3.4% | |||
Appendix B how can results from different samples be reconciled?
From § 3 and § 4 we draw different results. Summarizing, we have found that in our mass-limited sample there is no clear trend between ellipticity and mass for S0s. For ellipticals, this trend is only hinted, with more massive galaxies having slightly lower values of ellipticity, while for early-types it is quite strong and mostly due to the fact that ellipticals and S0s are found in different proportions at different masses.
Comparing the ellipticity distributions at the two redshifts, we have found an evolution for the early-types, with WINGS galaxies being proportionally more flattened than EDisCS galaxies. No strong evolution has been detected for ellipticals and S0s separately, except for the likely presence of an enhanced population of round ellipticals at low-z. Note that this trend for round ellipticals is opposite to the trend for all early-type galaxies (rounder vs flatter at low-z, respectively), therefore we must be observing two distinct evolutionary effects.
In contrast, from the analysis of the magnitude-“delimited” sample, we cannot exclude that, both in the case of early-type galaxies and of S0s, the galaxy samples at high- and low-z are drawn from the same parent distribution, although the change in the median ellipticity values with time seems to indicate an evolution instead. Moreover, we have found a significant evolution (2 error) of the ellipticity distribution of elliptical galaxies, due mainly to a different median of the distributions.
To understand the reasons for the observed discrepancies, we have compared directly the ellipticity distributions of the mass-limited and magnitude-“delimited” samples for the same type of galaxies at the same redshift (plots not shown).
The K-S suggests different distributions () for WINGS early-types and S0s, while it is inconclusive in all other cases (i.e. WINGS ellipticals; EDisCS early-types, ellipticals and S0s, ). Going deeper into the analysis, WINGS early-types show incompatible values both of median (the Mann-Whitney test gives a probability of 0.90%) and of scale parameter (the Moses test gives a probability in 80% of the simulations respectively), while WINGS S0s have different scale parameters (the Moses test gives a probability in 83% of the simulations respectively).
The origin of the observed differences in the distributions probably lies in the fact that galaxies in the two samples are characterized by different properties; in particular in the magnitude-“delimited” samples, selecting galaxies only in the magnitude range , we are loosing (the few) most massive galaxies, and a large fraction of the less massive galaxies.
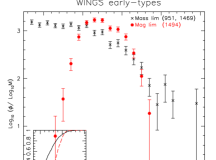
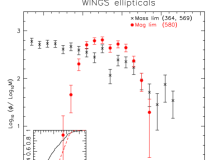
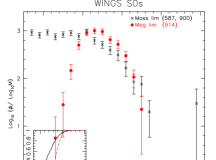
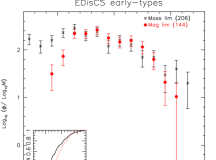
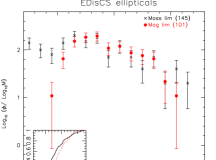

This is evident in Figure 19, where we compare the galaxy stellar mass functions of our mass- and magnitude (de)limited samples, as derived in Vulcani et al. (2010b). It is clear that the magnitude-“delimited” sample is incomplete at low and at high masses, and much more so for S0s at low masses in the local Universe than at high-z.
The net effect of the differential incompleteness in mass at high- and low-z in magnitude selected samples is to artificially deprive the low-z distribution preferentially of high ellipticity (S0) galaxies. The loss of low mass S0s (more flattened) at low-z greatly reduces the differences between the high- and low-z ellipticity distribution of early-type galaxies, bringing their medians to be almost consistent and the K-S test to be inconclusive.
For ellipticals, the net effect of the incompleteness of the magnitude-“delimited” sample is to exacerbate the differences with redshift, again subtracting low-mass (hence higher ellipticity) ellipticals at low-z.
The incompleteness in the mass distributions of the magnitude-“delimited” sample therefore seems to be consistent with the differences we observe between the ellipticity distributions of the mass-limited and of the magnitude-“delimited” sample. The magnitude-“delimited” sample is biassed; in particular, early-type galaxies on the red sequence and with are not representative of the overall population.
References
- Aragón-Salamanca et al. (2010) Aragón-Salamanca, A. et al. in preparation
- Bell & de Jong (2001) Bell, E. F., & de Jong, R. S. 2001, ApJ, 550, 212
- Bertin & Arnouts (1996) Bertin, E., & Arnouts, S. 1996, AApS, 117, 393
- Bertola & Capaccioli (1975) Bertola, F., & Capaccioli, M. 1975, ApJ, 200, 439
- Blakeslee et al. (2006) Blakeslee, J. P., et al. 2006, ApJ, 644, 30
- Blanton & Roweis (2007) Blanton, M. R., & Roweis, S. 2007, AJ, 133, 734
- Bolzonella et al. (2000) Bolzonella, M., Miralles, J.-M., & Pelló, R. 2000, AAp, 363, 476
- Brinchmann et al. (2004) Brinchmann, J., Charlot, S., White, S. D. M., Tremonti, C., Kauffmann, G., Heckman, T., & Brinkmann, J. 2004, MNRAS, 351, 1151
- Brunner & Lubin (2000) Brunner, R. J., & Lubin, L. M. 2000, AJ, 120, 2851
- Cappellari et al. (2005) Cappellari M., et al., 2005, Nearly Normal Galaxies in a LCDM Universe. A conference celebrating the 60th birthdays of George Blumenthal, Sandra Faber and Joel Primack. UC Santa Cruz, Santa Cruz
- Cava et al. (2009) Cava, A., et al. 2009, AAp, 495, 707
- Conselice et al. (2000) Conselice, C. J., Bershady, M. A., & Jangren, A. 2000, ApJ, 529, 886
- Conselice (2003) Conselice, C. J. 2003, ApJS, 147, 1
- de Vaucouleurs et al. (1991) de Vaucouleurs, G., de Vaucouleurs, A., Corwin, H. G., Jr., Buta, R. J., Paturel, G., & Fouqué, P. 1991, Volume 1-3, XII, 2069 pp. 7 figs.. Springer-Verlag Berlin Heidelberg New York,
- De Lucia et al. (2004) De Lucia, G., et al. 2004, ApJL, 610, L77
- De Lucia et al. (2007) De Lucia, G., et al. 2007, MNRAS, 374, 809
- Desai et al. (2007) Desai, V., et al. 2007, ApJ, 660, 1151
- Dressler (1980) Dressler, A. 1980, ApJ, 236, 351
- Dressler et al. (1997) Dressler, A., et al. 1997, ApJ, 490, 577
- Dressler et al. (1999) Dressler, A., Smail, I., Poggianti, B. M., Butcher, H., Couch, W. J., Ellis, R. S., & Oemler, A., Jr. 1999, ApJS, 122, 51
- Ebeling et al. (1996) beling, H., Voges, W., Bohringer, H., Edge, A. C., Huchra, J. P., & Briel, U. G. 1996, MNRAS, 281, 799
- Ebeling et al. (1998) Ebeling, H., Edge, A. C., Bohringer, H., Allen, S. W., Crawford, C. S., Fabian, A. C., Voges, W., & Huchra, J. P. 1998, MNRAS, 301, 881
- Ebeling et al. (2000) Ebeling, H., Edge, A. C., Allen, S. W., Crawford, C. S., Fabian, A. C., & Huchra, J. P. 2000, MNRAS, 318, 333
- Erwin et al. (2003) Erwin, P., Beltrán, J. C. V., Graham, A. W., & Beckman, J. E. 2003, ApJ, 597, 929
- Fasano & Franceschini (1987) Fasano, G., & Franceschini, A. 1987, MNRAS, 225, 155
- Fasano et al. (2000) Fasano, G., Poggianti, B. M., Couch, W. J., Bettoni, D., Kjærgaard, P., & Moles, M. 2000, ApJ, 542, 673
- Fasano et al. (2006) Fasano, G., et al. 2006, AAp, 445, 805
- Fasano et al. (2007) Fasano, G., et al. 2007, From Stars to Galaxies: Building the Pieces to Build Up the Universe, A. Vallenari, R. Tantalo, L. Portinari, & A. Moretti, ASP Conference Series, 374, 495
- Fasano et al. (2010) Fasano, G., et al. 2010, MNRAS, 404, 1490
- Fasano et al. (2010b) Fasano, G., et al. in preparation
- Fritz et al. (2007) Fritz, J., et al. 2007, AAp, 470, 137
- Fritz et al. (2010) Fritz, J., et al. 2010, A&A, in press arXiv 1010.2214
- Gehrels (1986) Gehrels, N. 1986, ApJ, 303, 336
- Gonzalez et al. (2001) Gonzalez, A. H., Zaritsky, D., Dalcanton, J. J., & Nelson, A. 2001, ApJS, 137, 117
- Halliday et al. (2004) Halliday, C., et al. 2004, AAp, 427, 397
- Holden et al. (2009) Holden, B. P., et al. 2009, ApJ, 693, 617
- Hubble (1936) Hubble, E. P. 1936, Realm of the Nebulae, by E.P. Hubble. New Haven: Yale University Press, 1936.
- Jorgensen & Franx (1994) Jorgensen, I., & Franx, M. 1994, ApJ, 433, 553
- Kauffmann et al. (2003) Kauffmann, G.,et al. 2003, MNRAS, 341, 54
- Kroupa (2001) Kroupa, P. 2001, MNRAS, 322, 231
- Laurikainen et al. (2007) Laurikainen, E., Salo, H., Buta, R., & Knapen, J. H. 2007, MNRAS, 381, 401
- Lotz et al. (2004) Lotz, J. M., Primack, J., & Madau, P. 2004, AJ, 128, 163
- Mann & Whitney (1947) Mann, H. B., & Whitney, D. R. 1947, On test of whether on or two random variables is stochastically larger than the other. Ann. Math. Statist, 18, 50
- Marleau & Simard (1998) Marleau, F. R., & Simard, L. 1998, ApJ, 507, 585
- Mei et al. (2009) Mei, S., et al. 2009, ApJ, 690, 42
- Milvang-Jensen et al. (2008) Milvang-Jensen, B., et al. 2008, AAp, 482, 419
- Moses (1963) Moses, L. E. 1963, Rank test of dispersion. Ann. Math. Statist. 34, 973
- Omizzolo et al. (2010) Omizzolo, A. et al. 2010 in preparation
- Pelló et al. (2009) Pelló, R., et al. 2009, AAp, 508, 1173
- Peng et al. (2002) Peng, C. Y., Ho, L. C., Impey, C. D., & Rix, H.-W. 2002, AJ, 124, 266
- Pignatelli et al. (2006) Pignatelli, E., Fasano, G., & Cassata, P. 2006, AAp, 446, 373
- Poggianti (1997) Poggianti, B. M. 1997, AApS, 122, 399
- Poggianti et al. (2006) Poggianti, B. M., et al. 2006, ApJ, 642, 188
- Poggianti et al. (2008) Poggianti, B. M., et al. 2008, ApJ, 684, 888
- Poggianti et al. (2009) Poggianti, B. M., et al. 2009, ApJL, 697, L137
- Postman et al. (2005) Postman, M., et al. 2005, ApJ, 623, 721
- Rood & Baum (1967) Rood, H. J., & Baum, W. A. 1967, AJ, 72, 398
- Rudnick et al. (2001) Rudnick, G., et al. 2001, AJ, 122, 2205
- Rudnick et al. (2003) Rudnick, G., et al. 2003, ApJ, 599, 847
- Rudnick et al. (2006) Rudnick, G., et al. 2006, ApJ, 650, 624
- Rudnick et al. (2009) Rudnick, G., et al. 2009, ApJ, 700, 1559
- Salpeter (1955) Salpeter, E. E. 1955, ApJ, 121, 161
- Sandage et al. (1970) Sandage, A., Freeman, K. C., & Stokes, N. R. 1970, ApJ, 160, 831
- Scorza & van den Bosch (1998) Scorza, C., & van den Bosch, F. C. 1998, MNRAS, 300, 469
- Simard et al. (2002) Simard, L., et al. 2002, ApJS, 142, 1
- Simard et al. (2009) Simard, L., et al. 2009, AAp, 508, 1141
- Smith et al. (2005) Smith, G. P., Treu, T., Ellis, R. S., Moran, S. M., & Dressler, A. 2005, ApJ, 620, 78
- Tran et al. (2005) Tran, K.-V. H., van Dokkum, P., Franx, M., Illingworth, G. D., Kelson, D. D., & Schreiber, N. M. F. 2005, ApJL, 627, L25
- Valentinuzzi et al. (2009) Valentinuzzi, T., et al. 2009, AAp, 501, 851
- Valentinuzzi et al. (2010) Valentinuzzi, T., et al. 2010, ApJ, 712, 226
- van der Wel & van der Marel (2008) van der Wel, A., & van der Marel, R. P. 2008, ApJ, 684, 260
- van Dokkum et al. (1999) van Dokkum, P. G., Franx, M., Fabricant, D., Kelson, D. D., & Illingworth, G. D. 1999, ApJL, 520, L95
- Varela et al. (2009) Varela, J., et al. 2009, AAp, 497, 667
- Vulcani et al. (2010) Vulcani, B., et al. 2010, ApJL, 710, L1
- Vulcani et al. (2010b) Vulcani, B., et al. 2010, MNRAS in press, arXiv:1010.4442
- White et al. (2005) White, S. D. M., et al. 2005, AAp, 444, 365
- Wilman et al. (2009) Wilman, D. J., Oemler, A., Mulchaey, J. S., McGee, S. L., Balogh, M. L., & Bower, R. G. 2009, ApJ, 692, 298