Recent MEG results
Abstract
New results of a search for the ultra-rare decay by the MEG collaboration are reported in this contribution. The data were taken during 2009 and correspond to approximately 6.5 1013 muon stopped on target. A maximum likelihood analysis sets an upper limit at 90% C.L. on the branching ratio, BF() 1.5 10-11. The results presented here are preliminary.
1 INTRODUCTION
Lepton Flavour Violation (LFV) processes in the charged sector are highly suppressed in the Standard Model (SM). This is due to the non-zero neutrinos masses and to their mixing [1]. A SM prediction for BF() is approximately 10-54[2, 3]. Such low BF is virtually unobservable and therefore any positive signal of such reaction would be a clear evidence of New Physics. Supersymmetric models - on the other hand - can generate flavour mixing effects [4, 5, 6, 7, 8] at a level they can be investigate by experiment of the current generation.
We report here on the results of a search for the LFV decay , based on data collected during the 43 days of data acquisition in November and December 2009 by the MEG experiment. The MEG experiment is operated at the 590 MeV proton ring cyclotron facility of the Paul Scherrer Institut (PSI), in Switzerland. The muons originated from a target stop in the experiment with rate adjusted to be 2.8 Hz. In total approximately 6.5 1013 muons were stopped on the target and 22 M triggered events acquired.
2 THE MEG EXPERIMENT
The process is characterized by a simple two-body final state, with the positron and photon being emitted in time and back-to-back in the rest frame of the muon, each with an energy equal to half the muon mass. There are two major sources of background, the dominant being the accidental coincidences between a high energy positron from the principal decay (Michel decay) and a high energy photon from positron annihilation-in-flight or bremsstrahlung or from the radiative muon decay (RMD) . Moreover, a small fraction of RMD is a source of correlated background, producing a high energy photon in time with a positron.
The MEG experiment layout combines the use of a continuous muon beam and a high precision detector with excellent spatial, temporal and energy resolutions. The MEG detector covers 10% of the total solid angle and comprises a photon detector and a positron spectrometer. A schematic of the experiment is shown in Fig.1.

A beam of surface muons of 28 MeV/c is separated by the eight times higher positron contamination with a Wien filter and then stopped in a thin, slanted polyethylene target, placed at the centre of the detector. The use of a helium environment ensures minimal multiple scattering for both the muons and the out-going positrons and limits photon background production in the acceptance region.
Positrons originating from muon decay are analyzed in the COBRA (COnstant-Bending-RAdius) spectrometer consisting of a thin-walled superconducting magnet with a gradient magnetic field and a tracking system of 16 radially aligned modules of low-mass ( in total) drift chambers (DCH). The gradient magnetic field (1.27-0.49 T) has larger acceptance for higher momentum particles and minimizes the track-length of charged particles compared to a uniform field.
Two fast scintillator bars arrays (TC) are placed at each end of the spectrometer and are read at either end by a fine-mesh photomultiplier tube (PMT), providing positron timing information and its impact point position.
Photons are detected in a 900 litre homogeneous volume of liquid xenon (LXe) by measuring the emitted scintillation light with 846 PMTs. LXe has a fast response, large light yield and short radiation length and allows to measure the total energy released by the -ray as well as the position and time of its first interaction.
To select matched photon and positron candidates in a high rate, continuous beam environment and store sufficient information for offline analysis requires a well matched system of front-end electronics, trigger processors and data acquisition (DAQ) software. The front-end electronics signals (2748) are actively split and go to both the trigger and the in-house designed waveform digitizer boards, based on the multi-GHz domino ring sampler chip (DRS). This system achieves an excellent pile-up recognition, together with superior timing and amplitude resolutions, compared to conventional schemes. The trigger is based on fast information from both TC and LXe requiring an energy deposit in the photon detector in an interval around MeV, a time coincident positron hit on TC within 20 ns and a rough collinearity of the two particles. The typical signal event rate was Hz, and the total DAQ rate was Hz, with an average livetime of . The trigger efficiency on signal events is %.
3 CALIBRATIONS and RESOLUTIONS
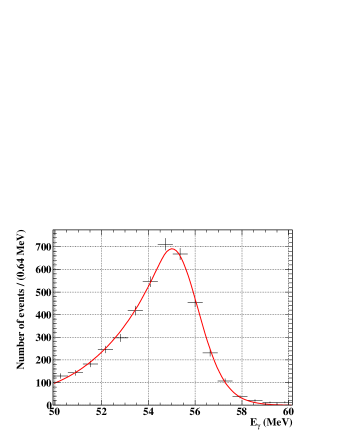
Calibration and monitoring of the apparatus are key ingredients to reach the sensitivity of . In particular the LXe PMT were constantly calibrated with LEDs and -sources. The energy scale and resolution was evaluated with differences processes in a range from few MeV to hundred MeV using (p,) reaction excited with a dedicated proton Cockroft-Walton accelerator and a charge exchange and radiative capture reaction (CEX). The relative time between the LXe and TC was monitored using (p,2) events. The light yield and the energy scale was found to be stable well below 1% level. In Fig.2 the energy spectrum for MeV photons from CEX process is shown, demonstrating that a resolution = 2.1 % has been achieved.
After detailed calibration procedures DCH and TC show good intrinsic position and time resolution for the positron. Measurements of radial positions of a positron track have resolution of 250 m while resolution can be described by a double Gaussian function with = 600 m for 70% of the tracks. TC positron time resolution averaged over the various bars is about 70 .
4 DATA ANALYSIS and RESULTS
Events falling into a pre-defined window (blinding-box), containing the signal region on the -ray energy and the time difference between the -ray and the positron, are written to a separate data-stream, in order to prevent any bias in the analysis procedure. Only the events outside the blinding-box are used for optimizing the analysis parameters and for studying the background.
A candidate event is characterized by the measurement of five kinematic parameters: positron energy (), photon energy (), relative time between the positron and photon () and opening angles between the two particles ( and ).
After the opening of the blinding-box the number of events is determined by means of a maximum likelihood fit in the analysis region defined as , , , and .
An extended likelihood function is constructed as
where , and are the number of , RMD and accidental background (BG) events, respectively, while , and are their respective probability density functions (PDFs). is defined as the total number of events observed in the analysis window and . The signal PDF is the product of the statistically independent PDFs for the five observables (, , , and ), each defined by their corresponding detector response function with the measured resolutions as reported in Tab. 1.
| 0.74 % (core fraction 83 %) | |
| angle | 7.1 mrad ( core), 11.2 () |
| vertex position | 3.3-3.4 mm |
| ( 2) | 2.1% |
| position at LXe | 5-6 mm |
| - timing | 142 ps |
| eff. () | 58% |
| eff. | 40% |
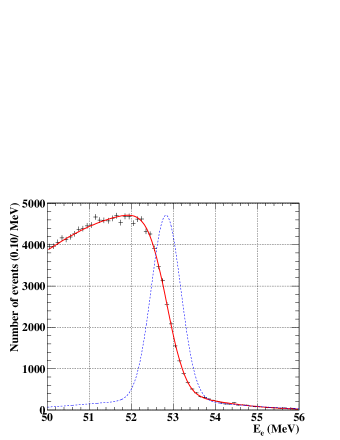
The resolutions of the positron track reconstruction are estimated by exploiting tracks with two full turns in the DCH. Each turn is treated as an independent track and the resolutions are extracted from the difference between the two reconstructed tracks at the point of closest approach to the beam axis. A fit to the kinematic edge of the measured Michel positron energy spectrum gives a cross-check for resolution and set the absolute scale of (Fig.3).
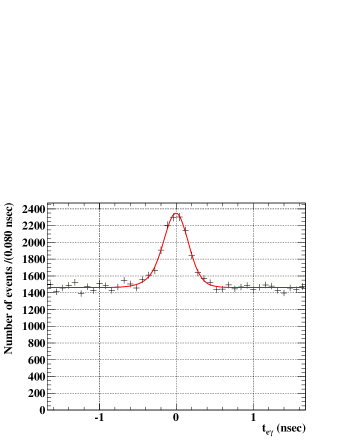
The relative time resolution at the signal energy is estimated from the spread of the RMD peak observed in the region with as shown in Fig.4.
The RMD PDF is the product of the PDF for , which is the same as that for the signal and the PDF for the other correlated observables (, , and ). The latter is formed by folding the theoretical RMD spectrum [11] with the detector response functions. The BG PDF is the product of the background spectra for the five observables, which are precisely measured in the data sample in the side-bands outside the blinding-box.
The number of Michel positrons counted simultaneously with the signal with the same analysis cuts is =18096 acquired with a dedicated trigger with a pre-scale factor = 1.2 . The fraction of Michel spectrum detected in the geometrical acceptance of the spectrometer is calculated to be =0.114. Those numbers are used for normalization of the branching fraction of decay with a small corrections of momentum dependence of efficiencies:
where and are efficiency ratios between signal and Michel positron for trigger and positron reconstruction respectively and are both close to 1. is the -ray detection efficiency conditional to the detection of a corresponding signal positron. In this data samples .
We define the BF sensitivity of this search as the mean value of the 90% C.L. upper-limit distribution evaluated over an ensemble of toy-MC experiments with null signal. For this analysis it results to be 6.1 . This is consistent with upper limits obtained on sidebands samples defined by shifting the values. The likelihood analysis is performed on several comparable analysis windows and the measured upper limits are in the range (4 - 6) .
Fig.5 shows the event distributions inside the analysis region. The events located close to the signal region were carefully checked and no strange behaviour was found. The maximum likelihood fit gives 3.0 as best value. The corresponding is , consistent with the expected number of from the sideband. The confidence region is constructed by means of toy-MC simulation with taking into account possible systematic effects. The PDFs and normalization factor are fluctuated for each toy-MC experiment in accordance with their uncertainty values. The point of =0 is included in the 90% confidence interval, and an upper limit is calculated to be 14.5. This yields an upper limit on the BF
| (1) |
Three independent analyses with different statistical approaches were performed to check the analysis, and gave consistent results.


5 CONCLUSIONS and PERSPECTIVES
A search for the LFV decay was performed with a branching ratio sensitivity of , using data taken during 2009. With this sensitivity a blind likelihood analysis yields an upper limit on the branching ratio of BR (90% C.L.). MEG resumed data-taking in 2010 and is accumulating data with detector stable condition. It will run until the end of 2012 to reach the sensitivity of few .
References
- [1] A. Strumia, F. Vissani, [hep-ph/0606054].
- [2] S. T. Petkov, Sov. J. Nucl. Phys. 25, 340 (1977)
- [3] T. P. Cheng, L. -F. Li, Phys. Rev. Lett. 45 (1980) 1908.
- [4] R. Barbieri, L. J. Hall, Phys. Lett. B338 (1994) 212-218. [hep-ph/9408406].
- [5] R. Barbieri, L. J. Hall, A. Strumia, Nucl. Phys. B449 (1995) 437-461. [hep-ph/9504373].
- [6] J. Hisano, T. Moroi, K. Tobe et al., Phys. Lett. B391 (1997) 341-350. [hep-ph/9605296].
- [7] L. Calibbi, A. Faccia, A. Masiero et al., Phys. Rev. D74 (2006) 116002. [hep-ph/0605139].
- [8] L. Calibbi, J. Jones-Perez, A. Masiero et al., PoS EPS-HEP2009 (2009) 167. [arXiv:0909.2501 [hep-ph]].
- [9] M. L. Brooks et al. [MEGA Collaboration], Phys. Rev. Lett. 83, (1999) 1521.
- [10] J. Adam et al. [ MEG Collaboration ], Nucl. Phys. B834 (2010) 1-12. [arXiv:0908.2594 [hep-ex]].
- [11] Y. Kuno and Y. Okada, Rev. Mod. Phys. 73 (2001) 151.