EAS-TOP Collaboration
The proton-air inelastic cross-section measurement at 2 TeV from EAS-TOP experiment
Abstract
The proton-air inelastic cross section value =33821(stat)19(syst)-28(syst) mb at 2 TeV has been measured by the EAS-TOP Extensive Air Shower experiment. The absorption length of cosmic ray proton primaries cascades reaching the maximum development at the observation level is obtained from the flux attenuation for different zenith angles (i.e. atmospheric depths). The analysis, including the effects of the heavier primaries contribution and systematic uncertainties, is described. The experimental result is compared with different high energy interaction models and the relationships with the pp () total cross section measurements are discussed.
I Introduction
This energy region 2 TeV is of particular relevance because of high energy physics and astrophysics issues.
The pp total cross section, , and are related and can be inferred from each other by means of the Glauber theory. The whole procedure is model dependent, the results gaisser ; d&p ; kopel ; block06 ; bell differing of about 20% for values in the TeV energy range. Available accelerators’ measurements at the highest energies, are themselves affected by systematic uncertainties of difficult evaluation. The pp () cross section measurements at energies of 1.8 TeV cdf ; d0 ; d01 differ of about 10%, exceeding the statistical uncertainties of the measurements. It is therefore of primary interest to have experimental measurements of and at the same center of mass energy, i.e. around 2 TeV, at which collider data are available.
The interpretation of Extensive Air Shower measurements relies on simulations that use hadronic interaction models based on theoretically guided extrapolations of the accelerator data obtained at lower energies and restricted to limited kinematical regions. A direct measurement and the comparison of observables as obtained from measurements and model based simulations, in the same conditions, is therefore highly recommended in order to confirm the validity of the whole analysis procedure.
Measurements of the p-air inelastic cross section performed in EAS have been reported. Since air shower detectors cannot observe the depth of the first interaction of the primary particle, indirect methods have to be used. Two main techniques are used: the constant Ne-Nμ cuts akeno2 ; eastop1 ; argo by means of particle arrays, and the study of the shower longitudinal profiles using fluorescence detectors fly ; hires at higher energies.
Following the particle array technique, the primary energy is first selected by means of the muon number (Nμ). Proton induced showers at the same development stage are then selected by means of the shower size (Ne). The cross section of primary particles is obtained by studying the absorption in the atmosphere () of such showers, through their angular distribution at the observation level. The rate of showers decreases exponentially with zenith angle (i.e. atmospheric depth of first interaction) as:
| (1) |
where is the vertical atmospheric depth of the detector, and the angular acceptance.
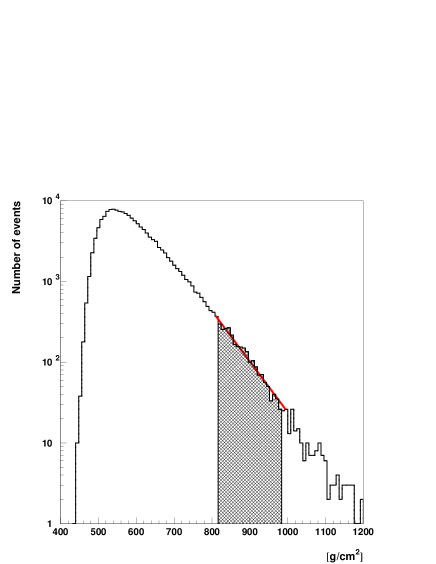
With air fluorescence detectors, the absorption length is obtained fitting the atmospheric depth of the maximum shower development stage () distribution tail.
The observed absorption length in both cases is affected by the fluctuations in the longitudinal development of the cascades and in the detector response. Such fluctuations can be studied through simulations, providing the conversion factor k between the observed absorption length and the interaction length of primary protons (k=). This factor is then used to convert the observed experimental absorption length into the interaction one .
In this paper we will report on the measurement of the p-air inelastic cross section at primary energy eV (i.e. eV 2 TeV) with the EAS-TOP experiment. Primary energies are below the steepening (knee) of the primary spectrum (i.e. E eV) above which the proton flux is strongly reduced. The constant Ne-Nμ analysis has been optimized eastop1 selecting showers at the maximum development stage where fluctuations are lower and heavier primaries rejection is improved by the request of the highest Nevalues at a given primary energy.
The constant Ne-Nμ method with the selection of cascades’ maximum developement stage is equivalent to the study of distribution tail. As shown in Fig. 1, the accessible part of the distribution tail depends from the vertical atmospheric depth () of the detector. This is a limitation on the possibility to exploit this method at different atmospheric depths and on the maximum zenith angle (i.e. atmospheric depth) that can be considered in the analysis without running out of statistics. Systematic uncertainties of the measurement and the effect of possible contributions of heavier primaries are discussed and evaluated.
II The experiment and the simulation
The EAS-TOP array was located at Campo Imperatore, Gran Sasso National Laboratory, 2005 m a.s.l., 820 gcm2 atmospheric depth.
The e.m. detector was made of 35 modules each of plastic scintillators, 4 cm thick, distributed over an area of . The trigger is fully efficient for N, i.e. for primary proton energies eV. The experimental resolutions for N are: N; ; . The arrival direction of the shower is measured from the times of flight among the modules with resolution .
The muon-hadron detector (MHD), located at one edge of the e.m. array, is used, for the present analysis, as a tracking module with 9 active planes. Each plane includes two layers of streamer tubes ( length, section) and is shielded by of iron. The total area of the detector is . A muon track is defined by the alignment of at least 6 fired wires in different streamer tube layers leading to an energy threshold of GeV.
A detailed description of the performance of the e.m. detector and of the muon-hadron detector can be found in Ref. aglio ; adinolfi .
EAS simulations are performed with the CORSIKA program kna with QGSJET II.03 qgsjet2 and SIBYLL 2.1 sibyll high energy hadronic interaction models These models have been widely employed for simulating atmospheric shower developments and have shown to provide consistent descriptions of different shower parameters in the considered energy range. Hadrons with energies below 80 GeV are treated with the GHEISHA 2002 interaction model.
Proton and Helium showers have been simulated with an energy threshold of 1015 eV, spectral index = 2.7 () up to eV. KASCADE-like spectra kascadecomp (resulting from our own fits) have been afterward sampled eastop1 .
Simulated events have been analyzed using the same procedure followed for experimental data.
III The analysis
The rate of showers of given primary energy (E E E0,2) selected through their muon number Nμ (N N Nμ,2) and shower size Ne corresponding to maximum development (N N Ne,2) is measured.
The physical quantities required for the analysis are obtained through simulations, based on QGSJET II and SIBYLL interaction models, as described below.
Events in the specific proton primary energy range ( eV) are selected
by means of a matrix of minimum (Nμ,1) and maximum (Nμ,2)
detected muon numbers for every possible combination of zenith angle
and core distance from the muon detector.
The selection table is obtained from simulated data
for 5 m bins in core distance (50 m r
100 m) and 0.025 bins () for zenith angle.
The selection of proton initiated cascades near maximum development is based on simulated distributions of the shower sizes at maximum development N in the selected energy interval.
Choosing the shower size interval (i.e. 6.01 Log Ne 6.17 for both interaction models)
provides the selection of about of the events around the maximum of the N distribution.


The interaction length is obtained as the average proton interaction depth in the selected energy range, it results to be gcm2 for QGSJET II and gcm2 for SIBYLL.
IV Results
The same analysis procedure discussed for the simulations is applied to the experimental data. The corresponding event numbers as a function of sec() are also shown in Fig. 2, together with their fits providing and for QGSJET II and SIBYLL respectively. From the relation =, we obtain for QGSJET II and for SIBYLL. The p-air inelastic cross section is then obtained from the relation , and results to be with QGSJET II and with SIBYLL analysis.
The contribution of heavier nuclei has been evaluated by simulating helium primaries with QGSJET II, assuming the KASCADE spectrum and composition, which accounts for an helium flux about twice that of the protons in the energy range of interest but, as shown in Fig. 3, due to the high Nevalues requested in our analysis, the helium conatmination is reduced to less than 25%. The overall simulated observed absorption length becomes = g/cm2, which implies k(p+He) = , and = 312 mb. Heavier primaries (i.e. CNO) hardly pass the Nμ-Ne cuts.
The analysis procedure based on one interaction model has been applied to a simulated experimental data set produced with a different interaction model with known p-air inelastic cross section in order to evaluate the systematic uncertainties. The result of the data simulated with SIBYLL (=4061 mb) when analyzed with QGSJET II is =39311 mb (=-1311 mb) and viceversa =41912 mb when the data simulated with QGSJET II (=4001 mb (=+1912 mb) are analyzed with SIBYLL.
An experimental data set has been simulated using QGSJET II with HDPM hdpm cross section value (=3671 mb) in order to check the capability to discriminate between two different values of the p-air cross section within the same interaction model. The lower cross section value is clearly discriminated by the anlysis based on SIBYLL that gives =37213 mb (=-513 mb). The differences between the simulated and measured values () are both positive and negative and compatible with the statistical uncertainties. Therefore we define as maximum systematic uncertainty the value which provides the value corresponding to for the distribution of the four deviations .

V Conclusions
Combining the results obtained with the two considered interaction models and including the systematic uncertainties the p-air inelastic cross section is:
As shown in Fig. 4, this value is about 15% smaller than the values in use within QGSJET II and SIBYLL and in better agreement with Refs. block06 ; hor ; hdpm . Predicted values, obtained from different Tevatron measurements at 1.8 TeV by using different calculations based on the Glauber theory, are reported in Fig. 5. The present measurement is consistent with smaller values of the total cross section (=72.83.1 mb d0 , and =712 mb d01 ), and the pp to p-air calculations predicting for a given value of , a smaller value of block06 ; bell .

Independently from the cross section analysis, the measured values of the absorption length are about 15% higher than the simulated ones for both the considered interaction models. This can be probably ascribed to the fact that the measured cascades penetrate deeper into the atmosphere than predicted by the interaction models.
References
- (1) T. K. Gaisser, U. P. Sukhatme, G. B. Yodh, Phys. Rev. D, 36 (1987) 1350.
- (2) L. Durand and H. Pi, Phys. Rev. D, 38 (1988) 78-84
- (3) B. Z. Kopeliovich, B.Z. Nikolaev, I.K. Potashnikova, Phys. Rev. D, 39 (1989) 769-779.
- (4) M. M. Block, Phys. Rep., 436 (2006) 71-215.
- (5) J. Bellandi et al., Phys. Lett. B 343 (1995) 410.
- (6) F. Abe et al., Phys. Rev. D, 50 (1994) 5550.
- (7) N. A. Amos et al., Phys. Lett. B, 243 (1990) 158.
- (8) C. Avila et al., Phys. Lett. B, 445 (1999) 419.
- (9) T. Antoni et al, Astropart. Phys., 24 (2005) 1-25.
- (10) M. Honda et al., Phys. Rev. Lett., 70 (1993) 525.
- (11) M. Aglietta et al., Phys. Rev. D, 79 (2009) 032004.
- (12) G. Aielli et al., Phys. Rev. D, 80 (2009) 092004.
- (13) R. M. Baltrusaitis et al., Phys. Rev. Lett., 52 (1984) 1380.
- (14) K. Belov et al., Nucl. Phys. Proc. Suppl., 151 (2006) 197-204.
- (15) M. Aglietta et al., Nucl. Inst. Meth. Phys. Res. A, 336 (1993) 310.
- (16) R. Adinolfi et al., Nucl. Inst. Meth. Phys. Res. A, 420 (1999) 117.
- (17) D. Heck et al., Report FZKA 6019, Forschungszentrum Karlsruhe (1998).
- (18) S. Ostapchenko, Phys. Rev. D, 74 (2006) 014026.
- (19) R. Engel et al. Proc. 26th Int. Cosmic Ray Conf., Salt Lake City (USA), 1 (1999) 415.
- (20) J. N. Capdevielle, J. Phys. G: Nucl. Part. Phys. 15 (1989) 909.
-
(21)
J.R. Hörandel, J. Phys. G: Nucl. Part. Phys. 29 (2002) 2439