.
Controlling fast electron beam divergence using two laser pulses
Abstract
This paper describes the first experimental demonstration of the guiding of a relativistic electron beam in a solid target using two co-linear, relativistically intense, picosecond laser pulses. The first pulse creates a magnetic field which guides the higher current fast electron beam generated by the second pulse. The effects of intensity ratio, delay, total energy and intrinsic pre-pulse are examined. Thermal and Kα imaging showed reduced emission size, increased peak emission and increased total emission at delays of , an intensity ratio of (second:first) and a total energy of . In comparison to a single, high contrast shot, the inferred fast electron divergence is reduced by 2.7 times, while the fast electron current density is increased by a factor of 1.8. The enhancements are reproduced with modelling and are shown to be due to the self-generation of magnetic fields. Such a scheme could be of considerable benefit to fast ignition inertial fusion.
pacs:
The study of fast electron transport in high density plasmas is important for numerous applications including proton and ion beam production PhysRevLett.84.670 , isochoric heating of high density matter for opacity studies Hoarty2007115 , and fast ignition inertial fusion Tabak:1994ov .
Electron-driven fast ignition is a promising alternative route to inertial confinement fusion, albeit much less developed than the central hot spot ignition approach. The efficiency of laser energy coupling to the DT fuel is determined by the fraction of energy absorbed into the fast electrons, their temperature, divergence, and the distance from the critical surface to the compressed core Atzeni:2005gf . The electron beam divergence, which is addressed here, can be controlled by target manufacturing techniques campbell:4169 ; robinson:083105 however these have a significant impact on the target complexity and cost.
This letter describes an experimental investigation of a theoretical scheme proposed by Robinson et al. Robinson:2008aa to reduce the fast electron divergence using two laser pulses. The first (lower intensity) pulse accelerates electrons into the target, generating an azimuthal magnetic field within the target. The second laser pulse then accelerates the main fast electron population into the target. If the pre-generated magnetic field is of sufficient magnitude and correct geometry, the divergent main electron population is deflected towards the beam axis, thereby reducing the divergence and further reinforcing the magnetic field.
In addition to generating magnetic fields, the first pulse alters the target front surface, affecting the laser-plasma interaction of the main pulse. Particle-In-Cell (PIC) modelling shows the first laser pulse is sufficiently intense and energetic to hole-bore through the underdense plasma ablated by the pulse’s leading edge, heating it to temperatures of theobald:043102 ; Santos:2007jh . This will cause the front surface to expand during the delay between the pulses.
Previous work by Yu et al CambridgeJournals:4179292 showed (using PIC modelling) that multiple pulses can hole-bore more effectively than an equivalent single pulse in a plasma with a density twice the critical density, . The generation of magnetic fields by using two pulses in a solid target was previously attempted experimentally by Norreys et al 0029-5515-49-10-104023 . The null results were attributed to insufficient current from the first pulse and detrimental effects caused by a pre-pulse. Markey et al PhysRevLett.105.195008 increased the efficiency of proton acceleration by using two pulses. This was attributed to the combined effects of absorption enhancement and a two stage rear surface acceleration process, yielding an optimal pulse delay of .
The experiment reported here provides the first experimental evidence for electron beam guiding in a solid target by using two laser pulses. It was performed using the Vulcan petawatt laser at the Central Laser Facility, Rutherford Appleton Laboratory 0029-5515-44-12-S15 . The 1054 nm laser pulse contained 186 J (except shot ps (the temporal delay between the two pulses) which had J) of energy on target, with 20 of that energy contained within a focal spot of full-width-at-half-maximum (FWHM) in a duration of 1.4 ps, yielding a peak intensity of . A new picosecond OPCPA front-end Musgrave:10 gives intensity contrast and energy contrast , the low contrast front end used for selected shots had an energy contrast of . The Al()Cu()Al() layered planar targets (transverse dimensions 5 mm) were shot (on the thicker Al layer) at 45∘ p-polarization.
Two laser pulses were created by passing the incident beam through a half-wave plate and then a polarizing beam cube. The waveplate angle controls the relative pulse levels (=:) where is the intensity of the first pulse on target. Roof prisms retro-reflected both pulses, the temporal delay between the two pulses () was altered by translating one prism. The polarizations of the pulses were matched, before re-combination in a non-polarizing cube. By interfering pulses from the seed oscillator, the pulses were synchronized to within . Calibration ensured that the sum of the energy in both pulses was constant regardless of .
The target rear surface temperatures were measured using Cu Kα x-ray spectroscopy and streaked pyrometry of the rear surface. A KAP conical crystal with 2D spacing of 26.64 Å focussed the x-rays (including the Cu K and K lines) onto a FUJI BAS image plate meadowcroft:113102 . Bulk electron temperatures within the Cu fluor layer were inferred by fitting Cu K and K line spectra generated by the non-LTE code FLYCHK Chung20053 to the data. F/5.3 optics at 59∘ from target normal collected the visible optical emission from the target rear surface, which was split between a spectrometer and a high speed sampling camera (HISAC)kodama:625 , the latter gave 2D spatial () and temporal resolution () and multiframe capability (1 ns window). The Plankian thermal radiation signal was separated from the prompt optical transition radiation (OTR) signalBATON2003 , by extracting the measurement after the laser interaction - when the OTR signal has decayed. Radiation-hydrodynamic modelling was used to back-out the initial target temperature based on the total thermal emission at =100 ps. hyades PhysRevE.57.4650 was used to model the target hydrodynamic expansion and cooling, and the resultant evolution of the rear surface thermal spectrum during the 100 ps delay. The time varying thermal spectrum was folded with the spectral response of the streak camera optics, tube and spectral filtering, then spectrally integrated giving the emission intensity as a function of time for a given initial target temperature. By changing the initial target temperature, a family of intensity-time curves was generated, relating the initial target temperature to the measured intensity at =100 ps. An absolutely calibrated lamp provided a reference intensity. The measured thermal emission image is caused by the fast electrons heating the target via collisional and collective mechanisms.
The fast electron spatial distribution was measured in a Cu fluor layer beneath the target rear surface. A spherically bent quartz crystal imaged the Cu Kα emission (caused by fast electron collisions) onto a FUJI BAS image plate.
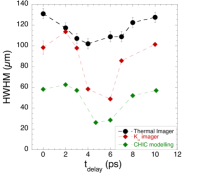
The half-width-at-half-maximum (HWHM) of the Cu Kα and thermal emission spotsizes as a function of are shown in figure 1. For the optimal =, the size of the Kα emission is halved, while the thermal emission is reduced by 25%. The HWHM of the single pulse Cu Kα images increased linearly with target thickness, with a half angle of and source size of 26 µm. Based on this source size, the half angle for = was reduced to - a reduction of 2.7 times.
The differences between the Cu Kα x-ray and thermal imaging diagnostics results depicted in figure 1 are attributed to the thermal signal being extracted 100 ps after the initial interaction - conductivity within the target will increase the thermal emission size over this time.
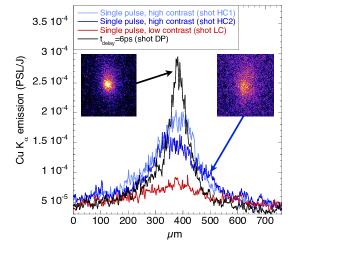
Figure 2 illustrates the change in the fast electron beam profile induced by the double pulse. The enhancements in the peak height and reduction in width when using the optimal parameters are clear from the double pulse shot with =ps (DP), even when compared to the best single pulse shot using Vulcan’s new picosecond OPCPA high contrast front-end (HC1). A comprehensive examination of the effect of the new high contrast front-end was performed by bypassing it during the experiment, reverting to the pre 2010 lower contrast Musgrave:07 . Shot LC was a typical example of Cu Kα imager data using a single, low contrast pulse; the background subtracted peak flux is enhanced by when the double pulse is used with =. It should be emphasized that this was also the first experimental implementation of the new high contrast front end on Vulcan TAP, meaning in one experiment the peak Cu Kα flux has been increased by over the previous state-of-the-art.
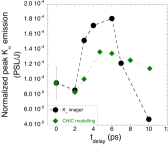
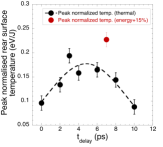
Figure 3 (a) depicts the peak Cu Kα imager emission normalized to laser energy on target - an approximate measure of relative fast electron current density. The peak Kα emission is increased in the range = 3-7 ps, at 6 ps the value is 1.9 times that of a single pulse. Figure 3 (b) shows laser energy normalized target rear surface temperatures. The optimal delay for both the peak Cu Kα imager emission and the thermally derived target rear surface temperatures corresponds with the optimal HWHM (figure 1). The mean rear surface temperature derived from Cu Kα spectroscopy was or 0.139 eV/J (standard deviation 0.028) - very similar to that of the thermal data.
When the energy in the first pulse was halved - both by halving the total energy (90 J) and keeping =10:1, or by switching to =20:1 (182 J) - no evidence of collimation was observed. The laser energy on the nominal shots was within 6% of the mean except shot = which had 15% higher energy than the mean, interestingly the laser energy normalized rear surface temperature (figure 3(b)) is increased by a factor of 2.2 over the single pulse high contrast shot - considerably more than the other double pulse shots. This indicates that with more energy on target the gains due to the two pulse scheme may scale non-linearly with energy.
The experiment was modelled using the 2D radiation hydrodynamics code chic Breil2007785 using MHD and fast electron transport modules. Magnetic fields are generated by the resistive electric field and the cross product of the gradients of the electron density and temperature, while the electric field is calculated assuming total current neutralization. The plasma resistivity was described by the Spitzer formula above and by an interpolation formula PhysRevB.75.195124 below. Fast electron transport is modelled with a reduced kinetic model refId0 ; PhysRevE.84.016402 which includes self-consistent magnetic fields and collisions with plasma electrons and ions. The intensity of Cu Kα emission was calculated with a post-processor.
Two temporally separated electron populations were injected into a 80 µm thick Al target. Both electron beams have the same duration of FWHM. Their radial profiles at the front side were Gaussian distributions of FWHM 34 µm and order 0.7 (i.e. ). The energies in the first and second electron beams were and . This accounts for 20% of the laser energy within the focal spot and absorption fractions of 33% and 42% for the first and second beams, respectively. The energy distribution of fast electrons were Maxwellian with temperatures of and calculated by taking the maximum of either Beg or ponderomotive scaling laws. The angular distribution at the source was chosen according to Ref. PhysRevE.82.036405 with a half angle divergence of 35∘ and the dispersion angle 45∘.
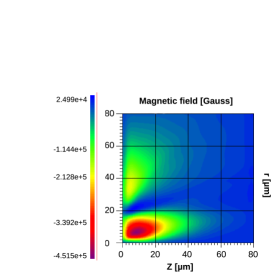
As shown in figure 1, the modelling and experiment both have a factor of two decrease in the Kα emission HWHM with respect to the diameter from the single pulse shot, the minimum HWHM also occur with = 4-6 ps. In both the experiment and model for 6 ps the HWHM increases back to the single pulse value. The minimum in the HWHM corresponds with a modelled peak magnetic field of 0.45 MG, for larger delays the magnetic field diffuses away from the propagation axis, reducing in magnitude. We note that in both the experiment and modelling, in comparison to the 0 ps case, the 2 ps delay has a slightly increased Kα HWHM. This is because in the 2ps case, is of the order of the pulse duration, meaning the fast electron beam is effectively one longer pulse with reduced current in comparison to the 0 ps case. In this resistivity/temperature regime, the lower current of the 2 ps case generates a smaller magnetic field meaning the electron beam is less well guided. Differences in the absolute size from model to experiment may be due to differences between the modelled and experimental spatial distributions of the injected electrons. Experimentally, 20% of the total laser energy is contained within the focal spot FWHM and 50% is contained within a 16 µm spot diameter Patel:2005aa . Only the energy within the focal spot is modelled which may explain the differences between the experimental and modelling results. Note that reproduction of the experimental results required a modelled electron spatial distribution with ‘wings’, this fits with the laser energy spatial distribution.
The main features of the observed fast electron transport are explained as follows: (1) the first laser pulse ‘injects’ a population of fast electrons into the target which seed an azimuthal magnetic field, the energy density of which is proportional to the radial derivative of the electron beam current density. On axis the induced magnetic field acts to collimate the injected fast electrons, while at larger radii the sign of the magnetic field reverses, causing the injected fast electrons to diverge. (2) During the time between the two laser pulses the induced magnetic field increases in magnitude until approximately the end of the first pulse and moves deeper into the target. Then it diffuses radially reducing in magnitude. (3) If the second electron population arrives too early or the current in the first pulse is too small, the generated magnetic field is insufficient and the beam less well guided. This explains why no collimation is observed for small , when the total energy on target is reduced and when the first pulse energy on target is reduced (=20:1). (4) At the optimal delay, the magnetic field is at a maximum and the majority of the injected fast electrons interact with the convergent region of the magnetic field. In this case the optimal collimation of the beam occurs. In the case where the energy on target was higher ( = 7 ps), the current is higher meaning the magnetic field is larger and the guiding more effective. (5) The optimal delay is exceeded when the radial field diffusion is such that the collimating magnetic field is too weak to collimate the injected fast electrons, hence little guiding occurs and the beam is relatively unaffected.
In summary, the first evidence has been provided that two laser pulses of total energy , energy ratio 10:1 and time delay of yield optimized electron beam guiding characteristics. In comparison to single pulse shots the optimized fast electron beam has the following parameters: Kα imager HWHM , peak Kα imager signal vs high (low) contrast single pulse (), peak thermally derived rear surface temperatures . Modelling accurately reproduces this data showing that a magnetic field generated within the target by the first pulse acts to collimate the second pulse. Under the optimal conditions the beam divergence is reduced by a factor of 2.7 with the fast electrons generated by the main laser pulse being guided over a distance of . This experimental evidence shows that the fast electron beam characteristics can be significantly enhanced over the previous state-of-the-art, improving many of the fast electron beam parameters critical for fast ignition inertial confinement fusion and many other applications of intense laser-solid interactions.
References
- (1) E. L. Clark et al., Phys. Rev. Lett. 84, 670 (2000).
- (2) D. Hoarty et al., High Energy Density Phys. 3, 115 (2007).
- (3) M. Tabak et al., Phys. Plasmas 1, 1626 (1994), part 2.
- (4) S. Atzeni and M. Tabak, Plasma Phys. & Controlled Fusion 47, B769 (2005).
- (5) R. B. Campbell et al., Phys. Plasmas 10, 4169 (2003).
- (6) A. P. L. Robinson and M. Sherlock, Phys. Plasmas 14, 083105 (2007).
- (7) A. P. L. Robinson, M. Sherlock, and P. A. Norreys, Phys. Rev. Lett. 100, 025002 (2008).
- (8) W. Theobald et al., Phys. Plasmas 13, 043102 (2006).
- (9) J. J. Santos et al., Phys. Plasmas 14, 103107 (2007).
- (10) W. Yu et al., Laser and Particle Beams 27, 109 (2009).
- (11) P. Norreys et al., Nuclear Fusion 49, 104023 (2009).
- (12) K. Markey et al., Phys. Rev. Lett. 105, 195008 (2010).
- (13) C. Danson et al., Nuclear Fusion 44, S239 (2004).
- (14) I. Musgrave et al., Appl. Opt. 49, 6558 (2010).
- (15) A. L. Meadowcroft, C. D. Bentley, and E. N. Stott, Review of Scientific Instruments 79, 113102 (2008).
- (16) H.-K. Chung et al., High Energy Density Physics 1, 3 (2005), ISSN 1574-1818.
- (17) R. Kodama, K. Okada, and Y. Kato, Review of Scientific Instruments 70, 625 (1999).
- (18) S. D. Baton et al., Phys. Rev. Lett. 91, 105001 (2003).
- (19) N. C. Woolsey et al., Phys. Rev. E 57, 4650 (1998).
- (20) I. O. Musgrave et al., Appl. Opt. 46, 6978 (2007).
- (21) J. Breil and P.-H. Maire, Journal of Computational Physics 224, 785 (2007), ISSN 0021-9991.
- (22) B. Chimier, V. T. Tikhonchuk, and L. Hallo, Phys. Rev. B 75, 195124 (2007).
- (23) Dubroca, B., Feugeas, J.-L., and Frank, M., Eur. Phys. J. D 60, 301 (2010).
- (24) Ph. Nicolaï et al., Phys. Rev. E 84, 016402 (2011).
- (25) A. Debayle et al., Phys. Rev. E 82, 036405 (2010).
- (26) P. K. Patel et al., Plasma Phys. & Controlled Fusion 47, B833 (2005).