Redshifted H i and OH absorption in radio galaxies and quasars
Abstract
From a survey for redshifted H i 21-cm and OH 18-cm absorption in the hosts of a sample of radio galaxies and quasars, we detect H i in three of the ten and OH in none of the fourteen sources for which useful data were obtained. As expected from our recent result, all of the 21-cm detections occur in sources with ultra-violet continuum luminosities of W Hz-1. At these “moderate” luminosities, we also obtain four non-detections, although, as confirmed by the equipartition of detections between the type-1 and type-2 objects, this near-50% detection rate cannot be attributed to unified schemes of active galactic nuclei (AGN). All of our detections are at redshifts of , which, in conjunction with our faint source selection, biases against UV luminous objects. The importance of ultra-violet luminosity (over AGN type) in the detection of 21-cm is further supported by the non-detections in the two high redshift () radio galaxies, which are both type-2 objects, while having W Hz-1. Our 21-cm detections in combination with those previously published, give a total of eight (associated and intervening) H i absorbing sources searched and undetected in OH. Using the detected 21-cm line strengths to normalise the limits, we find that only two of these eight may have been searched sufficiently deeply in OH, although even these are marginal.
keywords:
galaxies: active – quasars: absorption lines – radio lines: galaxies – ultra violet: galaxies – galaxies: fundamental parameters – galaxies: high redshift1 Introduction
Although opaque to optical light, the dusty Universe is transparent to radiation at radio wavelengths, thus making the spectroscopic study of the 21-cm spin-flip transition of neutral hydrogen (H i) a very useful tool in probing the far reaches of the cosmos. The low probability of the transition compounded by the inverse square law, renders H i 21-cm currently undetectable in emission at redshifts of . However, in the absorption of radio waves emitted from background quasars, the line strength depends only upon the column density of the absorber and the flux of the background source. Therefore by using absorption lines, we can in principal probe H i to redshifts of (or when the Universe was 1% its present age), where the ionosphere begins to affect low frequency radio waves ( MHz). With such observations we can address several outstanding questions in cosmology and fundamental physics:
-
1.
Probe the Epoch of Re-ionisation – when the first ever stars ignited, re-ionising the gas in the smaller cosmos (e.g. Carilli et al. 2004).
- 2.
-
3.
Measure any putative variations in the values of the fundamental constants of nature at large look-back times, to at least an order of magnitude the sensitivity provided by the best optical data (see Tzanavaris et al. 2007). This offers one of the few experimental tests of current Grand Unified Theories, thus having profound implications for modern physics.
This latter point requires the comparison of the redshift of the 21-cm line with other transitions, which may be optical/ultra-violet [from singly-ionised metals, giving ], where is the fine structure constant, the electron-to-proton mass ratio and the proton g-factor, millimetre-wave [rotational transition of molecules, giving ] or other decimetre transitions (see Curran et al. 2004a and references therein). Specifically, transitions arising from the hydroxyl radical (OH), which can also be intra-compared (Darling, 2003), thus avoiding possible line-of-sight effects which could mimic a change in the constants.
Thus, highly redshifted H i 21-cm and OH 18-cm absorbers are of great interest, although these are currently very rare, with only 73 H i 21-cm absorption systems at known – 41 of which occur in galaxies intervening the sight-lines to more distant quasars (see table 1 of Curran 2010), with the remainder arising in the host galaxies of the quasars themselves (see table 1 of Curran & Whiting 2010). In the case of OH, the situation is more dire with only five absorbers currently known (Chengalur et al., 1999; Kanekar & Chengalur, 2002; Kanekar et al., 2003, 2005). Four of these were originally found through millimetre-wave molecular absorption, although further surveys have proven fruitless (see Curran et al. 2004b), which we suggest is due to the traditional optical selection of the sources: The target of choice in many previous surveys have been damped Lyman- absorption systems (DLAs), since these are known to contain large columns of neutral hydrogen ( cm-2, by definition) at precisely determined redshifts. Although 19 DLAs have been detected in the Lyman and Werner UV bands (see Noterdaeme et al. 2008, Jorgenson et al. 2009 and Srianand et al. 2010), these are at molecular fractions well below the detection thresholds of current microwave instruments (Curran et al., 2004b). Furthermore, the molecular abundances appear to be correlated with the colour of the background quasar in that the DLAs have molecular fractions of and , whereas the millimetre (and OH) absorbers have molecular fractions and optical–near-infrared colours of (see figure 3 of Curran et al. 2010b). That is, not only are the radio-band absorbers redder than those of the optical-band, but there may be a correlation between the normalised OH line strength and optical–near infrared colour (Curran et al. 2006), although this requires a larger number of detections for confirmation.
These points strongly suggest that the quasar light is reddened by the dust in the foreground absorber, which prevents the dissociation of the molecules by the ambient UV field. From this it is apparent that in order to detect redshifted molecular absorption with current radio instruments, targets must be selected on the basis of their optical and near-IR photometry, where we select the reddest objects. However, the obscuration responsible for the quasar reddening could be located anywhere between us and the quasar redshift (the three intervening systems are the strongest absorbers, see Sect. 4.2) and, although wide-band decimetre scans are more efficient than at millimetre wavelengths (Murphy et al., 2003; Curran et al., 2005), these are very susceptible to radio frequency interference (RFI). Therefore, in addition to our programme of using the wide-band spectrometer on the Green Bank Telescope (GBT) to perform 200 MHz wide frequency scans of the entire redshift space towards very red, radio-loud objects (see Curran et al. 2007), we are searching for H i and OH absorption associated with the host galaxy of the quasar. Here we add the results of our recently completed searches for associated absorption and discuss these in the context of our previous search results (Curran et al., 2006, 2008).
2 Observations
2.1 Sample selection
We observed five sources with the Effelsberg telescope and eleven with the Green Bank Telescope (with two sources, 1107–187 & 1504–166, common to both, Table 3.1), where the H i 21-cm or OH 18-cm transition fell into an available receiver band. These targets were originally intended to form part of the sample of Curran et al. (2006) and, as such, our targets are largely from the Parkes Half-Jansky Flat-spectrum Sample (PHFS, Drinkwater et al. 1997). These are bright and generally compact radio sources for which there exists comprehensive optical photometry (Francis et al., 2000). From a list of sources, for which the redshifted H i and OH frequencies fell into the available bands, we targetted a specific sub-sample for each telescope:
-
1.
For the Effelsberg telescope, our targets were selected on the basis of their having a “type-2” spectrum, with narrow emission lines, a red continuum and only weak (if any) broad emission line components. For these, unified schemes of AGN imply that our line-of-sight to the nucleus is blocked by a “dusty torus” (which obscures the broad line region and only allows us to view the narrow emission lines directly), through which we may expect to detect absorption. We therefore selected three radio galaxies (0114+074, 0454+066 & 1555–140111One of the proposed targets, but not observed during this run. We have, however, since detected 21-cm absorption in this with the Australia Telescope Compact Array (Curran et al., 2006).) which exhibit optical spectra with narrow emission lines only, indicating the presence of some nuclear extinction. However, as since shown by Curran et al. (2008); Curran & Whiting (2010), AGN type has little bearing on whether absorption is detected (see Sect. 4.1).
-
2.
For the Green Bank Telescope, as per Curran et al. (2006), the targets were selected on the basis of their flat radio spectra and very red optical–near-infrared colours, properties similar to the (then four, now five) objects with redshifted rotational absorption. Both 0108+388 and 0500+019 have been taken from Carilli et al. (1998), and so are known to exhibit associated Hi absorption. The remainder were selected from the PHFS, on the basis of their optical–near-IR photometry (Francis et al., 2000), in which we selected the reddest objects in the sample, the colours of which are believed to be due to dust (Webster et al., 1995).
In this paper we present the results of 14 searches for associated H i absorption and 15 searches for OH. This is in addition to the 7 H i and 14 OH searched, using the Australia Telescope Compact Array and Giant Metre-Wave Radio Telescope (GMRT), by Curran et al. (2006) [with 3 H i and 5 OH searches overlapping with the present paper] and the 11 H i and 7 OH high redshift () sources searched by Curran et al. (2008) [with no overlaps].
2.2 Effelsberg observations
The Effelsberg observations were performed with the 100-metre
telescope from 9–12 May 2004. We used the UHF and 21/18-cm receivers
over various bandwidths (in order to cover as wide a redshift range is
possible, while minimising RFI) over 512 channels. System
temperatures were typically K (when RFI was
absent). Regarding each individual source:
4C +06.21 (0454+066) was observed at
a central frequency of 1185.35 MHz over a 6 MHz bandwidth, giving a
channel spacing of 3.1 . Although RFI was appreciable, an
r.m.s. noise level of 67 mK was achieved over the 3.7 hour
observation, although the flux density of the source could not be
determined.
[HB89] 0114+074 was observed at a central frequency of 1058.43
MHz over a 6 MHz bandwidth, giving a channel spacing of 3.5 . RFI
was severe, dominating the 3.5 hour observation.
PKS 1107–187 was observed at a central
frequency of 1112.51 MHz over a 12 MHz bandwidth, giving a spacing of
6.6 . Unfortunately, RFI dominated the one hour observation.
Not on the original Effelsberg target list, due to severe RFI close to 887.76 MHz
when observed at Green Bank, OH was searched for in [HB89] 1504–166 over a 12 MHz
bandwidth (giving a spacing of 8.2 ). Again, however, RFI was
severe, allowing nothing to be salvaged from the 5.4 hour
observation.
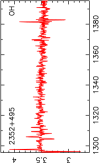
Due to the severe RFI we were encountering at
GHz, with the remaining time we selected a lower redshift
target, COINS J2355+4950 (2352+495) [in which 21-cm is detected by Vermeulen et al. 2003],
where OH would be redshifted to 1345.62 MHz. We observed over a 100 MHz
bandwidth, giving a channel spacing of 43.5 , and RFI was
relatively low, allowing us to observe the source for 3.8 hours. This gave
an r.m.s. noise level of 49 mK and a flux density equivalent to
3.504 K.222The Effelsberg telescope has a sensitivity of 1.55 K per Jy in the
UHF-band and 1.50 K per Jy in the 21/18-cm band.
The data were reduced using the gildas and xs packages.
2.3 Green Bank observations
Each of the sources targetted with the Green Bank Telescope were observed for a
total of three hours with the observations being completed over
several sessions in 2004, 2008 and 2009.333Originally intended
to be completed in 2004, thus being added to the sample
of Curran et al. (2006) [Sect. 2.1]. For all observations, the Prime
Focus 1 (PF1) receiver was used backed by the GBT spectrometer, with a 50
MHz band over 8 196 lags giving a channel spacing of 6.104 kHz
(and the velocity spacings listed in Table 3.1). Two
separate IFs were employed in order to observe both the H i and OH
lines simultaneously:
COINS J0111+3906 (0108+388) was observed at 851.38 (H i) and
998.85 (OH) MHz on 7 September 2004. Both bands were RFI free over
most of the band and system temperatures were K. Minimal
flagging was required, giving 2.1 hours of total integration at 851
MHz and 1.8 hours at 999 MHz.
4C -00.11 (0131–001) was observed at 765.01 MHz
(H i) and 868.87 MHz (in order to also cover the 1612 and 1720 MHz OH
satellite lines) in three sessions over 17 July to 31 August
2008. System temperatures were and K, respectively,
although RFI was bad in the lower band. After flagging, 0.9 and 1.1
hours of data remained in the H i and OH bands, respectively.
4C -02.09 (0213–026) was observed for a total of two hours at 652.16 MHz (H i) on
31 October 2009. The system temperature was K and RFI
caused around one half of the data to be completely flagged out. Of
the remaining data, only 4 MHz of the 12.5 MHz wide band used was
relatively RFI free, a range which fortunately covered the frequency
expected for the 21-cm transition (Fig. 1 &
Table 3.1). The OH line was searched at 765.65 MHz on 17
September 2009 for two hours over our standard 50 MHz band-width. The
system temperature was 37 K and a clean band required minimal flagging
leaving 1.7 hours of data.
PKS 0500+019 was observed at 1051.69 MHz only,
since H i absorption is already detected
(Carilli et al., 1998), on 2 October 2008. The system temperature was 24 K and RFI required some flagging, leaving
one hour of data, although there remain intermittent dips across the
band.
PKS 1107–187 was observed at 949.89 and 1113.16 MHz on 31 January
2009. System temperatures were 28 and 22 K, respectively, with only
scans with wobbly band-passes and intermittent RFI spikes requiring
removal in the lower band, leaving 1.7 hours of good data. We found
an absorption feature close to 954 MHz, although this is twice as
strong in one polarisation (see Sect. 3.2.2) and thus
requires confirmation. The higher band was completely clean until the last the last
half of the observation, when RFI spikes started moving across the
band, leaving 1.0 hours of good data.
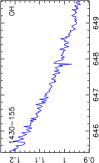
PKS 1430–155 was observed at
552.04 and 647.26 MHz on 15 February 2009. System temperatures were 86
and 43 K, respectively, where RFI was severe in both bands, although 8
minutes of good data could be retrieved at the higher frequency.
[HB89] 1504–166 was observed at 757.15 and 888.78 MHz on 30 April 2009. The
system temperatures in the H i band was 40 K, with 0.7 hours of good
data being retained. The OH band was completely wiped out by RFI.
PKS 1535+004 was observed at 315.84 and 370.46 on 25 October 2004. System
temperatures were 87 and 76 K, respectively, and severe RFI meant that
both bands had to be flagged extensively, leaving 1.2 hours of
still relatively poor data.
4C -01.39 (1654–020) was observed at 475.01 and 557.23
MHz on 6 and 10 October 2008. The lower band had a system temperature
of 40 K, although it was dominated by RFI. For the upper band, the
system temperature was 115 K, but less severe RFI meant that 1.3 hours
of data could be retained.
PKS 1706+006 was first observed on 7th
September 2004 with frequencies centred on 980.27 and 1150.03 MHz
where system temperatures were 30 and 24 K, respectively, with
extensive flagging leaving 1 hour of data. Nevertheless, RFI dominated
the higher frequency and so this was re-observed on 30 May
2009. Minimal flagging was required for these observations, although
each scan exhibited a negative flux in each polarisation.
PKS 2252–089
was searched in H i on 16 July 2009 with a band centred on 844.22
MHz with a spacing of 3.052 kHz. The system temperature was 26 K, with
very little flagging of bad data required. Since the OH band (centred
on 1036.73 MHz) required the PF2 receiver, this was observed
separately for one hour on both 5 June and 29 September 2009,
at a spacing of 6.104 kHz, the system temperature being 25 K for both
observations. On each occasion, although no time dependent flagging
was required, the effect of RFI meant only the band shown in
Fig. 1 was clean.
The data were reduced using the gbtidl software.
2.4 Other data
In addition to the Effelsberg and GBT observations, we include the unpublished results of searches of other similar sources from Giant Metre-Wave Radio Telescope archival data:
-
•
“Cold gas at high redshift” (PI: Braun, 02RBa01, 03RBa01), which yielded good data for H i and OH in 4C+41.17 and TXS 1243+036:
4C+41.17 (B3 0647+415) – for the H i observations, there were 20 hours of good data from a total of 4 observations (between August 2002 and February 2003) over 330 to 427 good baseline pairs. The OH band was searched on several occasions, but only the observation of 3 February 2003 gave reasonable data, of which 6.4 hours over 401 baselines were good.
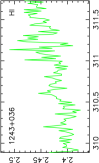
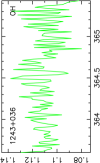
TXS 1243+036 (4C+03.24) – the H i band was observed over several runs, but only that from 30 August 2003 proves useful, with 2.3 hours of good data over 392 baseline pairs being retained. The several OH band observations also yielded only one good run (1 September 2002), of which 5.8 hours over 405 baselines pairs were retained. -
•
“H i absorption and emission in radio galaxies at ” (PI: Blake, 05CBa01): Only one of the five sources searched yielded good data and a detectable flux, 4C+37.25 (B2 0847+37). This was observed on 17 April 2004, with 4.82 hours over 434 baseline pairs.
All of the GMRT data were reduced using the miriad interferometry reduction package, with a spectrum extracted from each cube.
3 Results
3.1 Observational results
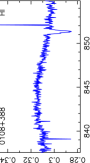
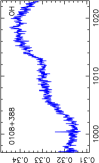
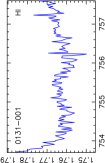
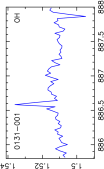
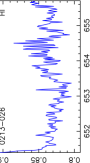
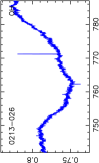
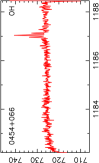
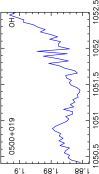
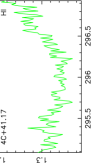
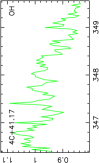
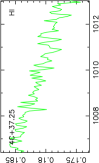
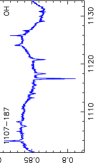
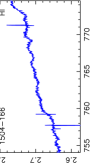
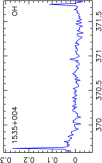
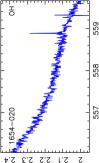
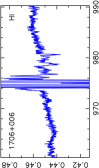
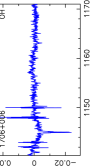
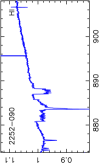
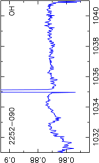
In Fig. 1 we show the final spectra and summarise these in Table 3.1, where the optical depth limits are quoted per 10 channel, apart from the low resolution observation of 2352+495, which is quoted per observed channel. We have detected H i in two (possibly three) of the targets (one of which is a re-detection) and do not detect OH in any.
3.2 H i detections
3.2.1 0108+388
In Fig. 2 we show the spectrum of the H i 21-cm absorption profile in 0108+388, which was previously detected by Carilli et al. (1998). The fitting of a single Gaussian to the profile gives a peak depth of mJy ( mJy by Carilli et al. 1998) and a FWHM of (cf. ) at an observed frequency of MHz (giving a redshift for the peak of the line). The previous observations were performed with the WSRT, giving a flux density of 180 mJy (cf. our 302 mJy). We use this previously imaged, more resolved, emission to derive an optical depth of , which, integrated over the FWHM of the profile, gives a column density of , where is the spin temperature of the 21-cm transition and is the covering factor. This column density is only 30% of the value obtained by Carilli et al. (1998) [ ], which we believe is due to their lower quality spectrum.444 is the value derived using a Gaussian fit, whereas summing the actual channels over which the absorption occurs gives . Applying this summing to our profile gives , i.e. the same as the Gaussian fit.
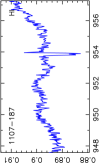
3.2.2 1107–187
We also report a possible 21-cm detection in 1107–187. This is apparent in both polarisations, although with quite different depths – mJy (at MHz with FWHM ) in the XX polarisation and mJy (at MHz with FWHM ) in the YY polarisation. The average of the two polarisations, with a single Gaussian fit, gives a line depth of mJy with a profile width of (Fig. 3), the resulting optical depth of , giving . The fit is centred on MHz, giving a redshift of , cf. 0.497 quoted in the PHFS (Drinkwater et al., 1997). This suggests that the absorption may be blue-shifted by with respect to the galaxy, although the host redshift is known to only three significant figures.
Note that of the many features apparent in the OH spectrum (Fig. 1), none give a (1665 MHz) — (1667 MHz) pair with the same redshift as the 21-cm line.
3.2.3 2252–090
Finally, we report a new detection of 21-cm absorption in 2252–090, which was so strong as to be apparent in each 5 minute scan. This appears to be comprised of two major components (Fig. 4), one which is narrow and deep (, FWHM , with MHz giving ), as well as a shallow, wide blue-shifted tail (, FWHM , with MHz giving ).
4 Discussion
4.1 H i results
In Table 2 we summarise the line strengths/limits from these new searches for redshifted H i 21-cm and OH 18-cm absorption.
| Source | Line | [] | -range | Class | Type | Ref | ||
|---|---|---|---|---|---|---|---|---|
| 0108+388 | 0.66847 | H i | 0.66847 | Gal | 2 | L96 | 20.309 | |
| … | … | OH | 0.62987–0.67268 | … | … | … | … | |
| 0131–001 | 0.879 | H i | 0.87488–0.88458 | QSO | – | – | 20.221 | |
| … | … | OH | 0.87766–0.88232 | … | … | … | … | |
| 0213–026 | 1.178 | H i | 1.16624–1.18054 | QSO | 2 | D97a | 22.119 | |
| … | … | OH | 1.11960–1.24545 | … | … | … | … | |
| 0454+066 | 0.405 | OH | 0.40138–0.40873 | QSO | 2 | D97a | 21.567 | |
| 0500+019 | 0.58477 | OH | 0.58419–0.58736 | Gal | 2 | H03 | 20.367 | |
| 0647+415 | 3.79786 | H i | 3.78364–3.81379 | Gal | 2 | D97b | 23.258 | |
| … | … | OH | 3.76988–3.81423 | … | … | … | … | |
| 0847+37 | 0.406818 | H i | 0.40183–0.41221 | Gal | 2 | SDR7 | 20.930 | |
| 1107–187 | 0.497 | H i | 0.48909 | Gal | 1 | D97a | 19.157 | |
| … | … | OH | 0.47137–0.51372 | … | … | … | .. | |
| 1243+036 | 3.5699 | H i | 3.55653–3.58388 | Gal | 2 | R97 | 23.382 | |
| … | … | OH | 3.56273–3.58607 | … | … | … | … | |
| 1430–155 | 1.573 | OH | 1.56667–1.58345 | QSO | 1 | D97a | 21.790 | |
| 1504–166 | 0.876 | H i | 0.83385–0.88365 | QSO | 1 | H78 | 22.361 | |
| 1535+004 | 3.497 | OH | 3.48456–3.51125 | QSO | — | – | — | |
| 1654–020 | 1.99 | OH | 1.97924–1.99858 | Gal | 1 | D97a | 22.151 | |
| 1706+006 | 0.449 | H i | 0.43436–0.47902† | Gal | 2 | D97a | 19.838 | |
| … | … | OH | 0.42388–0.46221 | … | … | … | … | |
| 2252–090 | 0.6064 | H i | Gal | 2 | D97a | 20.802 | ||
| … | … | OH | 0.60246–0.6162 | … | … | … | … | |
| 2352+495 | 0.23783 | OH | 0.20788–0.26921 | Gal | 2 | L96 | 19.030 |
Notes: ∗ at over the absorption free region if a false detection, †with RFI at .
For the 21-cm searches, we have obtained one, possibly two new detections, as well as confirming and improving upon a previous detection. From the top panel of Fig. 5, we see that all of the sources have been searched as deeply as in previous surveys and from the bottom panel, we see a range of 1216 Å luminosities (given in Table 2): Curran et al. (2008) found a critical luminosity ( W Hz-1) at this wavelength, above which 21-cm has never been detected. All but two of the sample lie below this threshold, these being 0647+415 and 1243+036 (Sect. 2.4), which, as our previous searches (Curran et al., 2008), are above the critical luminosity due to their high redshifts causing the selection of the brightest sources, despite their relatively faint magnitudes (Table 3.1, cf. figure 5 of Curran et al. 2010b).
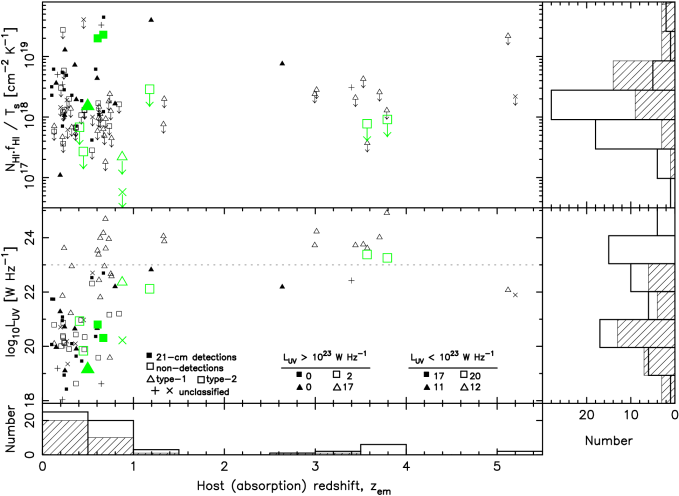
These two new high redshift sources differ from the all of the other W Hz-1 targets searched in 21-cm in that they are type-2 objects. Their inclusion increases the significance of the ultra-violet luminosity effect, with the binomial probability of 0 out of 19 detections occuring by chance being just , if a 21-cm detection and non-detection are equally probable. Assuming Gaussian statistics, this corresponds to a significance of .
As mentioned in Sect. 2.1, the distribution of 21-cm detections in radio galaxies and quasars is usually attributed to unified schemes of active galactic nuclei (Antonucci, 1993; Urry & Padovani, 1995), where, due to the edge-on torus of dense circumnuclear material, type-2 objects (usually galaxies) present a thick column of intervening gas along our sight-line and thus absorb in 21-cm (Jaffe & McNamara 1994; Conway & Blanco 1995), whereas type-1 objects (usually quasars) do not. Of the new detections, one is type-2 and one is type-1 (assuming that 1107–187 is a detection, Sect. 3.2.2), and contributing to a type-2 detection rate of 46% and a type-1 rate of 48%, these confirm our previous finding that unified schemes of AGN cannot be used to explain the incidence of 21-cm absorption in these objects (cf. Morganti et al. 2001; Pihlström et al. 2003; Gupta et al. 2006; Gupta & Saikia 2006). That is, these results further support our suggestion the bulk of the cool gas is located in the main galactic disk, which is randomly oriented with respect to the torus of obscuring material invoked by unified schemes of AGN (Curran & Whiting, 2010).
4.2 OH results
Although OH was not detected in any of the sample, from the H i detections5550108+388, 0500+019, 1107–187, 2352+495 (this paper), 0902+343 (Cody & Braun, 2003), J1124+1919, J1347+1217 and J2316+0404 (Gupta et al., 2006). we can obtain normalised OH line strength limits in order to compare with the five detected OH absorbers.
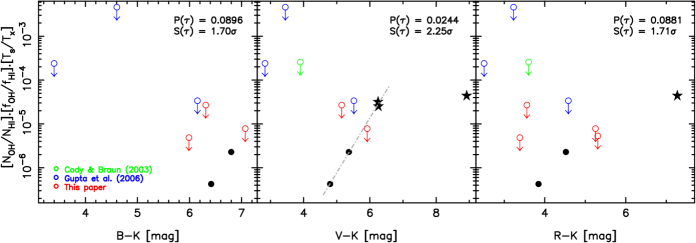
In Fig. 6 we add the new results to the molecular line strength/optical–near-IR colour correlation found by Curran et al. (2006), showing also the corresponding distributions using the blue and red magnitudes. Since the full-width half maxima (FWHM) of the OH lines are expected to be close to those of the 21-cm profiles (Curran et al., 2007), as per Curran et al. (2008), we have rescaled the OH column densities limits by , in order to give the limit of a single channel “smoothed” to . This should give a more accurate estimate of the upper limit than quoting this per channel.666 is the original resolution of the observations or the 10 used in Table 3.1 and is obtained from Mirabel (1989); Carilli et al. (1998); Cody & Braun (2003); Vermeulen et al. (2003); Gupta et al. (2006), as well as this paper (Sect. 3.2).
From this, we see that, even if the reddening of the quasar light does occur within its host galaxy and not at some intervening redshift, according the to the five known OH absorbers, only 0500+019 and (from the plot) 0108+388 may have been searched sufficiently deeply. Although the limit is close to the expected detection threshold, 0500+019 is also undetected in HCO+, to limits which are significantly stronger according to the — correlation (Curran et al., 2010a), and so perhaps the reddening of this source does not occur in the host galaxy but is the cause of some intervening absorber.777% of the redshift space towards 0500+019 has been scanned for HCO+ (Murphy et al. 2003), although the detection of OH does not ensure the detection of a millimetre transition (Kanekar et al., 2005).
Note finally, that the addition of these limits through the asurv survival analysis package (Isobe et al., 1986), increases the significance of the correlation over that for the OH detections only (, Curran et al. 2006). For the and correlations the significance is somewhat lower, although, due to the limited availability of these magnitudes for the known absorbers, this is not surprising being based upon only two or three detections.
5 Summary
We have undertaken a survey for redshifted H i 21-cm and OH 18-cm absorption in a sample of type-2 AGN and reddened flat spectrum objects with the Effelsberg and Green Bank telescopes. We also include unpublished searches of similar objects with the Giant Metre-Wave Radio Telescope. Of the ten objects for which there are useful data, we report one new clear 21-cm detection, in addition to a possible detection, and confirm and significantly improve upon a previous detection (all with the GBT). The selection criteria for the targets pre-date the findings of Curran et al. (2008), although they confirm these:
-
1.
All of the 21-cm detections occur in objects with Å luminosities of W Hz-1, a range within which there are also four new non-detections. All of the detections arise in galaxies (as opposed to quasars), which have been noted to have higher 21-cm detection rates (52% for galaxies compared to 17% for quasars), this being attributed to galaxies tending to be type-2 objects. However, Curran & Whiting (2010) have shown that the higher detection rate in galaxies is likely to be a consequence of their generally lower UV luminosities, as opposed to their AGN classification.
-
2.
The two objects for which W Hz-1 are undetected, confirming that the ultra-violet luminosity is an important criterion in the detection of cool neutral gas (Curran & Whiting, 2010). Their inclusion, the first published type-2 W Hz-1 sources searched for in 21-cm, raises the significance of the UV luminosity—21-cm anti-correlation to .
-
3.
At W Hz-1, the detection rates for both type-1 and type-2 objects remain close to 50%, supporting the hypothesis that unified schemes of active galactic nuclei cannot account for the observed incidence of 21-cm absorption in radio galaxies and quasars.
Fourteen of the sources searched in OH had useful data, although only two of these have 21-cm detections, thus being able to yield limits on the normalised line strengths. Adding those from the literature, gives a total of eight objects for which we can normalise the line strengths and thus compare with the five known OH absorbers. On this basis, however, we find that only two (0108+388 & 0500+019, both from this paper) come close to having been searched deeply enough. This confirms the findings of Curran et al. (2006) that many of the known objects are simply not “red enough” to indicate sufficiently large columns of dust, conducive to the presence of molecular gas, along their sight-lines.
Acknowledgements
We would like to thank Christian Henkel for the information on the Effelsberg telescope, Chris Blake for his GMRT data (05CBa01) and Kamble Jayprakash & Yogesh Wadadekar for their assistance in accessing the archival GMRT data (02RBa01 & 03RBa01). Also, many thanks to Cormac “Mopra Boy” Purcell for his fabulous sdfits2fits script, which allowed easy manipulation of the reduced GBT data, and Anant Tanna for the digitised spectrum of 0108+388 from Carilli et al. (1998). MTM thanks the STFC for an Advanced Fellowship and the Australian Research Council for a QEII Research Fellowship (DP0877998).
This research has made use of the NASA/IPAC Extragalactic Database (NED) which is operated by the Jet Propulsion Laboratory, California Institute of Technology, under contract with the National Aeronautics and Space Administration. This research has also made use of NASA’s Astrophysics Data System Bibliographic Services and asurv Rev 1.2 (Lavalley et al., 1992), which implements the methods presented in Isobe et al. (1986).
The Two Micron All Sky Survey, is a joint project of the University of Massachusetts and the Infrared Processing and Analysis Center/California Institute of Technology, funded by the National Aeronautics and Space Administration and the National Science Foundation.
References
- Adelman-McCarthy et al. (2008) Adelman-McCarthy, J. K., Agüeros, M. A., Allam, S. S., Anderson, K. S. J., Anderson, S. F., Annis, J., Bahcall, N. A., & Baldry. 2008, ApJS, 175, 297
- Antonucci (1993) Antonucci, R. R. J. 1993, ARA&A, 31, 473
- Carilli et al. (2004) Carilli, C. L., Gnedin, N., Furlanetto, S., & Owen, F. 2004, Science with the Square Kilometer Array, New Astronomy Reviews 48, ed. C. L. Carilli & S. Rawlings (Amsterdam: Elsevier), 1053–1061
- Carilli et al. (1998) Carilli, C. L., Menten, K. M., Reid, M. J., Rupen, M. P., & Yun, M. S. 1998, ApJ, 494, 175
- Chambers et al. (1990) Chambers, K. C., Miley, G. K., & van Breugel, W. J. M. 1990, ApJ, 363, 21
- Chengalur et al. (1999) Chengalur, J. N., de Bruyn, A. G., & Narasimha, D. 1999, A&A, 343, L79
- Cody & Braun (2003) Cody, A. M. & Braun, R. 2003, A&A, 400, 871
- Condon et al. (1998) Condon, J. J., Cotton, W. D., Greisen, E. W., Yin, Q. F., Perley, R. A., Taylor, G. B., & Broderick, J. J. 1998, AJ, 115, 1693
- Conway & Blanco (1995) Conway, J. E. & Blanco, P. R. 1995, ApJ, 449, L131
- Curran (2010) Curran, S. J. 2010, MNRAS, 402, 2657
- Curran et al. (2007) Curran, S. J., Darling, J. K., Bolatto, A. D., Whiting, M. T., Bignell, C., & Webb, J. K. 2007, MNRAS, 382, L11
- Curran et al. (2004a) Curran, S. J., Kanekar, N., & Darling, J. K. 2004a, Science with the Square Kilometer Array, New Astronomy Reviews 48, ed. C. L. Carilli & S. Rawlings (Amsterdam: Elsevier), 1095–1105
- Curran et al. (2004b) Curran, S. J., Murphy, M. T., Pihlström, Y. M., Webb, J. K., Bolatto, A. D., & Bower, G. C. 2004b, MNRAS, 352, 563
- Curran et al. (2005) Curran, S. J., Webb, J. K., Murphy, M. T., & Kuno, N. 2005, in Highlights of Astronomy, Vol. 13, as presented at the XXVth General Assembly of the IAU - 2003, ed. O. Engvold. (San Francisco: ASP Conf. Ser.), 845 – 847, in press (astro-ph/0310589)
- Curran et al. (2006) Curran, S. J., Whiting, M., Murphy, M. T., Webb, J. K., Longmore, S. N., Pihlström, Y. M., Athreya, R., & Blake, C. 2006, MNRAS, 371, 431
- Curran & Whiting (2010) Curran, S. J. & Whiting, M. T. 2010, ApJ, 712, 303
- Curran et al. (2010a) Curran, S. J., Whiting, M. T., Combes, F., Kuno, N., Francis, P., Nakai, N., Webb, J. K., Murphy, M. T., & Wiklind, T. 2010a, MNRAS, in preparation
- Curran et al. (2010b) Curran, S. J., Whiting, M. T., & Webb, J. K. 2010b, Proceedings of Science, accepted (arXiv:0910.3743)
- Curran et al. (2008) Curran, S. J., Whiting, M. T., Wiklind, T., Webb, J. K., Murphy, M. T., & Purcell, C. R. 2008, MNRAS, 391, 765
- Darling (2003) Darling, J. 2003, PhRvL, 91, 011301
- Dey et al. (1997) Dey, A., van Breugel, W., Vacca, W. D., & Antonucci, R. 1997, ApJ, 490, 698
- Douglas et al. (1996) Douglas, J. N., Bash, F. N., Bozyan, F. A., Torrence, G. W., & Wolfe, C. 1996, AJ, 111, 1945
- Drinkwater et al. (1997) Drinkwater, M. J., Webster, R. L., Francis, P. J., Condon, J. J., Ellison, S. L., Jauncey, D. L., Lovell, J., Peterson, B. A., & Savage, A. 1997, MNRAS, 284, 85
- Francis et al. (2000) Francis, P. J., Whiting, M. T., & Webster, R. L. 2000, PASA, 17, 56
- Gupta & Saikia (2006) Gupta, N. & Saikia, D. J. 2006, MNRAS, 370, 738
- Gupta et al. (2006) Gupta, N., Salter, C. J., Saikia, D. J., Ghosh, T., & Jeyakumar, S. 2006, MNRAS, 373, 972
- Hambly et al. (2001) Hambly, N., MacGillivray, H., Read, M., Tritton, S., Thomson, E., Kelly, B., Morgan, D., Smith, R., Driver, S., Williamson, J., Parker, Q., Hawkins, M., Williams, P., & Lawrence, A. 2001, MNRAS, 326, 1279
- Hook et al. (2003) Hook, I. M., Shaver, P. A., Jackson, C. A., Wall, J. V., & Kellermann, K. I. 2003, A&A, 399, 469
- Hunstead et al. (1978) Hunstead, R. W., Murdoch, H. S., & Shobbrook, R. R. 1978, MNRAS, 185, 149
- Isobe et al. (1986) Isobe, T., Feigelson, E., & Nelson, P. 1986, ApJ, 306, 490
- Jaffe & McNamara (1994) Jaffe, W. & McNamara, B. R. 1994, ApJ, 434, 110
- Jorgenson et al. (2009) Jorgenson, R. A., Wolfe, A. M., Prochaska, J. X., & Carswell, R. F. 2009, ApJ, 704, 247
- Kanekar et al. (2005) Kanekar, N., Carilli, C. L., Langston, G. I., Rocha, G., Combes, F., Subrahmanyan, R., Stocke, J. T., Menten, K. M., Briggs, F. H., & Wiklind, T. 2005, PhRvL, 95, 261301
- Kanekar & Chengalur (2002) Kanekar, N. & Chengalur, J. N. 2002, A&A, 381, L73
- Kanekar et al. (2003) Kanekar, N., Chengalur, J. N., de Bruyn, A. G., & Narasimha, D. 2003, MNRAS, 345, L7
- Kanekar et al. (2009) Kanekar, N., Prochaska, J. X., Ellison, S. L., & Chengalur, J. N. 2009, MNRAS, 396, 385
- Lavalley et al. (1992) Lavalley, M. P., Isobe, T., & Feigelson, E. D. 1992, in BAAS, Vol. 24, 839–840
- Lawrence et al. (1996) Lawrence, C. R., Zucker, J. R., Readhead, A. C. S., Unwin, S. C., Pearson, T. J., & Xu, W. 1996, ApJS, 107, 541
- Mirabel (1989) Mirabel, I. F. 1989, ApJ, 340, L13
- Morganti et al. (2001) Morganti, R., Oosterloo, T. A., Tadhunter, C. N., van Moorsel, G., Killeen, N., & Wills, K. A. 2001, MNRAS, 323, 331
- Murphy et al. (2003) Murphy, M. T., Curran, S. J., & Webb, J. K. 2003, MNRAS, 342, 830
- Noterdaeme et al. (2008) Noterdaeme, P., Ledoux, C., Petitjean, P., & Srianand, R. 2008, A&A, 481, 327
- O’Dea et al. (1990) O’Dea, C. P., Baum, S. A., & Morris, G. B. 1990, A&AS, 82, 261
- Pihlström et al. (2003) Pihlström, Y. M., Conway, J. E., & Vermeulen, R. C. 2003, A&A, 404, 871
- Roettgering et al. (1997) Roettgering, H. J. A., van Ojik, R., Miley, G. K., Chambers, K. C., van Breugel, W. J. M., & de Koff, S. 1997, A&A, 326, 505
- Skrutskie et al. (2006) Skrutskie, M. F., Cutri, R. M., Stiening, R., Weinberg, M. D., Schneider, S., Carpenter, J. M., Beichman, C., & Capps, R. . M. 2006, AJ, 131, 1163
- Srianand et al. (2010) Srianand, R., Gupta, N., Petitjean, P., Noterdaeme, P., & Ledoux, C. 2010, MNRAS, 1888
- Stanghellini et al. (1993) Stanghellini, C., O’Dea, C. P., Baum, S. A., & Laurikainen, E. 1993, ApJS, 88, 1
- Stickel & Kühr (1994) Stickel, M. & Kühr, H. 1994, A&AS, 105, 67
- Stickel et al. (1996) Stickel, M., Rieke, G. H., Kühr, H., & Rieke, M. J. 1996, ApJ, 468, 556
- Tadhunter et al. (1993) Tadhunter, C. N., Morganti, R., di Serego-Alighieri, S., Fosbury, R. A. E., & Danziger, I. J. 1993, MNRAS, 263, 999
- Tzanavaris et al. (2007) Tzanavaris, P., Murphy, M. T., Webb, J. K., Flambaum, V. V., & Curran, S. J. 2007, MNRAS, 374, 634
- Urry & Padovani (1995) Urry, C. M. & Padovani, P. 1995, PASP, 107, 803
- Vermeulen et al. (2003) Vermeulen, R. C., Pihlström, Y. M., Tschager, W., de Vries, W. H., Conway, J. E., Barthel, P. D., Baum, S. A., Braun, R., Bremer, M. N., Miley, G. K., O’Dea, C. P., Roettgering, H. J. A., Schilizzi, R. T., Snellen, I. A. G., & Taylor, G. B. 2003, A&A, 404, 861
- Webster et al. (1995) Webster, R. L., Francis, P. J., Peterson, B. A., Drinkwater, M. J., & Masci, F. J. 1995, Nat, 375, 469