11email: stefano.andreon@brera.inaf.it 22institutetext: GEPI, Paris-Meudon Observatory 5, Place Jules Janssen, 92190, Meudon, France
22email: marc.huertas@obspm.fr 33institutetext: Université Paris Diderot, 75205 Paris Cedex 13, France
Red sequence determination of the redshift of the cluster of galaxies JKCS 041:
This paper aims at robustly determining the redshift of the cluster of galaxies JKCS 041 and at putting constraints on the formation epoch of the color-magnitude sequence in two very high redshift clusters. New deep data show a clear narrow red sequence that is co-centered with, and similary concentrated on, the extended X–ray emission of the cluster of galaxies JKCS 041. The JKCS 041 red sequence is mag redder in than the red sequence of the IRC0218A cluster, putting JKCS 041 at and ruling out the latter claimed by a recent paper. The color difference of the two red sequences gives a red-sequence-based redshift of for JKCS 041, where the uncertainty accounts for uncertainties in stellar synthesis population models, in photometric calibration, and in the red sequence color of both JKCS 041 and IRC0218A clusters. We do not observe any sign of truncation of the red sequence for both clusters down to mag ( solar masses), which suggests that it is already in place in clusters rich and massive enough to heat and retain hot gas at these high redshifts.
Key Words.:
Galaxies: evolution — galaxies: clusters: general — galaxies: clusters: individual JKCS 041 — galaxies: clusters: individual IRC0218A1 Introduction
Many efforts have been made in past years to constrain the epoch of formation of massive elliptical galaxies. Recent observational results suggest that massive red-sequence galaxies were already assembled in cluster cores at (e.g. De Propris et al. 1999; Andreon 2006a; Lidman 2008) and possibly up to (Andreon 2010). Their colors and morphologies, as revealed from observational studies in mass selected samples, remain unchanged from (e.g. Holden et al. 2007; Huertas-Company et al. 2009), which again suggests that these galaxies were assembled at even higher redshifts.
These observations may contradict the predictions of the CDM model, in which mergers of gas-rich galaxies are the main driver of spheroid formation (e.g. Toomre & Toomre 1972) and the main explanation for the over density of red galaxies in cluster cores (e.g. Dressler 1984). Finding the cluster of galaxies at the highest redshifts allows the epoch of formation of elliptical galaxies to be pushed back, making it a very intense activity in past years (e.g. Papovich et al. 2010).
Recently, Andreon et al. (2009) detected what seems to be the most distant cluster of galaxies to date (JKCS 041 at ) by looking at over densities in red galaxies. JKCS 041 lies in the SWIRE/CFHTLS field at RA=2h, Dec=-4 and benefits from an extensive multi-wavelength follow-up, spanning 1.4 Ghz to X rays and including SWIRE/Spitzer imaging in 7 IR bands (3.6, 4.5, 5.8, 8.0, 24, 70, 160 microns), as well as optical CFHTLS ugriz, WIRDS JHK, and UKIDSS JK data. The cluster has not been spectroscopically confirmed yet. However, in the Chandra follow-up, it is detected as an extended X-ray source with keV, which confirms there is a hot intracluster medium, present in formed clusters and lacking in protoclusters.
In this paper we first report the presence of a clear red sequence of passive galaxies in the region of JKCS 041 using a filter pair sampling the Balmer break at : the color. Second, by comparing the red sequence color of the JKCS 041 and IRC0218A, a spectroscopically confirmed cluster at (Papovich et al. 2010: Tanaka et al. 2010), we confirm that JKCS 041 lies at a much higher redshift, and we quantify its photometric redshift ().
Throughout the paper, we assume the following cosmological parameters: km s-1 Mpc-1, , and . Magnitudes are in the AB system.
2 Data and minor photometric corrections
JKCS 041 is in the area covered by CFHTLS deep survey and by WIRDS follow-up in the infrared filters () (Bielby et al., in preparation, catalogs are available on the Terapix site). More precisely, we used the catalog generated using -band as detection image and the other bands ( and ) in analysis mode. We measured an at ( apertures used to measure colors) and mag. The seeing in both filters is very similar, i.e. FWHM in the band (CFHTLS deep) and in the J band (WIRDS), so no correction for seeing differences was applied.
IRC0218A is in the area covered by Williams et al. (2009), whose catalogs are based on the UKIDSS survey (Lawrence et al. 2007) for the infrared bands ( and ), and from the SXDS survey (Furusawa 2008) for the band. Colors listed in the catalog are measured in matched apertures and corrected for seeing differences. We measured an at (in the apertures used to measure colors) and mag.
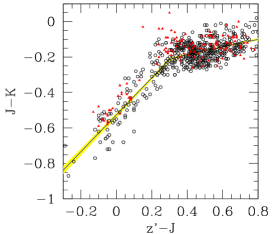
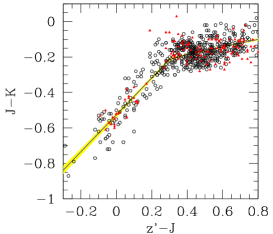
The photometry of the two catalogs comes from different telescopes and reduction pipelines. An independent check that they are truly on a consistent photometric system is therefore necessary. The IRC0218A cluster lies 2.1 degrees away from JKCS 041, and both clusters are at high galactic latitude ( deg). Stars in the two catalogs should, therefore, fall on the same vs locus. The top panel of Fig. 1 shows the stellar color-color locus in the two directions: the two sequences almost coincide, with a hard-to-notice small offset. The offset (and its error) is computed by a joint fit of the two stellar sequences with a broken line, assuming uniform priors for the two line position angles, for the and of the break point, for the vertical thickness of the locus, and for the two color offsets. The vertical thickness has a prior zeroed to negative (meaningless) values. To account for outliers (most of which are not visible in Fig 1 because outside the plotted color range, mainly QSO, variable stars and a few objects with corrupted photometry), we model the vertical color spread with a Cauchy distribution. The larger wings of the Cauchy distribution de-weight outliers. We found that stars in the direction of JKCS 041 are mag bluer in , and redder in , than in the direction of IRC0218A. We therefore corrected colors listed in the WIRDS/CFHT catalog by the computed photometric correction to make equal the stellar locii. The bottom panel of Fig. 2 shows the stellar locii after the very small photometric correction.
3 Results
3.1 IRC0218A and JKCS 041 red sequences
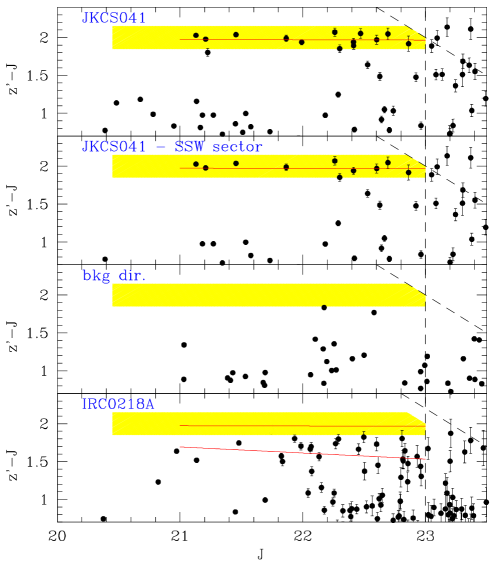
The top panel of Figure 2 shows the color-magnitude relations toward JKCS 041 within a radius of arcmin ( Mpc at ), after applying the minor photometric correction described above. The SSW octant (i.e. the sector going from S to W for 45 deg) is contaminated by galaxies of a nearby structure arcmin SSW discussed in sec 3.3. This octant is flagged in the top-middle panel. The middle-bottom panel shows a random control region of 1 arcmin radius for comparison. It turns out to be at roughly 0.4 deg north of JKCS 041. JKCS 041 presents a clear red sequence of well aligned objects, within a narrow color band, all within 1 arcmin from the X-ray cluster center.
Inspection of the middle-bottom panel shows no galaxy in the control field direction as red as in the JKCS 041 direction. There is none in the shaded region, making the detection of JKCS 041 very significant, a point already shown (and quantified) in Andreon et al. (2009) using a control region with a much larger solid angle, and it is readily visible here thanks to the deeper WIRDS data.
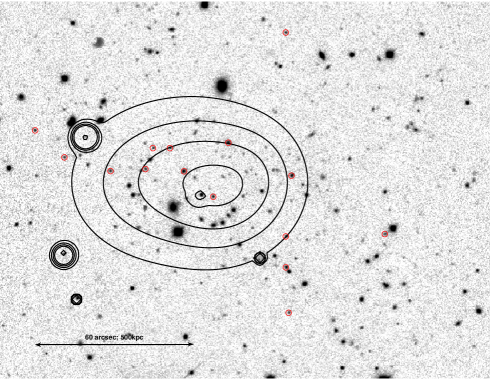
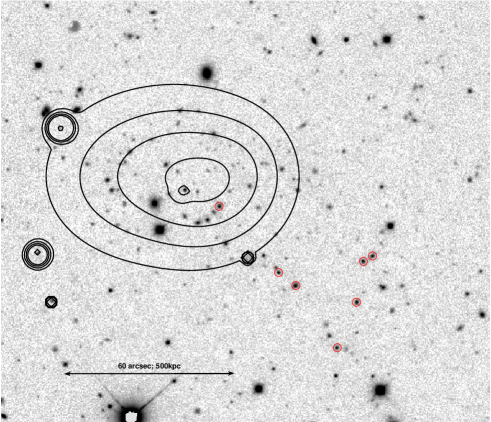
Fig. 3 shows the spatial distribution of galaxies within the shaded color range, , with no spatial filtering applied: these galaxies are not uniformly distributed but concentrated in the region of the X-ray emission.
The bottom panel of Fig. 2 shows the color-magnitude relations toward IRC0218A within a radius of arcmin ( Mpc at ). The IRC0218A reddest galaxies are all bluer than the bluest galaxies on the JKCS 041 red sequence, and in fact none fall in the shaded area where JKCS 041 red sequence galaxies are found. The redder color of the JKCS 041 red sequence directly implies that . Even without any photometric correction, the JKCS 041 red sequence is 0.29 mag redder than the IRC0218A red sequence, showing the much higher redshift of JKCS 041 compared to .
3.2 JKCS 041 photometric redshift
We fit the red sequence of JKCS 041 and IRC0218A through the Bayesian methods of Andreon (2006) and Andreon et al. (2006), also used for other clusters (Andreon 2008; Andreon et al. 2008), solving at once for all parameters (slope, intercept and intrinsic spread of the color-magnitude relation, and luminosity function parameters: characteristic magnitude, faint end slope and normalization). It also accounts for photometric errors and the presence of a fore/background population, the latter constrained using a control field region with a times larger solid angle. The mean fitted red sequence is shown in figure 2 at mag for JKCS 041 and at mag for IRC0218A. We found the IRC0218A red sequence mag bluer than the JKCS 041 red sequence. The quoted error accounts for the error in the two red sequence intercepts ( for JKCS 041 and mag for IRC0218A) and the uncertainty in the photometric correction ( mag, see sec 2).
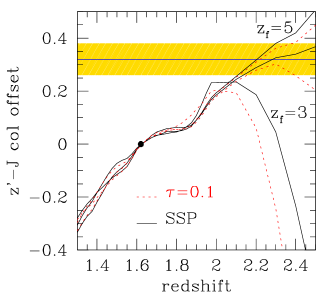
Fig. 4 plots color tracks of single stellar populations (SSP) and exponential declining () models with solar metallicity, Chabrier initial mass function, formed at , zero-pointing them to the observed color of IRC0218A cluster at . This approach to estimating the photometric redshift is more robust than using the absolute color of the population and benefits from a smaller extrapolation. For computing the color tracks we used the 2007 version of Bruzual & Charlot (2003) synthesis population model. The JKCS 041 photometric redshift derived from an SSP model with can be read easily in it: . We add an additional 0.05 error term in quadrature to approximatively account for different and star formation histories (accounting for the total spread in redshift of the three models reaching a color difference of mag), giving a final photometric redshift of . Finally, we note that if models with and and an unlikely high solar metallicity were adopted, then the estimated redshift would be only marginally different, about 0.05 lower.
The newly determined photometric redshift is slightly higher than the conservatively estimated photometric redshift quoted in Andreon et al. (2009) and consistent with it, since the two 68 % confidence intervals ([1.84,2.12] vs [2.09,2.31]) overlap. The current redshift determination supersedes the old determination since we now use a calibration at similar redshift (via IRC0218 red sequence color).
Fig. 4 also puts constraints on the formation redshift of the stellar population: is excluded at 90 (97) % confidence level for an SSP () model of solar metallicity.
The estimated redshift of JKCS 041 puts the cluster at an epoch when major changes to the color–magnitude relation are expected to occur, according to theoretical predictions. While theoretical studies (e.g. Menci et al. 2008) claim that clusters at redshift about are in a phase where the bright end of the red sequence has yet not been formed, the top-middle panel of Fig. 2 shows that the JKCS 041 red sequence is already built, indicating that (i) star formation in massive galaxies should be halted well before, or more efficiently, than in current theoretical modeling of galaxy evolution and (ii) that we still have not reached the epoch when the brightest cluster galaxies were actively forming stars, and hence were blue.
Finally, we briefly discuss the other end of the red sequence. In both JKCS 041 and IRC0218A we do not observe any sign of truncation of the red sequence down to mag ( solar masses for an SSP with ), which suggests that it is already in place at these high redshifts in clusters that are rich and massive enough to heat and retain an hot gas. The slightly different claim for IRC0218A by Papovich et al. (2010) and Tanaka et al. (2010) concerns a deficit at magnitudes fainter than our limit, where we deem these catalogs incomplete. Deeper observations and a quantitative analysis are needed to settle the issue at masses lower than solar masses.
3.3 A lower redshift/different identification for JKCS 041?
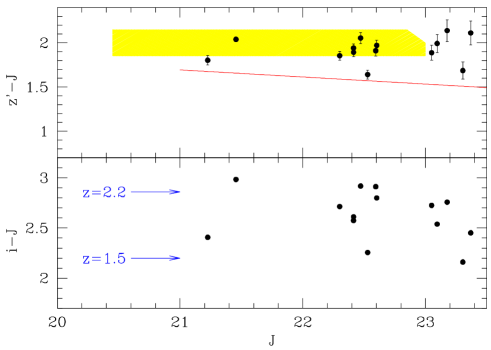
Bielby et al. (2010) propose a different photometric redshift, for much the same galaxies we have plotted in the top panel of Fig 2, using the same catalog as we do, the excellent one produced by Bielby et al. (in preparation). More precisely, Fig. 5 plots the color-magnitude diagram of the galaxies these authors claim to be at and on the red sequence. We got coordinates from the authors and we plot (their and our) photometry in Fig 5. These galaxies are redder than the IRC0218A red sequence, by mag on average (median), whereas if they were red sequence redshift galaxies, as Bielby et al. (2010) claim, they should be 0.15 mag bluer (see Fig. 4), not about 0.4 mag redder.
The bottom panel of Fig. 5 shows that a similar conclusion also holds for the color displayed by Bielby et al. (2010) in their Fig 10: JKCS 041 red sequence galaxies have an color appropriate at , and are 0.34 mag too red at . The correctness of the template color is confirmed by the observed color, mag, of the red sequence of the cluster XMMU J2235-2557 at (Strazzullo et al., 2010).
As briefly mentioned, the SSW octant of JKCS 041 is contaminated by bright and blue galaxies ( and ), as an attentive inspection of Fig. 2 shows. Fig. 6 shows the spatial distribution of these galaxies with no spatial filtering applied: they are concentrated at slightly more than arcmin southeast of JKCS 041 and there is no reason for them to be the optical counterpart of the extended X–ray emission, owing to the too large angular offset, and because another galaxy overdensity is spatially aligned with the X-ray emission. The presence of another cluster at 1’ is unsurprising, given the observed average density of about 210 (optical) clusters and groups per square degree measured in the COSMOS region by Finoguenov et al. (2007): there is a per cent probability of finding one of them, just by chance, within 1’ of any sky position. The contamination of this offset group in the solid angle used by Bielby et al. (2010) to measure the distribution of photometric redshifts toward JKCS 041 is the likely reason for their suggestion that JKCS 041 may be at . Actually, the spatial offset between the X-ray emission and the galaxies originating the photometric redshift (much of the same galaxies as in our Fig. 6) is already evident in their figure 10.
4 Conclusions
We show that galaxies mag redder than the red sequence of the cluster IRC0218A are spatially concentrated where the JKCS 041 X-ray emission is located. This implies and rules out the latter claimed by a recent paper. The 0.32 mag color difference of the two red sequences implies that the cluster JKCS 041 is at , where the uncertainty accounts for uncertainties in stellar synthesis population models, in photometric calibration, and in the red sequence color of both JKCS 041 and IRC0218A clusters.
We can thus confirm that JKCS 041 is a cluster of galaxies with the photometric redshift , with a formed potential well, deep enough to be hot and retain the intracluster medium, and with a well-defined red sequence.
Incoming X–ray survey telescopes or red-sequence based surveys will likely return hundreds of cluster candidates. Getting spectroscopic redshifts for all of them, or even a small part, is too time-consuming with current telescopes. Therefore, photometric redshifts based on the red sequence color will necessarily become very popular in the next years, so we need to get used to them.
Acknowledgements.
We thank Rich Bielby for sending us coordinates for galaxies marked in their Fig. 10 and Henry McCracken for useful information on the WIRDS catalog. We thank Rich Bielby, Ginevra Trinchieri, Roberto De Propris, and Peter Edmonds for comments on an earlier version of this paper. Based on observations obtained with MegaPrime/MegaCam111The full text acknowledgement is at http://www.cfht.hawaii.edu/Science/CFHLS/cfhtlspublitext.html and WIRCAM222The full text acknowledgement is at http://ftp.cfht.hawaii.edu/Instruments/Imaging/WIRCam/WIRCamAcknowledgment.html at CFHT.References
- Andreon (2006) Andreon, S. 2006a, A&A, 448, 447
- Andreon (2006) Andreon, S. 2006b, MNRAS, 369, 969
- Andreon (2008) Andreon, S. 2008, MNRAS, 386, 1045
- a1, (2010) Andreon, S. 2010, MNRAS, submitted
- Andreon et al. (2006) Andreon, S., Cuillandre, J.-C., Puddu, E., & Mellier, Y. 2006, MNRAS, 372, 60
- Andreon et al. (2009) Andreon, S., Maughan, B., Trinchieri, G., & Kurk, J. 2009, A&A, 507, 147
- Andreon et al. (2008) Andreon, S., Puddu, E., de Propris, R., & Cuillandre, J.-C. 2008, MNRAS, 385, 979
- b2, (2010) Bielby et al. 2010, A&A, in press (arXiv:1007.5236)
- Bruzual & Charlot (2003) Bruzual, G., & Charlot, S. 2003, MNRAS, 344, 1000
- de Propris et al. (1999) De Propris, R., Stanford, S. A., Eisenhardt, P. R., Dickinson, M., & Elston, R. 1999, AJ, 118, 719
- Dressler (1984) Dressler, A. 1984, ARA&A, 22, 185
- Finoguenov et al. (2007) Finoguenov, A., et al. 2007, ApJS, 172, 182
- Furusawa et al. (2008) Furusawa, H., et al. 2008, ApJS, 176, 1
- Holden et al. (2007) Holden, B. P., et al. 2007, ApJ, 670, 190
- Huertas-Company et al. (2009) Huertas-Company, M., Foex, G., Soucail, G., & Pelló, R. 2009, A&A, 505, 83
- Lawrence et al. (2007) Lawrence, A., et al. 2007, MNRAS, 379, 1599
- Lidman et al. (2008) Lidman, C., et al. 2008, A&A, 489, 981
- Menci et al. (2008) Menci, N., Rosati, P., Gobat, R., Strazzullo, V., Rettura, A., Mei, S., & Demarco, R. 2008, ApJ, 685, 863
- Papovich et al. (2010) Papovich, C., et al. 2010, ApJ, 716, 1503
- Strazzullo et al. (2010) Strazzullo, V., et al. 2010, A&A, in press (arXiv:1009.1423)
- Tanaka et al. (2010) Tanaka, M., Finoguenov, A., & Ueda, Y. 2010, ApJ, 716, L152
- Toomre & Toomre (1972) Toomre, A., & Toomre, J. 1972, ApJ, 178, 623
- Williams et al. (2009) Williams, R. J., Quadri, R. F., Franx, M., van Dokkum, P., & Labbé, I. 2009, ApJ, 691, 1879