Wideband microwave measurements in Nb/Pd84Ni16/Nb structures and comparison with thin Nb films.
Abstract
We present wideband microwave measurements (1-22 GHz) taken on Superconductor/Ferromagnet heterostructures with the Corbino disk technique. We apply the technique to Nb/PdNi/Nb trilayers in the vortex state and we compare the results to data taken with the same technique on a Nb thin film. We show that it is possible to directly extract the genuine flux-flow resistivity from our frequency-dependent measurements without overcoming the (depinning) critical current. The characteristic frequency for vortex relaxation can also be estimated, without resorting to a specific model. We find that the F layer determines a weakening of pinning and an enhancement of the flux-flow resistivity with respect to the Nb film.
pacs:
74.25.nn 74.25.Op 74.25.Wx 74.78.Fk 75.70.Cn1 Introduction
The interplay of superconducting and magnetism, two competing orderings, has been long studied. A new superconducting state may arise, the so-called FFLO state, where both the superconducting order parameters and the magnetic ordering are nonuniform [1, 2]. The interplay of superconductivity and magnetism can be naturally studied in S/F heterostructures (S: superconductor, F: ferromagnet), where a spatial separation of the two competing orderings can enhance and somehow control the interaction between superconductivity and magnetism. The physics of S/F heterostructures has been deeply studied [3, 4] in recent years, and new, interesting aspects were theoretically predicted and in some cases experimentally confirmed. As an example, it has been predicted that the proximity-induced superconducting order parameter does not simply decay in the F layer as in nonmagnetic metals. Instead, it oscillates in the depth of the F layer with a scale given by the coherence length in the F layer, . This behaviour gives rise to spectacular phenomena, such as the oscillations of with , the thickness of the F layer [5, 6, 7], instead of a monotonous depression of with itself. Also, the vortex state and pinning properties in S/F structures, or in S films with F particles, dots, pillars, wires etc. [8, 9, 10, 11] received much attention.
Among the many properties that can give important contributions to the understanding of the physical background of superconductors, and thus of S/F heterostructures, stand the microwave response. Indeed, the temperature dependence of the penetration depth , giving access to the temperature dependence of the superfluid density , has been measured in some S/F bilayers and S/F/S trilayers: measurements on Nb/CuMn bilayers [12] revealed a temperature dependent superfluid fraction largely different from the case of superconducting/normal metal bilayers, suggesting a temperature-independent proximity induced correlation length. Mn impurities in Nb/Cu bylayers did not affect the estimated zero-temperature [13]. In Nb/Ni bilayers [14] the temperature dependence of the superfluid density and the dependence of were found to be consistent with significant superfluid density inside the F layer. While there is certainly need for additional measurements of the penetration depth, it is surprising that there seem to be no measurements at all of the vortex state complex resistivity at radio and microwave frequencies, as opposed to conventional superconductors [15, 16, 17], diborides [18, 19], cuprates [20, 21], nanostructured high- superconductors [22, 23]. Such measurements can be particularly useful since they give direct access to the pinning constant and the free-flux-flow resistivity (see below). Thus, we started an experimental investigation of the microwave properties of S/F/S heterostructures in the vortex state.
Microwave resonators are a well-established technique to measure with high resolution the complex resistivity of thin superconducting films in the vortex state [24, 25]. However, the resonators lack the capability to perform measurements in an extended (and continuous) frequency range. Since no measurements exist of the vortex state microwave resistivity in S/F heterostructures, it would be hazardous to rely on single-frequency measurements to draw conclusions on the usually complicated response in the vortex state. Thus, we applied to S/F/S trilayers the nonresonant, wideband Corbino disk technique [26, 27]: the technique is able to reliably extract the resistivity in a rather wide frequency range, conservatively between 1 and 20 GHz. It is then possible to compare the measurements to a wide class of models to get the important vortex state parameters.
Before describing with some detail the technique, we briefly recall the expectations of the frequency-dependent complex resistivity in the vortex state, , as calculated within mean field models with a static magnetic induction field perpendicular to the microwave currents. At microwave frequencies the vortex displacement due to the force exerted by the alternate currents is very small [28], and it is customary to write down the equation of forces (per unit length) acting on a single vortex line in the local limit as follows [15, 20, 29, 30]:
| (1) |
where is the vortex velocity, is the unit vector along the vortex, is the flux quantum, is the Lorentz force exerted on the flux line and the stochastic force takes into account thermal effects, responsible for fluxon jumps between pinning sites. The viscous drag coefficient , which is also commonly referred to as vortex viscosity, takes into account the power dissipated by moving vortices due to, e.g., the relaxation processes of quasiparticles and scattering processes due to currents flowing in the vortex cores [29, 31, 32, 33]. As such, it bears informations related to the microscopic electronic state. The effects of pinning are represented by the force where is the spatial function describing the pinning potential. The appearance of a Hall term in (1) can be neglected in superconductors in the dirty limit.
From the basic equation of motion (1), many models can be derived, differing essentially for the impact of thermal effects and elasticity of the vortex lattice [15, 30, 34, 35]. Nevertheless, it has been shown [36] that the seemingly large variety of models yield expressions for the vortex resistivity that can be cast in a single, very general expression:
| (2) |
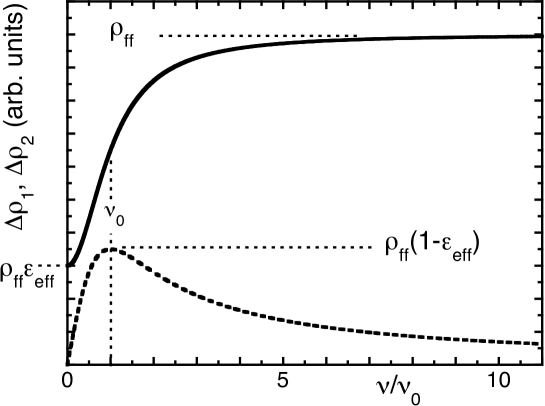
where the dimensionless parameter is a measure of the weight of creep phenomenon, is the measuring frequency and is the main characteristic frequency governing the vortex relaxation phenomena. With respect to the well-known depinning frequency [15] , one has when , that is when thermal effects can be neglected (one should mention that this is the approximation under which most of microwave measurements in conventional superconductors have been interpreted in the past). The flux-flow resistivity represents the vortex resistivity in absence of any pinning and creep effect, that is the ideal vortex flow resistivity. As it can be seen, it is possible to obtain the true flux flow resistivity by simply increasing sufficiently the measuring frequency , without the need for (a) ultrapure samples and (b) high transport currents as in dc, with the related technical problems due to heating.
The frequency dependence of as described by (2) is depicted in Figure 1 as a function of the reduced frequencies in the range . As it can be seen, the real part of the vortex resistivity contains basically the entire information on the vortex parameters, . Thus, measurements of over a sufficiently wide frequency range are of primary importance.
Aim of this paper is to show how the swept-frequency Corbino disk technique can be a valuable tool in the study of the vortex state resistivity, in particular in S/F heterostructures: the little role played by the models in the analysis of the data, together with the power of swept-frequency data make the Corbino disk an ideal probe of new materials where one cannot rely on known properties. We also present the first measurements of the frequency-dependent vortex resistivity in two S/F/S trilayers, and we show that differences emerge with respect to simple Nb even at extremely small .
The paper is organized as follows. In the next Section we introduce the Corbino disk technique, with the expressions linking the measured quantities and the complex resistivity of superconducting films in the vortex state. In Section 3 we briefly describe our samples, and we present the experimental data for the complex resistivity taken in a Nb film and two Nb/PdNi/Nb trilayers, with different thickness of the F layer. We summarize the results and suggest further developments in Section 4.
2 The Corbino disk technique
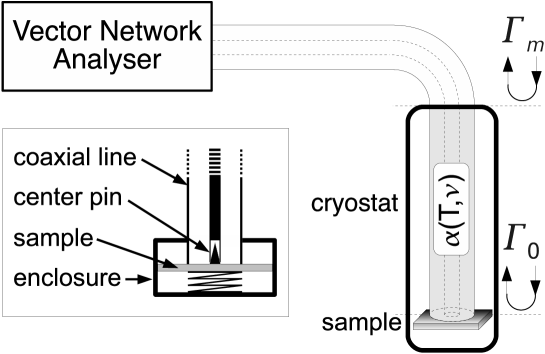
We have developed in the past the Corbino disk technique [27, 37], following the pioneering work (in the context of superconductivity) of the Maryland group [26, 38]. The technique is conceptually elementary, consisting in the termination of a coaxial cable with the sample under study and the measurement of the complex reflection coefficient . In our particular case, we measured the complex reflection coefficient by means of a Vector Network Analyser, or VNA (we performed most part of the measurements with an Agilent-HP 8510C, and a smaller part of the measurements with an Anritsu 37269 D), connected to a microwave line made up of commercial coaxial cables with physical cutoff frequency at 60 GHz. In principle, from the measured one can extract the real and imaginary part of the complex resistivity of a sample terminating the cable. The practical realization turns out to be far from being trivial. The technique is inherently nonresonant, and the reflection coefficient is heavily affected by losses in the cable, phase stability of the cable itself and standing wave in the necessarily long microwave line connecting the sample in the cryostat to the external VNA. The achievable sensitivity of the measurement depends crucially on the calibration and on the characteristics of the VNA employed. While very small signals can be in principle detected with a full calibration (by using three known standard loads, typically an open, a short and a load of known impedance), this is not feasible in the present case: since both temperature at sample position and temperature gradients along the cable affect the transmission line, the conventional calibration is almost impossible to achieve. Thus, an approximate calibration, with the sample in-situ, has to be used, as detailed below. We remark that the approximate calibration is the limiting factor in assessing the sensitivity of the present measurements. As a rule of thumb, and with some conservative overestimates, in our present setup and with the chosen calibration procedure no signal below 1% of the normal state of the superconducting sample can be detected with sufficient reliability. However, the invaluable advantage of swept-frequency measurements compensates for the reduced sensitivity with respect to, e.g., resonator-based microwave measurements.
We described elsewhere [27] both the measuring cell and the issues related to the measurement procedure, with particular attention to calibration issues. We here recall the basic aspects of the technique and the specific calibration method here employed.
The reflection coefficient at the sample surface is related to the impedance of the sample through the relation [39]
| (3) |
where is the characteristic (wave) impedance of the dielectric which fills the cable. 111In principle one should have (vacuum impedance) if the last section of the cable is not filled with the dielectric. In practice, the device (launcher) actually placed at the terminal section of the cable to make the contact between the coaxial cable and the sample, does not include any dielectric but introduces an additional contribution which in general requires to experimentally determine . For thin films (that is, for films whose thickness is lower than the penetration depth) the sample complex resistivity is related to the sample impedance through the relation , so that [26, 37]
| (4) |
Unfortunately, a direct measure of is impossible. One measures instead (see Figure 2) the reflection coefficient at the beginning of the microwave line , which is related to through cable coefficients that should be determined through some calibration procedure.
Since those coefficients depend on temperature and temperature gradients of the cable, a full calibration is in general not possible. This crucial problem can be partially overcome [27] by making use of a calibration procedure which allows to obtain variations of with some external parameter (e.g., the temperature , the applied magnetic field ). For instance, by measuring at two different temperatures, it is possible to obtain the sample impedance difference between the two measured temperatures. This procedure is based on the hypothesis that most of the cable parameters vary only smoothly with temperature. This hypothesis can be verified through the measured data [27]. Assuming this hypothesis is valid, it can be shown that the measured reflection coefficient can be related to the reflection coefficient at the film surface through the relation
| (5) |
The complex coefficient describes in a compact way the residual cable contribution to the measurement. In the present measurements of the vortex state response, it is essential that this quantity is field independent: non-magnetic cables and connectors have to be used.
By focusing on field sweep measurements (i.e. measures performed by varying the field at fixed ), it is possible to derive by considering data taken at the two distinct fields and .
At , one has , where and are the reflection coefficient and surface impedance of the sample in the normal state. For superconducting samples in the thin film limit, is a frequency independent real quantity (since the plasma frequency of the material is usually much higher than the measuring frequency) lower than , which is also real. As a consequence, is frequency independent, real and negative.
At , one has . At low frequencies and not too close to , so that 222Note that this requirement is softer than the similar one, : the latter involves the additional requirement . This is quite useful for the case of thin superconducting films, where usually ..
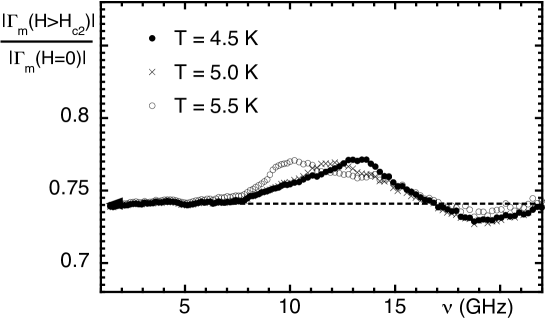
Therefore, at low frequencies the ratio , which is a frequency independent constant. An example based on the measurements on the Nb sample is reported in Figure 3. It can be seen that, apart a residual oscillation at high frequency, that remains within 3%, the frequency independence of holds.
Since is a frequency-independent quantity, it is possible to estimate it by using low frequency data only, GHz. It is then possible to determine , the important frequency-dependent cable coefficient, which contains as a proportionality constant, according to:
| (6) |
and then used to extract for each set of measurements corresponding to a field sweep at fixed . Finally, by using (4) the frequency-dependent resistivity can be obtained. In the present measurements there is the additional advantage that the normal state resistivity at low temperature of our samples is not temperature dependent. Thus, does not depend on temperature either and once obtained at one temperature the value can be used to derive at all . One should remark that this kind of calibration is feasible only on thin films, where is frequency-independent: the same procedure cannot be applied to the study of bulk materials (e.g., single crystals), being in this case dependent on the frequency. In this case, one should develop an alternative, sample-in-situ, calibration.
Using (4) and (6) one finally obtains for the sample complex resistivity :
| (7) |
| (8) |
where we have used the approximations and [where ], which hold true since is small. These expressions clearly show that the real part of the resistivity can be obtained solely by the modulus of the reflection coefficient, whereas the imaginary part strongly depends on the phase. On practical grounds, this is a relevant remark: whenever thermal or other instabilities affect the cable response, they impact largely and mainly on the measurement of the phase rather than on the modulus: in these cases, the above expressions show that although the imaginary part of the resistivity would be largely affected, the real part would still remain reliably determined. In the measurements here presented we limit ourself to the extraction of the more reliable real part of the resistivity, .
3 Experimental results
In this Section we present experimental results for the frequency-dependent real part of the resistivity in the mixed state in three superconducting samples: a pure Nb film of 20 nm nominal thickness and two Nb/Pd84Ni16/Nb trilayers. The samples were fabricated at University of Salerno/CNR-SPIN. They were grown by ultra-high-vacuum, dc magnetron sputtering. The films and heterostructures were grown at room temperature, and the thickness was carefully calibrated against deposition rate, following the procedure described in more details elsewhere [40]. Since microwave measurements can be seriously distorted by the use of semiconducting substrates, as extensively discussed previously [41], samples were deposited on crystalline sapphire (Al2O3) instead of the more common choice of Si. We focused the attention on samples with small , in order to assess whether ferromagnetic layers thinner than the coherence length in the ferromagnet, , can give rise to detectable features in the transport properties, apart the well-known drop in [42]. Since in Nb/PdNi/Nb one estimates 3-4 nm [42], we have considered here the following three samples: a Nb thin films (sample Nb), with nominal thickness 20 nm, as a reference, and two trilayers with nominal Nb thickness 15 nm for upper and lower layers and PdNi thickness 1 nm and 2 nm (samples T1 and T2, respectively). The normal state dc resistivity was in all cases cm. The main characteristic parameters are reported in the Table. The critical temperature and the upper critical fields were estimated from the disappearance of the microwave signal, and were found in good agreement with the dc data. The magnetic field was applied perpendicular to the film plane.
As described in Section 2, by measuring the changes with the applied magnetic field of the frequency-dependent complex reflection coefficient of the samples we derived the field-increase of on the basis of the Equation (7). Apart from a very narrow region in the phase diagram close to the transition line , we do not expect a detectable contribution of pairbreaking at our working frequency, so that we entirely ascribe the measured signal to the vortex resistivity. We anticipate that the frequency dependence of the measured real resistivity is well described by the general theoretical expression (2), with no need for other contributions, thus adding confidence in the assumption. For this reason, when dealing with experimental quantity we will use the symbol for the experimental field increase of the real resistivity. In order to directly compare different samples, we report in the following the normalized resistivity, .
Measurements have been taken approximately at the same reduced temperature to compare similar thermal properties, and at the same magnetic fields 0.6 and 0.8 T in order to have the same vortex density. Sufficiently large magnetic fields have been chosen in order to examine also the creep factor in the three samples, which becomes negligibly small at lower fields.
In Figure 4 we report in the Nb sample taken at 4.5 K. We first notice the appearance of steps in at the larger field. The resistivity switches toward a more dissipative (larger ) state and then decays abruptly, then switches again. We remark that, to the best of our knowledge, such instabilities have not been reported before. In particular, a time-domain analysis reveals that the switching phenomena here reported have a very long typical time scale, 1s [43]. We will not focus further on this anomalous behaviour, that is presently under study. We mention that it is invariably present in our measurements, although somehow sample-dependent, it is generally more evident approaching the superconducting transition333While this is a general trend, a few exceptions exist. For example, in the measurements of Figure 6, taken close to , no switches are evident. and completely disappears in the normal state (i.e., for or ). This behaviour has been verified with both VNAs. Further details and a characterization of the phenomenon have been given elsewhere [43]. We focus instead on the “conventional” behaviour, indicated in Figure 4 by full symbols, that we compare to the theoretical expression (2).
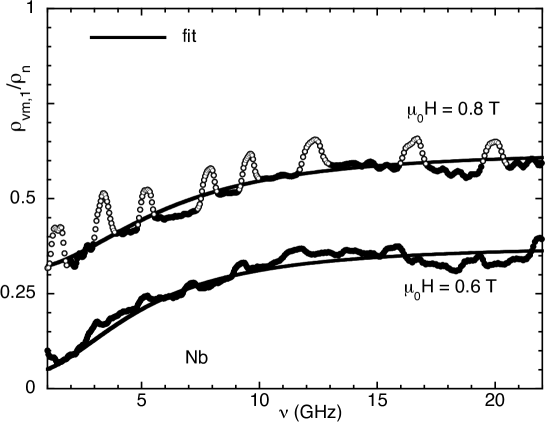
Directly from the data it can be seen that the vortex characteristic frequency lies well within our measuring range of 1-22 GHz, as indicated by the steep rise in . As a consequence, we are able to observe the free-flux-flow plateau in at the high edge of our measuring range. A quantitative fit with (2) is reported in Figure 4. The fit is in good agreement with the data, and it gives the value for the vortex parameters reported in the Table.
We note the rather high value of the characteristic frequency, 5 and 6 GHz at 0.6 and 0.8 T, respectively. This result is consistent with the depinning frequency in Nb thin films as measured with single-frequency resonators [16], and it indicates quite a strong pinning in our Nb film. We also note that the normalized flux-flow resistivity by a significant factor. This remark is a direct demonstration that the simple Bardeen-Stephen model [29], where the flux flow resistivity with 1, does not describe well our data. While it should be mentioned that, when a full time-dependent Ginzburg-Landau calculation is performed, can be much smaller than the BS value [33], it seems that this result, which we recall is independent from a particular model for vortex motion, calls for further studies of the flux flow resistivity in conventional superconductors. Measurements are presently in progress.
Finally, we remark that a significant creep exists at the higher measuring field, T. This is an interesting feature, since the role of creep is often neglected in the analysis of high-frequency data in conventional superconductors [16], under the assumption that it is relevant only extremely close to the transition. We notice that recent low-temperature, multifrequency microwave measurements in conventional superconductors revealed some contribution from flux creep [17]. It appears that multifrequency or, like in the present work, swept-frequency measurements are a particularly suitable tool to directly uncover features in the vortex state resistivity. We propose a framework in order to explain the pinning and creep features found in the present measurements. First, one should consider that at microwave frequencies the flux lines undergo very small displacements around their equilibrium position. In this sense, the pinning probed by the microwave response concerns the curvature at the bottom of the potential well, and has (as a first approximation) nothing to do with the height of the pinning well itself. This is a significant difference with respect to conventional dc measurements and pinning, as measured by the critical current density , is essentially dictated by the height of the potential wells. By contrast, creep is determined by the height of the wells both at microwaves and in dc. The present measurements can then be explained in terms of rather steep, but not very deep pinning wells: the pinning-related parameter , being rather high, points to steep pinning wells, while the large creep factor indicates that the pinning wells themselves are not particularly deep. A check of this framework comes from the magnetic field dependence of the vortex parameters: increasing the field should first reduce the height of the pinning wells, and only as a further effect it should affect the shape of the bottom of the well. This behaviour should result in a quickly increasing creep factor with the field, and a weakly field dependent depinning frequency (until is approached, where the pinning potential flattens and the characteristic frequency vanishes). In fact, it can be seen in the Table that with increasing field does not drop quickly, while increases significantly (anticipating the results obtained in the trilayers, we observe the same trend, even if and pinning are smaller in sample T2). The physics at high driving frequency differs from the better known flux motion processes in dc: at low dc currents the motion of flux lines arises as flux bundles [44], which require quite a large activation energy. Hence, the small creep factor as seen in dc unless the current is raised. By contrast, the motion at microwave frequencies is much closer to the single-fluxon motion, as shown by the study of the elastic force matrix for the flux lattice [45]: with increasing frequency, the range of the transmitted forces between fluxons drops thus yielding the single-vortex regime. In this case, the activation energies related to single vortex creep are smaller [44].
Having determined the vortex parameters in Nb, we turn to the analysis of the data in the trilayers.

Figure 5 reports in sample T1, together with the fits with (2). It turns out that sample T1, where the PdNi thickness is limited to 1 nm, has a behaviour very close to the Nb film for what concerns the vortex resistivity. The effect of the F layer seems limited to the reduction of by about 1.2 K with respect to a single Nb film of thickness 30 nm [42]. The vortex parameters are reported in the Table. Again, direct indications of strong pinning and significant creep is found, and . The same considerations already stated for Nb are valid. It seems that 1 nm is not sufficient to affect the vortex state resistivity in our S/F/S trilayers.

The data for sample T2 are presented in Figure 6, again with the fits obtained using (2). Even if the thickness of the F layer is only 2 nm, significant differences with Nb and trilayer T1 appear. First, pinning is significantly reduced, as evident from the much steeper raise in . Performing the fits, one finds that the characteristic vortex frequency is reduced by an appreciable amount with respect to Nb and trilayer T1, while creep does not change much. However, the most remarkable feature is the value of the flux flow resistivity. In this case we find , which is above the BS value. This finding cannot be easily explained, and clearly calls for further investigations. It should be stressed that the dynamics remains unchanged, meaning with this statement that the frequency dependence is still the same of pure Nb and of sample T1, satisfactorily described by (2). Within the wide class of models represented by (2), the high values of must find an explanation in the structure of the vortex itself, and/or in the quasiparticle relaxation processes in the superconducting state in presence of a magnetic field, since no pinning or thermal effects can be invoked. A study of the vortex resistivity as a function of is clearly required, and it will be the subject of ongoing investigation.
-
Nb T1 T2 Nb thickness (nm) (1) 20 15 15 PdNi thickness (nm) (1) — 1 2 (K) (2) 6.20.1 6.20.1 5.10.1 Measuring (K) (3) 4.500.01 4.500.01 3.660.01 (T) (2) 1.000.05 0.900.05 0.850.05 vortex parameters(4) at 0.6 T 0.380.02 0.500.02 0.820.02 (GHz) 5.00.4 5.50.5 4.00.4 0.100.02 0.230.03 0.170.03 vortex parameters(4) at 0.8 T 0.630.02 0.780.01 0.960.01 (GHz) 6.00.4 4.00.4 2.30.3 0.500.01 0.480.03 0.550.03
(1) Nominal values, as determined through careful calibration against deposition rate [40].
(2) Estimated from the disappearance of the microwave signal.
(3) Errors report the temperature stability during each measurement.
(4) Uncertainties estimated through the sensitivity of the fit quality to each fitting parameter.
4 Conclusions
In this paper we have presented the first measurements of the frequency dependence of the vortex-state microwave resistivity in S/F/S trilayers, with Nb as S layer and PdNi as F layer, and on a Nb sample. We have used a wideband technique, the Corbino disk technique, capable to obtain reliable measurements in the frequency range 1-22 GHz. In Nb, significant creep is detected and a previously unobserved “switching” behaviour is found approaching the transition line. In trilayers the experimental data show that, even when the F thickness is as thin as half of the coherence length in the ferromagnet, , the superconducting state changes from the pure superconductor in a way that the vortex state resistivity is affected. By exploiting the wideband technique, we have shown that changes in the free-flux-flow resistivity are the most relevant, since one obtains in excess of the BS limit . In addition, one observes a reduced pinning. By contrast, the trilayer with = 1 nm does not exhibit any qualitative difference with respect to the Nb reference sample. Our observations call for further study of the vortex state resistivity in S/F/S heterostructures, which are presently in progress.
References
References
- [1] Larkin A I and Ovchinnikov Yu N 1965 Sov. Phys. JETP 20 762
- [2] Fulde P and Ferrell R A 1964 Phys. Rev.135 A550
- [3] Buzdin A I 2005 Rev. Mod. Phys.77 935
- [4] Lyuksyutov I F and Pokrovsky V L 2005 Adv. in Phys. 54 67
- [5] Jiang J S, Davidovic D, Reich Daniel H and Chien C L 1995 Phys. Rev. Lett.74 314
- [6] Kontos T, Aprili M, Lesueur J, Genet F, Stephanidis B and Boursier R 2002 Phys. Rev. Lett.89 137007
- [7] Zdravkov V, Sidorenko A, Obermeier G, Gsell S, Schreck M, Muüller C, Horn S, Tidecks R and Tagirov L R 2006 Phys. Rev. Lett.97 057004
- [8] Silhanek A V, Gillijns W, Moshchalkov V V, Zhu B Y, Moonens J and Leunissen L H A 2006 Appl. Phys. Lett. 89 152507
- [9] Palau A, Parvaneh H, Stelmashenko N A, Wang H, Macmanus-Driscoll J L and Blamire M G 2007 Phys. Rev. Lett.98 117003
- [10] Kramer B G, Silhanek A V, Van de Vondel J, Raes B and Moshchalkov V V 2009 Phys. Rev. Lett.103 067007
- [11] A. Yu. Aladyshkin, A. V. Silhanek, W. Gillijns and Moshchalkov V V 2009 Supercond. Sci. Technol.22 053001
- [12] Mercaldo L V, Anlage S M and Maritato L 1999 Phys. Rev. B 59 4455
- [13] Palomba F, Andreone A, Pica G, Salluzzo M, Attanasio C, Di Luccio T, Maritato L and Russo R 2000 Physica B 284 955
- [14] Lemberger T R, Hetel I, Hauser A J and Yang F Y 2008 J. Appl. Phys.103 07C701
- [15] Gittleman J and Rosenblum B 1966 Phys. Rev. Lett.16 734
- [16] Janjušević D, Grbić M S, Požek M, Dulčić A, Paar D, Nebendahl B and Wagner T 2006 Phys. Rev. B 74 104501
- [17] Song C, Heitmann T W, DeFeo M P, Yu K, McDermott R, Neeley M, Martinis John M, Plourde B L T 2009 Phys. Rev. B 79 174512
- [18] Dulčić A, Požek M, Paar D, Choi Eun-Mi, Kim Hyun-Jung, Kang W N and Lee Sung-Ik 2003 Phys. Rev. B 67 020507(R)
- [19] Sarti S, Amabile C, Silva E, Giura M, Fastampa R, Ferdeghini C, Ferrando V and Tarantini C 2005 Phys. Rev. B 72 024542
- [20] Golosovsky M, Tsindlekht M and Davidov D 1996 Supercond. Sci. Technol.9 1
- [21] Tsuchiya Y, Iwaya K, Kinoshita K, Hanaguri T, Kitano H, Maeda A, Shibata K, Nishizaki T and Kobayashi N 2001 Phys. Rev. B 63 184517
- [22] Pompeo N, Rogai R, Silva E, Augieri A, Galluzzi V and Celentano G 2007 Appl. Phys. Lett. 91 182507
- [23] Pompeo N, Silva E, Ausloos M and Cloots R 2008 J. Appl. Phys.103 103912
- [24] Peligrad D-N, Nebendahl B, Kessler C, Mehring M, Dulčić A, Požek M and PaarD 1998 Phys. Rev. B 58 11652
- [25] Pompeo N, Marcon R and Silva E 2007 J. Supercond. and Novel Magnetism 20 71
- [26] Booth J C, Wu D H and Anlage S M 1994 Rev. Sci. Instrum. 65 2082
- [27] Sarti S, Amabile C and Silva E 2004 Measurements of surface impedance of superconductors as a function of frequency in microwave range arXiv:cond-mat/0406313
- [28] Tomasch W J, Blackstead H A, Ruggiero S T, McGinn P J, Clem J R, Shen K, Weber J W and Boyne D 1988 Phys. Rev. B 37 9864
- [29] Bardeen J and Stephen M J 1965 Phys. Rev.140 A1197
- [30] Coffey M W and Clem J R 1991 Phys. Rev. Lett.67 386
- [31] Tinkham M 1964 Phys. Rev. Lett.13 804
- [32] Kopnin N B 2002 Rep. Prog. Phys.65 1633
- [33] Kopnin N B 2001 Theory of Nonequilibrium Superconductivity (Clarendon Press)
- [34] Brandt E H 1991 Phys. Rev. Lett.67 2219
- [35] Lütke-Entrup N, Plaçais B, Mathieu P and Simon Y 1998 Physica B 255 75; Pautrat A, Goupil C, Simon C, Lütke-Entrup N, Plaçais B, Mathieu P, Simon Y, Rykov A and Tajima S 2001 Phys. Rev. B 63 054503
- [36] Pompeo N and Silva E 2008 Phys. Rev. B 78 094503
- [37] Tosoratti N, Fastampa R, Giura M, Lenzi V, Sarti S, Silva E 2000 Int. J. Mod. Phys. B 14 2926. Note that using the notation of that paper
- [38] Wu D H, Booth J C and Anlage S M 1995 Phys. Rev. Lett.75 525
- [39] Collin R E 1966 Foundation for microwave engineering (McGraw-Hill)
- [40] Ilyina E A, Cirillo C and Attanasio C 2010 Physica C 470 877
- [41] Pompeo N, Marcon R, Méchin L and Silva E 2005 Supercond. Sci. Technol.18 531
- [42] Cirillo C, Bell C, Iannone G, Prischepa S L, Aarts J and Attanasio C 2009 Phys. Rev. B 80 094510
- [43] Pompeo N, Silva E, Sarti S, Attanasio C and Cirillo C 2010 Physica C 470 901
- [44] Blatter G, Feigel’man M V, Geshkenbein V B, Larkin A I and Vinokur V M 1994 Rev. Mod. Phys.66 1125
- [45] Ong N P and Hui Wu 1997 Phys. Rev. B 56 458