The connection of solar wind parameters with microwave and UV emission of coronal hole atmosphere
Solar Physics
Abstract
This paper presents results of comparison between observations of coronal holes in the UV (SOHO EIT) and microwave emission (17, 5.7 GHz, 327 and 150.9 MHz, NoRH, SSRT and Nancy radioheliographs), and solar wind parameters, according to the ACE spacecraft data over the period 12 March–31 May 2007. Increase in the solar wind velocity up to 600 was found to correlate with decrease in the UV flux in the central parts of the solar disk. The connection between parameters of the microwave emission at three different solar atmosphere levels and the solar wind velocity near the Earth’s orbit was determined. This connection suggests existence of common mechanisms of solar wind acceleration from chromospheric altitudes to the upper corona. We also suppose existence of two different mechanisms of the solar wind acceleration at altitudes of less and more than one solar radius.
keywords:
Corona, Quiet; Coronal Holes; Radio Emission, Quiet; Solar Wind1 Introduction
S-Introduction
The solar wind (SW), predicted by Vsechsvyatsky [Vsehvyatskiy et al. (1955)], Ponomarev [Ponomarev (1957)], Parker [Parker (1958)], was found in the experiments on board the spacecrafts Luna-2 and Luna-3 [Gringauz et al. (1962)]. Solar wind can be sorted out into three components – the slow, the fast, and the sporadic ones. Existence of different components of the solar wind has been revealed due to the observations of the spacecraft Mariner-2 [Neugebauer and Snyder (1966)]. According to \openciteSheeley85, the sporadic component is connected with coronal mass ejections. Unlike the sporadic component, the slow and fast components are regular: the slow one exists always, and the fast one is observed periodically. Sources of the latter are coronal holes (CH) – regions of the unipolar magnetic field with open configuration [Hundhausen (1972)].
The slow and fast SW components differ not only in plasma velocity (up to 450 and 800 , respectively). According to the observations of radio scintillations on inhomogeneities of the interplanetary medium, one of the main SW parameters - velocity distribution depending on the distance from the Sun - is different for the slow and fast components. The maximum velocity of the slow component is reached at a distance of more than 10 solar radii [Wang et al. (1998)], whereas the fast component reaches its maximum velocity near the Sun, at a distance of one or two solar radii [Grall, Coles, and Klinglesmith (1996)]. These results of observations suggest that the mechanism accelerating SW particles is either completely different or has essentially different parameters for different components. Differences in conditions of the fast SW component acceleration are likely to be found at distances of less than one solar radius over the photosphere.
This assumption is also supported by observations of the velocity nonthermal component made with the use of UV spectrograph SUMER on board SOHO [Wilhelm et al. (1995)]. Investigation into ultraviolet spectrum of the CH atmosphere [Chae, Hle and Lemaire (1998)] shows that the maximum of fluctuation velocity (i.e., the nonthermal component in the expression , where is the Boltzmann constant, is the ion temperature, is the mass of the ion emitting the line) is reached at CH levels in the solar atmosphere with temperatures of about K (in the transition region). The nonthermal velocity component specifies wave flux , where is the plasma density, is the Alfven velocity that is probably responsible for acceleration of SW particles and heating of the corona into CH.
Consequently, parameters of the fast SW component may be formed in the lower solar atmosphere (chromosphere, transition region, and lower corona). Some authors also confirm that SW parameters and the solar emission in the optical and UV waveband are related (e.g., \openciteVrsnak07; \openciteObridko09). Intensity, areas and ratio of areas of CH emission/absorption lines were proposed in paper [Stepanian et al. (2008), Shugai et al. (2009), Obridko et al. (2009)] to predict SW characteristics. However, these methods are generally based on the emission analysis at single wavelength (sometimes at two wavelengths); i.e., they do not reflect completely distribution of plasma parameters and energy release processes in the solar atmosphere.
Supplementary information about peculiarities of acceleration of the fast SW component could be gained from the thorough study of the UV and microwave emission of the CH, obtained with high spatial resolution. However, there are only a few works (e.g., \openciteChae98) devoted to spectral observations of the UV emission obtained from SUMER data. This is caused by the peculiarities of observation programmes of this instrument. Besides, no studies of dependence between high-speed SW characteristic and the microwave CH emission have been made so far.
Different scientific groups have earlier made observations of the microwave CH emission over a wide frequency range. Comparative analysis of such observations shows that the frequency range 6-17 GHz is characterized by an increased emission (compared to the quiet Sun). This fact can not be explained in the framework of typical models of the solar atmosphere [Maksimov et al. (2006)]. The Nobeyama Radioheliograph (NoRH, 17 GHz, \openciteNakajima94) regularly observes the increased level of brightness temperatures in CH [Gopalswamy et al. (1999), Nindos et al. (1999), Moran et al. (2001)]. Analysis of simultaneous observations with NoRH and the Siberian Solar Radio Telescope (SSRT, 5.7 GHz, \openciteGrechnev03) revealed linear anticorrelation between brightness temperatures at 5.7 and 17 GHz in coincident CH regions [Krissinel et al. (2000)]. According to the results of observations near the solar limb, carried out at SSRT and NoRH, such regions are situated radially [Maksimov et al. (2004)]. Analysing observations of the microwave emission, [Maksimov et al. (2006)] showed that the corona (at least, in some parts of CH) is heated by the wave flux propagating from the photosphere, and the altitudes where the increased microwave emission is formed correspond to the altitudes of the chromosphere and transition region. Some researchers (see \openciteCranmer04) suppose the same mechanisms of the SW acceleration and coronal heating. Observations of the UV spectrum imply possible connection between energy release and microwave emission in the lower solar atmosphere.
According to the study of the magnetic field configuration of CH, there is a connection between SW characteristics and parameter of the ”superradial” divergence of the magnetic tube. ”Superradial” divergence is determined from measurements of the photospheric magnetic field and its extrapolation (in the potential approximation) to the source surface [Wang, Sheeley (1990)]. There is also a connection between SW characteristics and the unipolar field area at the CH base [Eselevich (2009)]. Forecast of SW parameters based on such works does not always yield correct results . Probably the magnetic field configuration can not completely determine concentration and velocity of SW, since the SW plasma carries frozen-in magnetic flux out to the outer solar atmosphere and thus changes its configuration. This restricts application of methods of the magnetic field extrapolation (potential and non-potential) which do not take this effect into account when forecasting SW parameters.
The goal of this investigation is to study possible connection between the SW velocity and emission of the lower solar atmosphere of CH.
2 Observations
S-Observations
2.1 Data
S-text The period from 12 March to 31 May 2007 (the last solar minimum) was studied. We chose this interval because of the fact that the main parameters of the fast SW component during a solar minimum are defined by CH characteristics. Besides, there was a complete set of experimental data for this period.
To perform analysis, we used images of the Sun in the microwave emission recorded by NoRH, SSRT and Nançy radioheliographs at 17 GHz, 5.7 GHz, 327 MHz and 150 MHz, and the SOHO/EIT data at the wavelength Fe XII =195Å. Variations in SW parameters were measured by SWEPAM (Solar Wind Electron, Proton, and Alpha Monitor) during the experiment on board the ACE spacecraft (Advanced Composition Explorer) orbiting near the libration point L1 in the Sun-Earth system (1.5 million km from the Earth towards the Sun), see http://cdaweb.gsfc.nasa.gov/istp˙public.
2.2 Data processing
Applying the method of separation of coronal hole boundaries similar to the technique that was used in [Vršnak et al. (2007)], we found integral characteristics with the use of two-dimensional images of the Sun. This method implies separation of a region bounded by meridians near the solar centre. Then, the UV emission flux was calculated in this region. We noticed, however, that the polar regions did not contribute significantly to the SW stream registered near the Earth. Thus the region (unlike that in \openciteVrsnak07) was bounded by an ellipse , where is the solar radius. Relation between semiaxes of the ellipse was determined when comparing positions of CH boundaries and the SW velocity at the point L1 (i.e., we were trying to find out if the high-speed SW stream was registered from CH that had the latitude and longitude corresponding to the occurrence of a CH boundary on ellipse boundaries).
The SOHO/EIT data were processed using SolarSoft procedures and images from the calibration database of the instrument. The ratio of the emission flux to the CH area (i.e., the average emission flux in the Fe XII =195Å line) was determined for CH within the limits of an elliptic central region. The ionic concentration in CH was deduced from the relationship:
| (1) |
obtained in \openciteBrosius02, where is the Fe XII =195Å line intensity on the calibrated image.
Using data on the microwave emission at 4 frequencies, we determined equivalent to the microwave flux of CH for the regions inside the ellipse, in the quiet Sun units:
| (2) |
where is the frequency, is the brightness temperature inside a CH (its summation is made throughout the CH surface elements ), is the brightness temperature of the quiet Sun (its summation is made throughout the entire disk). So we obtained data on the microwave emission of CH from 4 atmospheric levels, and data on the ionic concentration inside CH.
3 Experimental data analysis
S-Analysis
3.1 Solar wind parameters
Three upper panels (a, b, c) of Figure 1 show SW parameter variations during the period under study: strength of the component and of the interplanetary magnetic field (IMF), the SW velocity, and the proton concentration in SW, respectively. Referring to Figure 1, ten high-speed SW streams (whose beginning is marked by vertical lines) are evident throughout this period. The first SW stream (with its maximum on 13 March) was excluded from consideration, since this SW stream was generated by CH that had passed through the central meridian some days before 13 March (when the UV imaging telescope EIT started its observations after regular maintenance service). Lack of EIT data (139-145 days of year) is caused by the break in observations of the instrument during these days. In Figure 1, the streams considered in the work are numbered from 1 to 9.
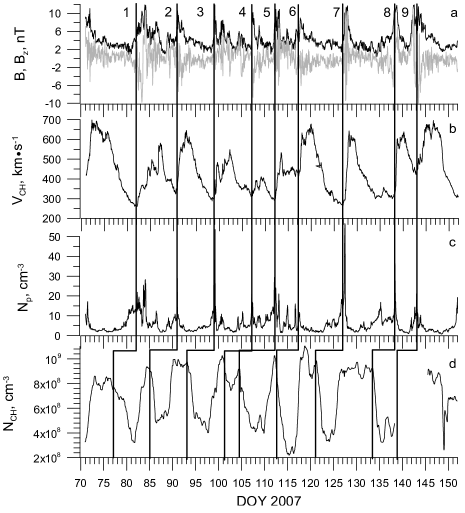
The high-speed streams observed during the period under study have essentially different characteristics: the maximum speed varies from 300 to 680 , the proton concentration at the leading edge of the high speed stream can reach up to 40-45 or can be less than 5 (Figure 1b,c). Variations in the average IMF value B for 9 SW streams look similar: an abrupt increase at the leading edge of the SW stream and subsequent gradual decrease. During the period under study, varied in the range from 2 to 10 nT.
3.2 UV emission of CH
The lower panel ”d” of Figure 1 shows variation of plasma concentration in CH. It is observed from the figure that the main increases in the SW velocity (1-9), taking account of the arrival time at the point L1, coincide with plasma concentration decrease in CH. Notice that the delays, determined from concentration fronts in CH and from SW stream speeds, are different and vary from 4 to 7 days.
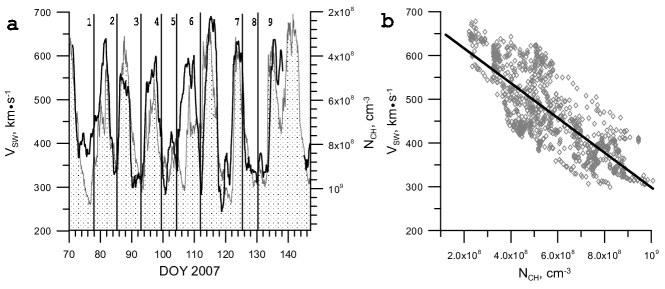
In Figure 2a, diagram of SW velocity variations in time is superposed onto diagram of variations in the mean concentration of CH, with consideration for the time delay equal to the time when SW particles with propagation velocity 600 come to the point L1. The y-axis for concentration (to the right) is reversed (i.e., higher values are at the bottom). Referring to Figure 2a, SW velocity variations and plasma concentration in CH are similar. Discrepancy between positions of some SW streams and concentration depressions (e.g., streams 4, 5, and 6) can be explained by the difference in time of the SW particle arrival at the point L1.
Taking account of different delays in the SW particle arrival (from 4 to 7 days, see Figure 1) at the point L1, we show correspondence between concentrations and velocities 350 (Figure 2b). The slow SW component is thus cast out in the time series where possible. Values and in 8 SW streams are approximated by the linear dependence
| (3) |
with correlation 0.63. Notice that parameters of different SW streams significantly differ (especially the delay time between the plasma concentration decrease in CH and the arrival of the SW high-speed stream at the Earth). Correlation of each separate SW stream velocity with its corresponding linear dependence reaches 0.8-0.9. However, there was no evidence of correlation between plasma concentration in CH and proton concentration in SW.

3.3 Microwave emission of CH
Figure 3 (b-e) presents variations in the microwave emission flux of CH at 4 frequencies, according to data from NoRH, SSRT and Nançy radioheliographs. The flux was measured with the use of the method described in the Section 2. Vertical lines in Figure 3a are placed on leading edges of SW streams; those in Figure 3 (b-e), on leading edges of increments/decrements of microwave flux at 4 frequencies. The increased microwave emission flux is related to CH at 17 GHz, whereas the decreased microwave emission flux is related to it at 5.7 GHz and 327 MHz. At 150.9 MHz, there is no evidence of an increased or decreased microwave emission flux. Its magnitude is comparable to the flux of neighbouring regions of the solar atmosphere (Figure 3b). Many authors [Dulk, Sheridan (1974), Trottet, Lantos (1978), Kosugi et al. (1986), Borovik et al. (1990), Chiuderi-Drago et al. (1999), Gopalswamy et al. (1999), Nindos et al. (1999), Krissinel et al. (2000), Moran et al. (2001), Maksimov et al. (2006)] indicated the increased microwave emission at frequencies near 17 GHz, the decreased microwave emission at frequencies below 5 GHz and above 150 MHz, and the drastic decrease in the CH contrast relative to the quiet Sun at frequencies below 150 MHz.
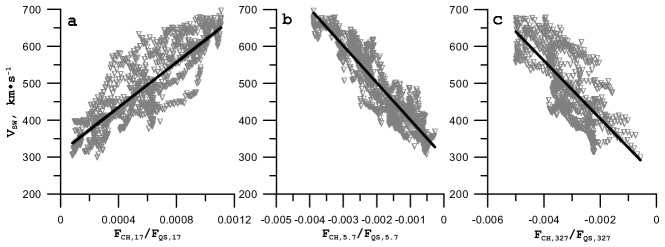
Nine CH were registered during the period under study; time of the SW stream arrival at the point L1 was taken into consideration (Figure 3), and microwave emission fluxes with SW velocities 350 were compared at 4 frequencies (Figure 4 a-c). The following dependences were obtained from the linear approximation of experimental data:
| (4) |
| (5) |
| (6) |
Observational data correspond to these dependences with correlation 0.69 at 17 GHz, 0.84 at 5.7 GHz, and 0.60 at 327 GHz. No reliable dependence was found for 150.9 MHz.
4 Discussion
When analysing experimental data in the previous section, we also examined probable connection between other SW parameters (, , ) and CH atmosphere characteristics (the microwave emission flux at 4 frequencies, the UV intensity, and its related ionic concentration ). No reliable relations was revealed. Probably these SW parameters are formed at other atmospheric levels of CH or in interplanetary space.
Among SW parameters under study, we found dependences only between its velocity at the point L1 and characteristics of the solar atmosphere emission in UV and in the microwave at 3 frequencies. Some authors (e.g., \openciteVrsnak07, Obridko09) have already called attention to the relation between SW stream speeds and some characteristics of the UV emission (for instance, the area) in CH. In this work, we established dependence of the SW velocity to the mean plasma concentration in CH and the microwave flux at 3 frequencies.
According to the linear dependencies (\irefEq-EIT-N), (\irefEq-MW-17), (\irefEq-MW-5.7), and (\irefEq-MW-327), all CH characteristics (, ), and the SW velocity are interrelated. Actually, the dependencies , , and obtained from (\irefEq-EIT-N), (\irefEq-MW-17), (\irefEq-MW-5.7) and (\irefEq-MW-327) form a parametric equation of line:
| (7) |
and all variables of this system are also linearly dependent. This result confirms linear dependence between brightness temperatures at 5.7 and 17 GHz in CH, revealed by \openciteMaksimov06. Notice that no dependence between the SW velocity and the microwave emission flux was found for 150.9 MHz at 4 frequencies. The microwave emission flux at this frequency is therefore linearly independent of the emission at other 3 frequencies and of the plasma concentration determined from the Fe XII =195Å line emission.
The solar atmosphere in quiet regions from the chromosphere to the corona is thought to be optically thin for the thermal free-free microwave emission. In this case, the brightness temperature is , where is the optical thickness, is the electron temperature. For the thermal free-free emission:
| (8) |
where is the microwave flux of CH at the frequency , is the electron concentration in CH, is the area of the emitting region, L is the thickness of the emitting layer, the Coulomb logarithm.
The exact height of the Fe XII =195Å line formation in CH is unknown. Though this line is considered to be coronal, CH limb observations show (according to SOHO EIT data) that the line intensity (and comparable values of plasma concentration in CH within the range from to ) is observed at heights less than 1 solar radius. This suggests that plasma concentration values in CH obtained in this work correspond to range of altitudes where the microwave emission is formed at 17 GHz (3000 km), 5.7 GHz (20 000 km), and 327 MHz (100 000–200 000 km). So we can expect that there will be a frequency or a range of frequencies whose formation altitudes would correspond to the Fe XII =195Å line emission altitude, and there may be a linear dependence for these frequencies between the emission flux from CH and the SW velocity. We can also expect that the height of 1 out of 3 frequencies considered in this work is close to the Fe XII =195Å line formation altitude.
However, there is a contradiction between the revealed linear dependence of the microwave emission flux (\irefEq-MW-Thin-Flux) on and formula (\irefEq-arr) where dependence is square-law for the optically thin CH atmosphere. This may be explained in two ways. The first explanation is that dependence is linear for the obtained range of . However, When substituting the concentration values measured in CH (see Figure 2b) into (8), we can easily find that dependence is not linear at 17, 5.7 GHz and 327 MHz, within the temperature range from the chromospheric to the coronal one. The second explanation is that there is a layer with an increased energy release at heights from the chromosphere to the corona. In this case, the atmosphere is optically thick for the microwave emission, i.e., , and the linear dependence between the microwave flux and plasma concentration is generated by energy release.
According to [Aihua et al. (1989)], such conditions correspond to the regions with decreased plasma concentration and open magnetic field - coronal holes, and energy is transferred by a wave flux, possibly by Alfven waves. Observations of CH at 17 GHz [Gopalswamy et al. (1999), Nindos et al. (1999)], where the brightness temperature of CH is higher than that of surrounding quiet regions, confirm energy release in the upper chromosphere and transition region. Besides, observations of CH at frequencies near 17 GHz also demonstrate an increased brightness temperature in CH [Gopalswamy et al. (1999), Nindos et al. (1999), Krissinel et al. (2000), Moran et al. (2001), Maksimov et al. (2006)]. The linear dependence between brightness temperatures at 5.7 and 17 GHz in CH [Maksimov et al. (2006)], on the assumption that there is a wave flux propagating from the lower solar atmosphere and dissipating in the chromosphere and transition region, explains relation between the increased emission in the chromosphere and transition region and the simultaneous cooling of the lower corona. If heating of the CH atmosphere is caused by dissipation of the wave flux, the more wave flux is dissipated in the lower solar atmosphere, the less energy is released in the upper solar atmosphere.
The connection between SW parameters and microwave emission established in this work provides a good reason to believe that heating of the solar atmosphere and acceleration of the high-speed SW are of similar nature. Some authors [Hollweg (1978), Tu et al. (1995), Tu et al. (2005), Suzuki, Inutsuka (2006)] think that acceleration of SW particles is caused by the energy transfer from the wave flux to them (for instance, due to the wave-particle resonance), and wave sources are in the lower solar atmosphere. According to data from the SUMER instrument on board SOHO, [Chae, Hle and Lemaire (1998)] found that the maximum value related to the wave flux is in the transition region. Measured velocities of matter in the polar CH are about 130-160 (already in the chromosphere and transition region) and up to 330 in the lower corona, according to data from the instruments EIS/Hinode and SUMER/SOHO [Gupta et al. (2010)]. This implies that the particle acceleration in the high-speed SW related to CH is observed already in the lower solar atmosphere, and connection of the SW velocity near the Earth’s orbit with the emission at these heights becomes clear.
Whatever SW acceleration mechanisms in CH are at altitudes of less than 1 solar radius, they have little or no effect at heights of more than 1 solar radius. This is confirmed by the absence of connection between the microwave emission flux in CH at 150.9 MHz and the velocity of the high-speed SW, whereas such a connection is in evidence at higher frequencies. The works \openciteDulk74, Chiuderi-Drago74, Trottet78, Chiuderi-Drago99 also show that CH at 150 MHz and below may not be visible on the quiet Sun background or slightly differ in brightness temperature from the temperature of the quiet Sun. Measurements of plasma velocity with UV coronal spectrographs may reveal whether SW particles at coronal heights are accelerated or not. However, no works on this issue have been written so far. We hope that they will appear due to data from new space observatories (e.g., SDO).
5 Summary
From the analysis of available experimental data, the following conclusions have been made:
1. Velocity of the high-speed SW during the period under study is related to the mean emission intensity of the Fe XII =195Å line (and the mean plasma concentration NCH determined from it) in CH.
2. The connection has been established between velocity of the high-speed SW and the CH microwave emission flux in the chromosphere and lower corona during the period under investigation.
3. The evidence we have found indicates existence of the common mechanism of the high-speed SW acceleration from the chromosphere to corona; it also proves existence of two different mechanisms of the high-speed SW acceleration at distances of less and more than one solar radius.
4. We have obtained evidence that there are common mechanisms of the coronal heating and the high-speed SW acceleration.
Acknowledgements
We are grateful to the team of observatories SOHO (instrument EIT), SSRT, Nobeyama and Nancay for providing free access to data that enabled this work.
References
- Aihua et al. (1989) Aihua, Z., Daxiong, F., Jianmin, W., Chunmei, L.: 1989, Adv. Space Res., 9(4), 33.
- Borovik et al. (1990) Borovik, V.N., Kurbanov, M.S., Livshits, M.A., Ryabov, B.I.: 1990, Soviet astr.(tr: Astronomicheskii Zhurnal), 34, (5), 522.
- Brosius et al. (2002) Brosius, J.W., Landi, E., Cook, J.W. et al.: 2002, ApJ, 574, 453.
- Chae, Hle and Lemaire (1998) Chae, J., Hle, U.S., Lemaire, P.: 1998, ApJ, 505, 957.
- Cranmer (2004) Cranmer, S.R.: 2004, In: R.W. Walsh, J. Ireland, D. Danesy, B. Fleck (eds.) Proceedings of the SOHO 15 Workshop - Coronal Heating (ESA SP-575), Paris: European Space Agency, 154.
- Chiuderi-Drago (1974) Chiuderi-Drago, F., Righini, G. (ed.): 1974, Skylab Solar Workshop: Oss. e Mem. Oss. Arcetri., 164, 242.
- Chiuderi-Drago et al. (1999) Chiuderi-Drago, F., Landi, E., Fludra, A., Kerdraon, A.: 1999, Space Sci. Rev., 87(1-2), 141.
- Dulk, Sheridan (1974) Dulk, G.A., Sheridan, K.V.: 1974, Sol. Phys., 36, 191.
- Eselevich (2009) Eselevich, V.G., Fainshtein, V.G., Rudenko, G.V. et al.:2009, Cosmic Research, 47, 95.
- Grall, Coles, and Klinglesmith (1996) Grall, R.R., Coles, Wm.A., Klinglesmith, M.T.:1996, in Proc. of the 8 international solar wind conference: Solar wind eight, AIP Conf. Proc., 382, 108.
- Gopalswamy et al. (1999) Gopalswamy, N., Shibasaki, K., Thompson, B.J. et al.: 1999, J. Geophys. Res., 104(A5), 9767.
- Grechnev et al. (2003) Grechnev, V.V., Lesovoi, S.V., Smolkov, G.Ya. et al.: 2003, Sol. Phys., 216(1), 239.
- Gringauz et al. (1962) Gringauz, K.I., Bezrukikh, V.V., Ozerov, V.D., Rybchinskii, R.E.: 1962, Planetary and Space Science, 9(3), 103. (First published: 1960, Doklady Academy of Sciences U.S.S.R., 131, 1301)
- Gupta et al. (2010) Gupta, G.R., Banerjee, D., Teriaca, L., Imada, S., Solanki, S.: 2010, ApJ, 718, 11.
- Hollweg (1978) Hollweg, J.V.: 1978, Rev. Geophis. and Space Phys., 16, 689.
- Hundhausen (1972) Hundhausen, A.J.: 1972, Coronal Expansion and Solar Wind, Berlin-Heidelberg-New York, Springer-Verlag.
- Kosugi et al. (1986) Kosugi, T., Ishiguro, M., Shibasaki, K.: 1986, PASJ, 38(1), 1.
- Krissinel et al. (2000) Krissinel, B.B., Kuznetsova, S.M., Maksimov, V.P., Prosovetsky, D.V. et al.: 2000, PASJ, 52, 909.
- Maksimov et al. (2004) Maksimov, V.P., Prosovetsky, D.V., Kuznetsova, S.M., Obukhov, A.G.: 2004, Solar-terrestrial physics, 6, 80.
- Maksimov et al. (2006) Maksimov, V.P., Prosovetsky, D.V., Grechnev, V.V., Krissinel, B.B., Shibasaki, K.: 2006, PASJ, 58(1), 1.
- Mercier, Klein, and Trottet (1988) Mercier, C., Klein, K.-L., Trottet, G.: 1988, Adv. Space Res., 8, 193.
- Moran et al. (2001) Moran, T., Gopalswamy, N., Dammasch, I.E., Wilhelm, K.A.: 2001, A&A, 378, 1037.
- Nakajima et al. (1994) Nakajima, H., Nishio, M., Enome, S., Shibasaki, K. et al.: 1994, Proc. IEEE, 82(5), 705.
- Neugebauer and Snyder (1966) Neugebauer, M., Snyder, C.W.: 1966, J. Geophys. Res., 71, 4469.
- Nindos et al. (1999) Nindos, A., Kundu, M.R., White, S.M.: 1999, ApJ, 527(1), 415.
- Obridko et al. (2009) Obridko, V.N., Shelting, B.D., Livshits, I.M., Asgarov, A.B.: 2009, Sol. Phys., 260, 191.
- Parker (1958) Parker, E.: 1958, ApJ, 128, 664.
- Ponomarev (1957) Ponomarev, E.A.: 1957, The theory of solar corona, PhD thesis, Kiev University publ.
- Sheeley et al. (1985) Sheeley, N.R.Jr., Howard, R.A., et al.: 1985, J. Geophys. Res., 90, 163.
- Shugai et al. (2009) Shugai, Yu.S., Veselovsky, I.S., Trichtchenko, L.D.: 2009, Geomagnetism and Aeronomy, 2009, 49(4), 41.
- Stepanian et al. (2008) Stepanian, N.N., Kuzin, S.V., Fainshtein, V.G. et al.: 2008, Solar System Research, 42(1), 83.
- Stone et al. (1998) Stone, E.C., Frandsen, A.M., Mewaldt, R.A., Christian, E.R., Margolies, D., Ormes, J.F., Snow, F.: 1998, Space Sci. Rev., 86, 1.
- Trottet, Lantos (1978) Trottet, G., Lantos, P.: 1978, A&A, 70, 245.
- Tu et al. (1995) Tu, C.-Yi, Zhou, C., Marsch, E.: 1995, Space Sci. Rev., 73, 1.
- Tu et al. (2005) Tu, C.-Yi; Zhou, C., Marsch, E. et al.: 2005, Science, 308, Issue 5721, 519.
- Vršnak et al. (2007) Vršnak, B., Temmer, M., Veronig, A.M.: 2007, Sol. Phys., 240(2), 315.
- Vsehvyatskiy et al. (1955) Vsehvyatskiy, S.K., Nikol’skiy, G.M., Ponomarev, E.A., Cherednichenko, V.I.: 1955, Astronomicheskii Zhurnal, 32(2), 165.
- Suzuki, Inutsuka (2006) Suzuki, T., Inutsuka, S.: 2006, ApJ, 632(1), L49.
- Wang, Sheeley (1990) Wang, Y.-M., Sheeley, N.R.Jr.: 1990, ApJ, 355,726.
- Wang et al. (1998) Wang, Y.-M., Sheeley, N.R., Walters, Jr.J.H. et al.: 1998, ApJ, 498, L165.
- Wilhelm et al. (1995) Wilhelm, K., et al.: 1995, Sol. Phys. 162, 189.