The most luminous stars
in the Galaxy and the Magellanic Clouds
Abstract: Some of the Wolf-Rayet (WR) stars are found to have very high bolometric luminosities (). We employ the Potsdam Wolf-Rayet (PoWR) model atmospheres for their spectral analysis, which yields the bolometric corrections. Distance and interstellar reddening also enter the luminosity estimates.
Among the Galactic stars, there is a group of very luminous WNL stars (i.e. WR stars of late subtype from nitrogen sequence with hydrogen being depleted in their atmospheres, but not absent). Their distances are often the major source of uncertainty. From K-band spectroscopy we found a very luminous star () in the Galactic center region, which we termed the Peony Star because of the form of its surrounding dusty nebula. A similar group of very luminous WNL stars is found in the Large Magellanic Cloud (LMC). In the Small Magellanic Cloud (SMC) the majority of WR stars resides in binary systems. The single WNL stars in the SMC are not very luminous.
We conclude that a significant number of very luminous WNL stars exist in the Galaxy and the LMC. With initial masses above 60 , they apparently evolved directly to the WNL stage without a prior excursion to the red side of the HRD. At the low metallicity of the SMC, the binary channel may be dominant for the formation of WR stars.
1 Introduction
Very luminous stars, with bolometric luminosities exceeding , appear spectroscopically mainly as Wolf-Rayet (WR) types. However, hot stars emit most of their radiation in the extreme ultraviolet which is not accessible to observation. Hence the determination of their luminosity must rely on adequate model atmospheres. Our “Potsdam Wolf-Rayet” code (PoWR – see Hamann & Gräfener 2003 and references therein) solves the non-LTE radiative transfer in a spherically symmetric expanding atmosphere. Detailed and complex model atoms are taken into account especially for H, He, and the CNO elements, while the iron-group elements are treated in the superlevel approximation. Wind inhomogeneities are accounted for in a first-order approximation (“microclumping”). The code has been applied mainly for the wind-dominated emission-line spectra of WR stars (see http://www.astro.physik.uni-potsdam.de/PoWR.html for grids of models), but can also be used for fitting photospheric absorption spectra. In the standard version of the PoWR code, mass-loss rate and velocity field are free parameters of the model, while they are determined consistently with the radiation pressure only in the hydrodynamical version (Gräfener & Hamann 2005, 2008). Another PoWR code option not used here is “macroclumping” (Oskinova et al. 2007).
2 How reliable are spectroscopic luminosities ?
In order to discuss the reliability of WR luminosities, we briefly describe the procedure of their spectroscopic determination. The first step is the fit of the normalized line spectrum. Spectra from stellar-wind models depend mainly on two parameters, the stellar temperature and the so-called “transformed radius” . The terminal wind velocity controls the widths of the profiles. Furthermore, the lines depend of course on the chemical abundance of their species.
The stellar temperature is the effective temperature related to the luminosity and the stellar radius via the Stefan-Boltzmann law. refers by definition to the point of the atmosphere where the Rosseland mean optical depth reaches 20.
The “transformed radius” is defined as Its name, historically coined by Schmutz et al. (1989), is actually misleading since has not the meaning (although the units) of a radius. More suggestive is to consider , which might be called a “normalized emission measure”. Being proportional to the volume integral of the density squared, divided by the stellar surface, scales with the emission from recombination lines normalized to the continuum. This explains why different combinations of , , and mass-loss rate result in approximately the same normalized WR emission-line strengths as long as (or ) is kept at the same value. ( is the clumping factor for which we assume throughout the work described here.)
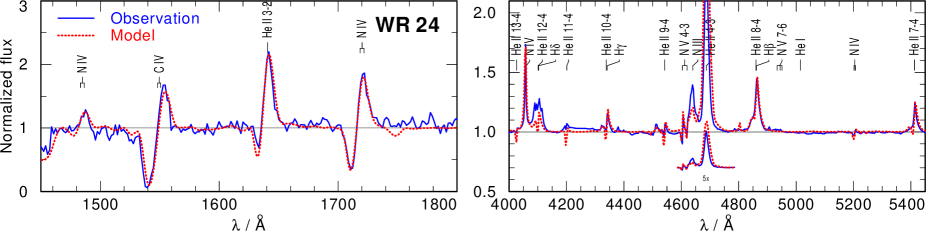
Taking advantage of this approximate parameter degeneracy, the analysis can start from models with an arbitrarily adopted luminosity (our grids are mostly calculated for ) and find the optimum fit of the normalized line spectrum by varying and (using models of adequate and chemical composition). The spectral fits that can be achieved are satisfactory (cf. Fig. 1), but also often leave characteristic discrepancies which we attribute mainly to deviations from wind symmetry and homogeneity. The fit parameters can be typically determined to an accuracy of in and in .
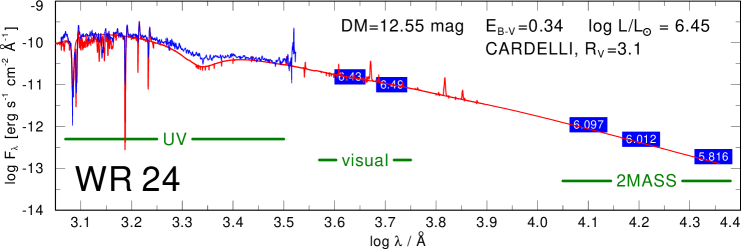
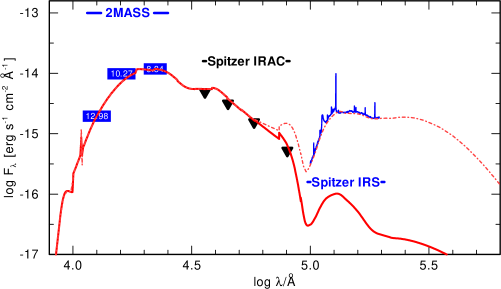
In a second step, the luminosity is determined from fitting the spectral energy distribution of the model observations (flux-calibrated spectra or photometry) over the widest available range (see Fig. 2). The slope and form of the model SED is fitted by adjusting the color excess , and by chosing an adequate reddening law (and its parameters). Sometimes the (circumstellar?) reddening is clearly anomalous, as demonstrated in the example of Fig. 2 by the weak 2200 Å feature. The absolute value is adjusted by scaling the model in luminosity (i.e. a vertical shift in the double logarithmic plot).
In order to discuss the error margins of the obtained luminosity, we consider . This absolute bolometric magnitude follows from the observed apparent magnitude in some band (where may stand for, e.g., the visual band , or for the near-IR band in case of visually obscured objects), by applying the bolometric correction and the extinction in the considered band, and the distance modulus (all in mag),
| (1) |
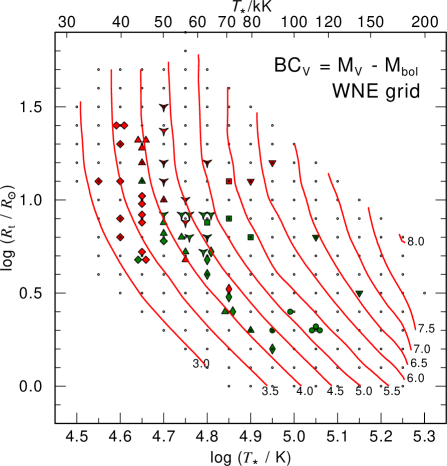
The bolometric correction is predicted by the model (see Fig. 3) and amounts to 3–5 mag for most WN stars, but can reach 6.5 mag for the hottest subtypes. Since the observed band lies in the Rayleigh-Jeans domain of the SED, the bolometric correction () scales roughly with . Hence a typical fit uncertainty of in propagates to mag in or in .
The extinction can introduce a noticeable error especially when it is high. If the available wavelength basis is as long as in the example shown in Fig. 2, the color excess can be determined from the spectral slope to a few hundreds of a magnitude. However, the extinction law itself can vary between different lines of sight. For the visual band, for instance, may deviate considerably from 3.1 as the Galactic standard value, which affects the visual extinction .
For Galactic WR stars, the largest uncertainty often comes from the distance. Only when a star can be assigned to an open cluster or association, we can adopt the distance of the latter. Stars in the Galactic Center, and especially objects in the LMC and SMC, have the clear advantage of a well-known distance.
Summarizing, the reliability of spectroscopically determined luminosities of WN stars depends very much on the individual circumstances. When the stellar temperature is well constrained from the line fit of different ions, the distance is known, and good photometry is available in spectral bands with not too high extinction, the error margins combine to in , typically.
3 Results
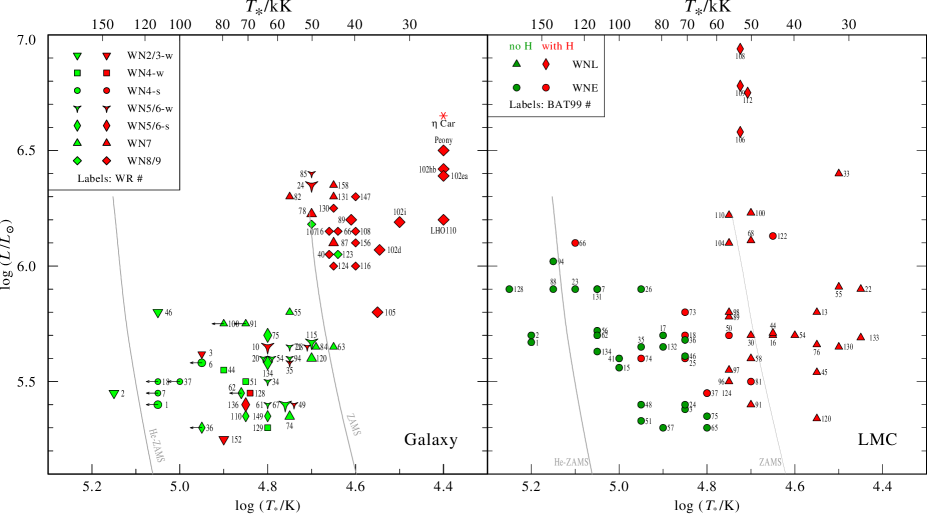
The empirical Hertzsprung-Russell-diagram (HRD) for the Galactic WN stars, analyzed with the methods described above, is displayed in Fig. 4 (left panel). Two groups of stars are clearly distinguished. The hydrogen-free stars, usually termed WNE (“E” for early subtypes), are pretty hot and located between the hydrogen and the helium main sequence. Their luminosities are between 5.3 and 5.8, typically. In contrast, the WNL (“L” for late subtypes) stars are less hot than the ZAMS and contain hydrogen. Most of them are very luminous (). They are not WR stars in the classical understanding, but rather very massive stars with strong winds which are still in the hydrogen-burning phase. However, for a couple of the WNL stars in this diagram the distance is actually not known (indicated by their smaller symbols). Their luminosity is basically adopted from similar stars of known distance. A couple of them might be in fact closer and less luminous.
Remarkable is the group of WNL stars from the Galactic center region. Being visually obscured, they have been analyzed only from their -band spectra. Nevertheless, we believe that their luminosities are reliable. Figure 5 shows the SED fit for the Peony star. In the band, the extinction amounts only to about 3 mag. The analysis (Barniske et al. 2008) revealed that this star has the second-highest luminosity ( = 6.5 0.2) known in the Galaxy, after Car.
In the LMC the group of very luminous WNL stars is less pronounced (Fig. 4, right panel). Instead there are many WNL stars with hydrogen, but moderate luminosities. It is not yet clear if we have missed such stars in the Galaxy because of the distance problem discussed above. The four extremely luminous stars represented in the figure by diamonds have been claimed recently by Crowther et al. (2010), and belong to the cluster R136 which we had avoided. The problem is to rule out accidental multiplicity in this very dense field of stars with identical spectral type.
The 12 WR stars (11 WN, 1 WO) known in the SMC are currently studied by Pasemann et al. (these proceedings, and in prep.). 5 of these stars appear to be single, while the remaining 6 are binaries for which we started to analyze the composite spectra. With the single WN stars are not “very” luminous.
4 Conclusions
A couple of very luminous stars () are found in the Galaxy and LMC. Apart from a few outstandingly bright LBVs, the most-luminous stars are of late WN type (WNL). Remarkable is the abundance of such stars in the Galactic center region. In the SMC, single WNL stars are also found despite of the low metallicity, but not with very high luminosities.
References
Barniske A., Oskinova L.M., Hamann W.-R., 2008, A&A, 486, 971
Crowther P.A., Schnurr O., Hirschi R., et al., 2010, MNRAS (in press)
Figer D.F., Najarro F., Morris M., et al., 1998, ApJ, 506, 384
Gräfener G., Hamann W.-R., 2005, A&A, 432, 633
Gräfener G., Hamann W.-R., 2008, A&A, 482, 945
Hamann W.-R., Gräfener G., 2003, A&A, 410, 993
Hamann W.-R., Gräfener G., Liermann A., 2006, A&A, 457, 1015
Liermann A., Hamann W.-R., Oskinova L.M., Todt H., Butler K., 2010, A&A, in press
Oskinova L. M., Hamann W.-R., Feldmeier A., 2007, A&A, 476, 1331
Schmutz W., Hamann W.-R., Wessolowski U., 1989, A&A, 210, 236