Intercalation of Few-Layer Graphite Flakes with FeCl3: Raman Determination of Fermi Level, Layer Decoupling and Stability
Abstract
We use anhydrous ferric chloride (FeCl3) to intercalate graphite flakes consisting of 2 to 4 graphene layers and to dope graphene monolayers. The intercalant, staging, stability and doping of the resulting intercalation compounds (ICs) are characterized by Raman scattering. The G peak of monolayer graphene heavily-doped by FeCl3 upshifts to1627cm-1. 2-4 layer ICs have similar upshifts, and a Lorentzian lineshape for the 2D band, indicating that each layer behaves as a decoupled heavily doped monolayer. By performing Raman measurement at different excitation energies we show that, for a given doping level, the 2D peak can be suppressed by Pauli blocking for laser energy below the doping level. Thus, multi-wavelength Raman spectroscopy allows a direct evaluation of the Fermi level, complementary to that derived by Raman measurements at excitation energies higher than the doping level. We estimate a Fermi level shift of0.9eV. These ICs are ideal test-beds for the physical and chemical properties of heavily-doped graphenes.
Graphite intercalation compounds (GICs) are host-guest systemsDresselhaus2002 ; Enoki2003 . They have been intensively studied because of novel features in their structures, electronic and optical propertiesDresselhaus2002 ; Enoki2003 ; Caswell1978 ; Underhill1979 ; Cheng2009 ; Gruneis2009a ; Gruneis2009b . They are promising for electrodes, conductors, superconductors, catalysts, hydrogen storage materials, batteries, displays, polarizersDresselhaus2002 ; Enoki2003 ; Caswell1978 ; Underhill1979 ; Pollak2010 ; Cheng2009 ; Gruneis2009a ; Pollak2010 . Since the first synthesis of GICs in 1841Schaffautl1841 , hundreds of GICs have been produced with a variety of donor and acceptors intercalantsDresselhaus2002 ; Enoki2003 . GICs featuring unique stacking sequences (staging) have also been intensively studiedDresselhaus2002 ; Enoki2003 ; Caswell1978 ; Underhill1979 . In stage 1 GICs, each graphene layer is sandwiched by two intercalant layersDresselhaus2002 ; Enoki2003 ; Caswell1978 ; Underhill1979 ; Gruneis2009a . However, it is difficult to manipulate and process traditional GICs into nanoelectronic devices due to their thicknessDresselhaus2002 ; Enoki2003 . Graphene has great potential in nanoelectronics and optoelectronicsGeim2007 ; Bonaccorso2010 . By intercalating graphite flakes just a few layers thick, one can combine the physical and chemical properties of GICs with those of few-layer graphenes (FLG) and open new opportunities for applications in nanoelectronicsDas2008 ; Das2009 ; Chen2008 ; Yan2009 ; Mak2009 ; Efetov2010 ; Pachoud2010 ; Ye2010 ; Gunes2010 ; Hass2008 . There is also great interest on the transport properties of graphene at high carrier density, both for applications and fundamental physicsDas2008 ; Das2009 ; Efetov2010 ; Pachoud2010 ; Ye2010 . By means of an electrolytic gate, Refs.Das2008, ,Das2009, ,Pachoud2010, doped graphene up to4.51013cm-2. Ref.Ye2010, used an ionic-liquid gate to achieve a carrier density higher than 1014cm-2. Ref.Efetov2010, achieved 41014cm-2 for hole and electron doping by means of solid polymer electrolyte. We note that in donor-type graphite intercalation compound, such as KC8, the electron density can reach up to4.81014cm-2, corresponding to Fermi shift of1.3eVDresselhaus2002 ; Gruneis2009a ; Gruneis2009b . There is thus scope for using a similar approach to achieve graphene doped at levels higher than those reported in Refs.Gruneis2009a, ; Das2008, ; Das2009, ; Efetov2010, ; Pachoud2010, ; Ye2010, .
Here, we use FeCl3 to intercalate FLG and dope single layer graphene (SLG). Raman spectroscopy at several wavelengths shows the formation of acceptor-type Stage-1 GICs. We estimate a Fermi shift of0.9eV, corresponding to a fractional charge transfer of1/6.6 = 0.152 holes per carbon atom, i.e., a hole density of5.81014cm-2.

Graphite flakes consisting of 1 to 4 layers (L) are obtained by micro-mechanical cleavage of natural graphite on a Si300nm SiO2 substrateNovoselov2005 . The number of layers is identified by optical contrastCasiraghi2007a ; Blake2007 and atomic force microscopy (AFM)Novoselov2005 , Figs.1a,b. The Raman spectra are taken at room temperature using a Jobin-Yvon HR800 system with a1.2cm-1 spectral resolution. Intercalation is performed following the vapor transport method commonly used in GICs, as discussed, e.g., in Ref.Dresselhaus2002, . The intended intercalant and the flakes are positioned in different zones in a glass ampoule, as shown in Fig.5b of Ref.Dresselhaus2002, , then pumped to 1.510-4Torr. The reaction is carried out at 613K for six and thirty hours, for FLG and bulk graphite, respectively. A longer time is needed to reach stage 1 GIC for bulk graphite, due to the sample size, both in spatial extent and thickness. Fig.1c is an optical micrograph of a representative intercalated flake. The number of layers can still be identified, and their optical contrast is higher than prior to intercalation.
In GICs only a few layers thick it is difficult to apply X-ray diffraction techniques, unlike for bulk GICs staging determinationDresselhaus2002 ; Enoki2003 ; Caswell1978 ; Underhill1979 , because of the small flake thickness and the resulting substrate effects. Raman scattering was used to distinguish the intercalation and adsorption behavior of Bromine (Br2), Iodine (I2), FeCl3 and sulfuric acidJung2009 ; Zhan2010 ; Zhao2010 . In principle, for stage-1 GICs, a single G peak is expectedDresselhaus2002 ; Enoki2003 ; Caswell1978 ; Underhill1979 . However, multiple G peaks were reported in recent worksZhan2010 .
The Raman spectrum of graphene consists of a set of distinct peaks. The G and D appear around 1580 and 1350cm-1, respectively. The G peak corresponds to the E2g phonon at the Brillouin zone center. The D peak is due to the breathing modes of six-atom rings and requires a defect for its activationFerrari2000a ; Tuinstra1970 ; Thomsen2000 . It comes from TO phonons around the K pointFerrari2000a ; Tuinstra1970 ; Ferrari2000b , is active by double resonance (DR)Thomsen2000 , and strongly dispersive with excitation energy due to a Kohn Anomaly at KPiscanec2004 . DR can also happen intra-valley, i.e. connecting two points belonging to the same cone around K (or K′)Saito2002 ; Tan2002 . This gives the so-called D′ peak, which is at1620cm-1 in defected graphite measured at 514nmTan2001 . The 2D peak is the second order of the D peak. This is a single peak in SLG, whereas it splits in four in bilayer graphene (BLG), reflecting the evolution of the band structureFerrari2006 . Raman spectroscopy allows monitoring of doping, defects, strain, disorder, chemical modifications, edges, and relative orientation of the graphene layersDas2008 ; Das2009 ; Ferrari2000a ; Piscanec2004 ; Ferrari2006 ; Pisana2007 ; Mohiuddin2009 ; Ferrari2007 ; Elias2009 ; Casiraghi2007b ; Casiraghi2009 ; Yan2007 ; Yan2008 ; Graf2007 . Each Raman peak is characterized by its position, width, height, and area. The frequency-integrated area under each peak represents the probability of the whole processBasko2009 . We thus consider both area, A(2D)/A(G), and height, I(2D)/I(G), ratios.
The G peak position, Pos(G), has been widely used to identify stagingDresselhaus2002 ; Enoki2003 ; Caswell1978 ; Underhill1979 . In graphene, the shift of the Fermi energy has two major effects: (1) a change of the equilibrium lattice parameter with a consequent stiffening/softening of the phononsDas2008 ; Das2009 ; Pietronero1981 , and (2) the onset of effects beyond the adiabatic Born-Oppenheimer approximation, that modify the phonon dispersion close to the Kohn anomaliesDas2008 ; Das2009 ; Piscanec2004 ; Pisana2007 ; Basko2009 ; Basko2008 ; Lazzeri2006 . (2) always results in a G upshift, both for electron and hole dopingPiscanec2004 ; Pisana2007 , while (1) gives an upshift for doping and a downshift for doping. Thus for low doping levels, below31013cm-2, both and doping result in G peak upshiftsDas2008 ; Das2009 ; Piscanec2004 ; Pisana2007 ; Lazzeri2006 , but for levels above31013 cm-2 the doped case reversesLazzeri2006 . In fact, for doping1014cm-2 the G shift would revert to zeroLazzeri2006 . Doping also significantly affects the 2D peak intensity. Ref. Basko2009, reported that, for excitation energy well above the Fermi energy, this is linked to A(2D)/A(G) as:
| (1) |
where , , , and are the scattering rate due to the emission of phonons, Fermi energy, electron charge, electron velocity and dielectric constantBasko2009 .
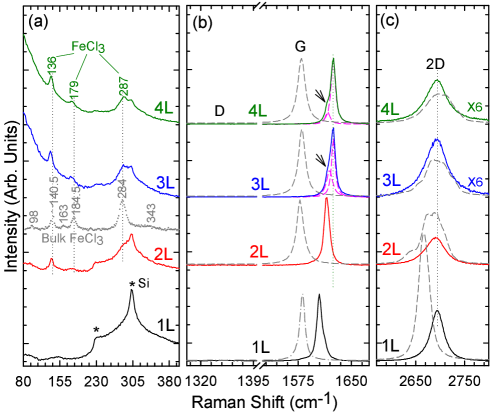
FeCl3 has eight Raman-active modes 4Ag+4Eg (2A1g+2A2g+4Eg)Caswell1978 . Six Raman modes (3Ag+3Eg) were thus far experimentally measuredCaswell1978 . When FeCl3 was used as intercalant in stage 1 GICs, only four Raman modes (2A1g+2Eg) were observedCaswell1978 . The other two Ag and Eg modes at164 and 354cm-1 are probably too weak to be observed in GICs. Indeed, even in crystal FeCl3, those modes are very weakCaswell1978 . Fig. 2a shows that, after doping by FeCl3, three Raman modes from FeCl3 are observed in the low frequency region: A1g136cm-1, Eg179cm-1 and A1g287cm-1. We cannot detect the other Eg mode93cm-1, since this is too weak to be distinguished from the background. These peaks positions are very close to those previously observed for FeCl3 intercalated Stage-1 GICsDresselhaus2002 ; Enoki2003 ; Caswell1978 , but differ from bulk crystalline FeCl3, whose spectrum is also shown in Fig.2a for comparison: the A1g (at 136cm-1) and Eg mode (at 179cm-1) have a4cm-1 downshift, while the A1g (at 287cm-1) upshifts3cm-1. In bulk FeCl3, the iron layer is sandwiched by two chlorine layers, as shown in Fig.1 of Ref.Caswell1978, . When intercalation happens, Cl atoms simultaneously occupy preferred sites associated with the graphene lattice, which results in the loss of the Cl atoms long-range two dimensional order, because their in-plane structure is incommensurate with the graphene host latticeDresselhaus2002 ; Caswell1978 . Fe atoms however retain the long-range order as in crystal FeCl3Dresselhaus2002 ; Caswell1978 . This results in a3o relative rotation of the Cl layers above and below the Fe layer, and a difference of the Raman modes of intercalated FeCl3 compared to bulkFeCl3Dresselhaus2002 ; Caswell1978 . FeCl3 modes are not observed in the FeCl3-doped SLG due to the very low density of FeCl3, compared to fully- FeCl3-intercalated GICs, due to de-adsorption.
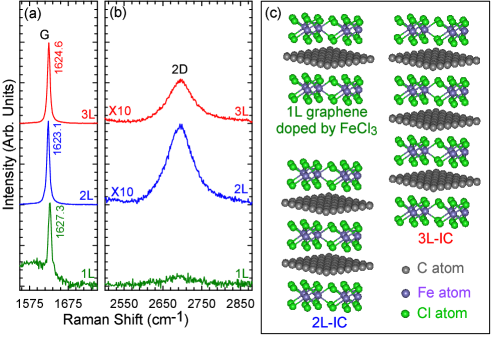
Figure 2 plots the Raman spectra of 1-4L flakes measured at 532nm before (dashed lines) and after (solid lines) FeCl3 intercalation. The pristine samples have the characteristic features of mono- and multi-layer grapheneFerrari2006 ; Ferrari2007 . The Pos(G) shift of doped/intercalated samples compared to pristine ones in Fig.2b is a signature of doping. The blueshift is smaller in SLG compared to FLG. This indicates fewer FeCl3 molecules on SLG relative to 2-4L flakes. The SLG 2D band in Fig.2c upshifts28cm-1, typical of hole-dopingDas2008 ; Das2009 , while I(2D)/I(G) and A(2D)/A(G) decrease61% and 53% relative to those prior to doping. From Refs.Das2009, ; Basko2009, , we estimate the Fermi shift for SLG to be0.4eV.
The 2D lineshape for the 2-4L flakes after FeCl3 intercalation changes significantly, as shown in Fig.2c, from multiple peaks to a single Lorentzian. This is an indication of electronic decoupling of the layersFerrari2006 ; Ferrari2007 . Note that the residual presence of any non-intercalated BLG or FLG would give residual multiple 2D bands. In pristine Bernal-stacked graphite, the interlayer distance is 3.35Dresselhaus2002 ; Enoki2003 . When FeCl3 molecules are intercalated, the distance increases to 9.37Dresselhaus2002 ; Enoki2003 ; Caswell1978 ; Underhill1979 . As a result, the interlayer interaction significantly decreasesDresselhaus2002 ; Enoki2003 ; Gruneis2009a . Therefore, the single Lorentzian 2D peak indicates SLG between two intercalant layers, each hole-doped.
As shown in Fig.2b, the G bands of SLG and BLG are1605 and1615cm-1, moving to1625cm-1 for 3L and 4L. The latter value is close to that previously reported in FeCl3 Stage-1 GICs (1626cm-1)Dresselhaus2002 ; Enoki2003 ; Caswell1978 ; Underhill1979 . For 3L and 4L, an additional sideband appears1618cm-1, with almost equal width to the main peak. One might assign it as the D′ peak activated by defects. However, this is not the case for our samples since the D peak is unobservable for all the layers, before and after doping/intercalation, Fig.2b. This band is thus another G peak, resulting from non-uniform intercalation, due to de-adsorption1 of FeCl3 when the flakes are exposed to air. This would imply that the shoulder is due to the upper or lower layers. The thicker the flakes, the less the top and bottom layers will contribute to the overall intensity of the measured Raman spectrum. Indeed, 4L flakes have weaker relative intensity of this shoulder compared to the main G peak, than 3L flakes. No such shoulder is expected in SLG, where the lower Pos(G) is an indication of lower coverage. We note that no shoulder is observed for the doped/intercalated BLG, indicative of homogenous doping. Let us consider the upper and lower layers of intercalated 2-4L flakes. If FeCl3 is only present on one side of these layers, we expect the amount of charge transfer to reach at most that of Stage-2 GICs. In this case Pos(G) can only shift to1612cm-1, i.e. Pos(G) of FeCl3-intercalated Stage-2 GICsDresselhaus2002 ; Enoki2003 ; Caswell1978 ; Underhill1979 . Pos(G) of our FeCl3-doped SLG is very close to that reported in Ref.Zhan2010, , where double G peaks, at1612 and1623cm-1 were also observed for 3 and 4L samples. Ref.Zhan2010, explained this by arguing that FeCl3 did not adsorb on the top and bottom of their flakes. We note that Pos(G) of our intercalated BLG after air exposure (1615cm-1) and of the lower energy G band in 3-4L FeCl3-intercalated flakes are higher than previously reported for FeCl3 intercalated Stage 2 GICsDresselhaus2002 ; Enoki2003 ; Caswell1978 ; Underhill1979 . This means that the upper and lower surfaces of our FeCl3-intercalated 2-4L are doped, but not with full coverage, due to FeCl3 de-adsorption, unlike the interior layers. The lower Pos(G) in FeCl3-intercalated BLG compared to 3 and 4L is expected, since a BLG has no fully enclosed SLG, thus de-adsorption effects are expected to be stronger.
If the samples are quickly removed from the sealed tube and cooled to room temperature in air, their Raman spectra are very similar to those previously reported for Stage-1 GICsDresselhaus2002 ; Enoki2003 ; Caswell1978 ; Underhill1979 . Fig.3a shows Pos(G) of intercalated 2 and 3L1623 and 1625cm-1, very close to that of Stage-1 GICsDresselhaus2002 ; Enoki2003 ; Caswell1978 ; Underhill1979 . However, when measuring in-situ the SLG Raman spectrum, i.e. keeping the sample sealed in a quartz tube after cooling at room temperature following a 30 minutes doping, Pos(G) reaches1627cm-1, indicative of heavy doping. This is slightly higher than previously reported for Stage-1 GICsDresselhaus2002 ; Enoki2003 ; Caswell1978 ; Underhill1979 , and much higher than Stage-2 GICsDresselhaus2002 ; Enoki2003 ; Caswell1978 ; Underhill1979 . This is thus evidence of doping on both top and bottom surfaces of our SLG. When this sample is removed from the tube and exposed to air, Pos(G) goes to1605cm-1, similar to Fig.2, due to desorption. Figs.3a,b show that Pos(G) for BLG is lower than in 3L, and I(2D)/I(G) for BLG stronger than 3L. This suggests de-intercalation in BLG flakes.
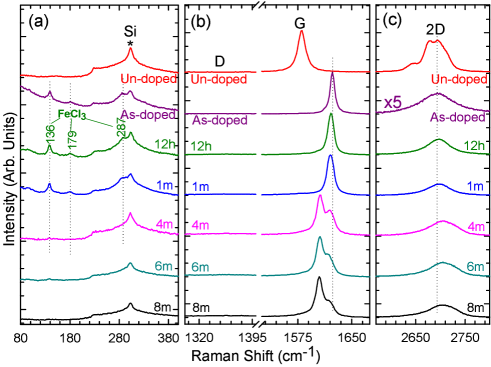
To further study the de-adsorption/de-intercalation, Figs.4a-c report the BLG Raman spectra as a function of time for a period of up to 8 months. Pos(G) starts at1623cm-1, and can be fitted with a single Lorentzian with FWHM(G)8cm-1, indicating uniform dopingDas2008 ; Das2009 ; Pisana2007 ; Casiraghi2007b . After twelve hours, Pos(G) decreases to1621cm-1, and FWHM(G) increases to10cm-1. After one month, Pos(G)1620cm-1 and FWHM(G)12cm-1. The spectrum evolution indicates that FeCl3-intercalated flakes are relatively stable in air at room temperature for up to one month. The intercalant Raman modes change little within one month. However, after four months, they are not seen anymore, while G and 2D acquire a multiple peak profile. This confirms that a significant reduction in doping occurs after one month due to de-adsorption and de-intercalation. The multiple G peaks after 4 months may result from different de-adsorption rates on different surfaces.
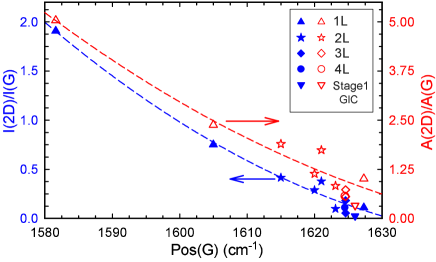
Figure 5 plots I(2D)/I(G) and A(2D)/A(G) as a function of Pos(G). With increasing Pos(G), i.e. increasing doping, I(2D)/I(G) and A(2D)/A(G) both decrease. I(2D)/I(G) and A(2D)/A(G) of heavily doped SLG are close to those of almost fully-doped 2 and 3L, further confirming double-surface doping.
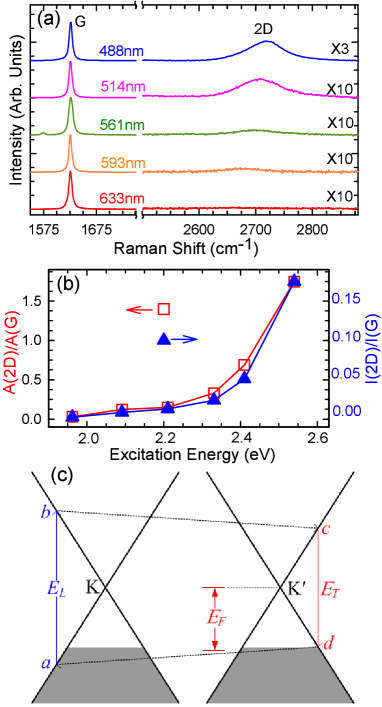
We now consider the dependence of I(2D)/I(G) and A(2G)/A(G) on doping and excitation wavelength. We use a FeCl3-intercalated Stage-1 GIC as an example to show how to probe the Fermi level by multi-wavelength Raman spectroscopy, since in this case the Fermi level is well know by independent characterizationsDresselhaus2002 . Fig.6a plots the Raman spectra measured at 488, 514, 561, 593 and 633nm. These are similar to those in Fig.3. For all lasers Pos(G)1626cm-1,FWHM(G)7cm-1, in good agreement with that previously reported for FeCl3-intercalated Stage-1 GICsDresselhaus2002 ; Enoki2003 ; Caswell1978 ; Underhill1979 . At 633nm, the 2D peak is almost unobservable, similarly to what reported in Ref.Jung2009, for SLGs doped by bromine. However, increasing the excitation energy from 2.09eV (593nm) to 2.54eV (488nm), the 2D peak appears. A(2D)/A(G) and I(2D)/I(G) are plotted as a function of excitation energy in Fig.6b. The trend of these intensity ratios can be understood considering the full resonant Raman scattering process for the 2D bandBasko2009 ; Basko2008 . Fig.6c plots the doped SLG band structure. For a given laser energy, to activate the 2D peak an electron-hole pair must be excited in process: ab, and recombined in process cd. These transitions differ by the 2D peak energy:
| (2) |
There are three cases 1) When and are both larger than 2, the 2D band can be always observed; 2) When is larger than 2 , but is smaller than 2, process cd is forbidden due to Pauli blocking; 3) when both and are smaller than 2, both processes ab and cd are forbidden. Therefore, only when 2, i.e., (-)/2, the 2D band is observable. Thus, the absence of the 2D band in the Raman spectra of FeCl3-intercalated Stage-1 GICs, and FeCl3 and Br2 heavily-doped SLGsJung2009 at 1.96eV (632.8nm) indicates that their is larger than 0.81eV. When (-)/2, both I(2D)/I(G) and A(2D)/A(G) should increase. Thus, the sharp intensity increase when moving from 2.21eV (561nm) to 2.09eV (593nm), implies that corresponding to EL=2.09eV is close to 2. Then, 0.88eV, close to that measured in Stage-1 GICs by electron energy loss spectroscopyDresselhaus2002 .
can be also estimated from A(G)/A(2D) at 514nm, by using Eq.1. The numerical values of can be taken from Fig.3 in Ref.Basko2009, , and =21meV can be extracted from the hole-doping data of Ref.Das2009, measured at 514nm. While is not available for intercalated FeCl3, we can estimate it from that measured for FeCl3 in aqueous solutionsS1 . This gives =0.0908. Then, inserting A(2D)/A(G)=0.688 in Eq.1, gives E0.84eV, very close to that derived by the intensity transition as a function of excitation energy.
In conclusion, graphite flakes consisting of a few graphene layers can be doped by adsorption and intercalation of FeCl3. This results in each of the layers behaving as a hole-doped SLG. These are stable up to one month after air exposure. The variation of the 2D intensity relative to the G peak with excitation energy allows one to estimate the Fermi energy. We get 0.9eV, corresponding to a fractional charge transfer of1/6.6=0.152 holes per carbon, i.e.5.81014cm-2, larger than the 41014cm-2 recently reported by employing a solid polymer electrolyte gateEfetov2010 .
Acknowledgments. This work was supported by the National Natural Science Foundation of China under Grant Nos. 10934007 and 10874177, and the special funds for the Major State Basic Research under Contract No. 2009CB929300 of China. ACF acknowledges funding from ERC grant NANOPOTS, EPSRC grant EP/G042357/1, Royal Society Wolfson Research Merit Award, EU grants RODIN and GENIUS.
References
- (1) M.S.Dresselhaus,G.Dresselhaus,Adv. Phys. 51,1 (2002)
- (2) T. Enoki, M. Suzuki, M. Endo, Graphite intercalation compounds and applications. Oxford, (2003)
- (3) N. Caswell, S. A. Solin, Solid State Comm. 27 961 (1978)
- (4) C. Underhill et al., Solid State Comm. 29, 769(1979).
- (5) H. S. Cheng et al., J. Am. Chem. Soc. 131, 17732(2009).
- (6) A. Gruneis et al., Phys. Rev. B 79, 205106 (2009).
- (7) A. Gruneis et al., Phys. Rev. B 80, 075431 (2009).
- (8) E. Pollak et al., Nano Lett. 10, 3386 (2010).
- (9) P. Schaffautl, J. prakt. Chem. 21, 155 (1841).
- (10) A. K. Geim, K. S. Novoselov, Nat. Mater. 6, 183 (2007).
- (11) F. Bonaccorso et al., Nat. Photonics 4, 611 (2010).
- (12) A. Das et al., Nat. Nanotechnol. 3, 210 (2008).
- (13) A. Das et al., Phys. Rev. B 79, 155417 (2009).
- (14) J. H. Chen et al., Nat. Nanotechnol. 3, 206 (2008).
- (15) J. Yan et al., Phys. Rev. B 80, 241417 (2009).
- (16) K. F. Mak et al., Phys. Rev. Lett. 102, 256405 (2009).
- (17) D. K. Efetov, and P. Kim, ArXiv:1009.2988v1 2010.
- (18) A. Pachoud et al., ArXiv:1009.3367v1 2010.
- (19) J. T. Ye et al., ArXiv:1010.4679v1 2010.
- (20) F. Gunes et al., Acs Nano 4, 4595 (2010).
- (21) J. Hass et al., Phys. Rev. Lett. 100, 125504 (2008).
- (22) K. S. Novoselov et al., PNAS 102, 10451 (2005).
- (23) C. Casiraghi et al., Nano Lett. 7, 2711 (2007).
- (24) P. Blake et al., Appl. Phys. Lett. 91, 063124 (2007).
- (25) N. Jung et al., Nano Lett. 9, 4133 (2009).
- (26) D. Zhan et al., Adv. Funct. Mater. 20, 3504 (2010).
- (27) W. J. Zhao et al., Phys. Rev. B 2010, to be published.
- (28) A.C.Ferrari,J.Robertson,Phys. Rev. B 61,14095 (2000)
- (29) F. Tuinstra,J. L. Koenig, J. Chem. Phys. 53, 1126 (1970).
- (30) C. Thomsen,S. Reich,Phys. Rev. Lett. 85,5214 (2000)
- (31) A. C. Ferrari et al., Phys. Rev. B 62, 11089 (2000).
- (32) S. Piscanec et al., Phys. Rev. Lett. 93, 185503 (2004).
- (33) R. Saito et al., Phys. Rev. Lett. 88, 027401 (2002).
- (34) P. H. Tan et al., Phys. Rev. B 66, 245410 (2002).
- (35) P. H. Tan et al., Phys. Rev. B 64, 214301 (2001).
- (36) A. C. Ferrari et al., Phys. Rev. Lett. 97, 187401 (2006).
- (37) S. Pisana et al., Nat. Mater. 6, 198 (2007).
- (38) T.M.G.Mohiuddin et al.,Phys. Rev. B 79, 205433 (2009)
- (39) A. C. Ferrari, Solid State Commun. 143, 47 (2007).
- (40) D. C. Elias et al., Science 323, 610 (2009).
- (41) C. Casiraghi et al., Appl. Phys. Lett. 91, 233108 (2007).
- (42) C. Casiraghi et al., Nano Lett. 9, 1433 (2009).
- (43) J. Yan et al., Phys. Rev. Lett. 98, 166802 (2007).
- (44) J. Yan et al., Phys. Rev. Lett. 101, 136804 (2008).
- (45) D. Graf et al., Nano Lett. 7, 238 (2007).
- (46) D. M. Basko, S. Piscanec, A. C. Ferrari, Phys. Rev. B 80, 165413 (2009).
- (47) L.Pietronero,S.Strassler, Phys. Rev. Lett.47, 593 (1981)
- (48) D. M. Basko, Phys. Rev. B 78, 125418 (2008).
- (49) M.Lazzeri,F.Mauri,Phys. Rev. Lett. 97,266407 (2006)
- (50) S. Latil et al. Phys. Rev. B 76, 201402 (2007).
- (51) N. A. El-Shistawi, M. A. Hamada and E. A. Gomaa, Chemistry 18, 5 (2009).