11email: podio@astro.rug.nl 22institutetext: Thüringer Landessternwarte Tautenburg, Sternwarte 5, D-07778 Tautenburg, Germany
22email: jochen@tls-tautenburg.de 33institutetext: Ulugh Beg Astronomical Institute, Astronomical str. 33, 700052 Tashkent, Uzbekistan
33email: stas@astrin.uzsci.net 44institutetext: Institute for Astronomy, University of Hawaii, 640 N. Aohoku Place, Hilo, HI 96720, USA
44email: hodapp@ifa.hawaii.edu 55institutetext: INAF - Osservatorio Astrofisico di Arcetri, Largo Enrico Fermi 5, 50125 Firenze, Italy
55email: fran@arcetri.astro.it
Tracing kinematical and physical asymmetries
in the jet from DG Tau B
Abstract
Context. Stellar jets from young stars can be highly asymmetric and have multiple velocity components.
Aims. To clarify the origin of jet asymmetries and constrain the launch mechanism we study, as a test case, the physical and kinematical structure of the prototypical asymmetric flow emitted by DG Tau B.
Methods. The analysis of deep, high spectral resolution observations taken at the KECK telescope allows us to infer the properties and the spatial distribution of the velocity components in the two jet lobes. From selected line ratios we derive the gas physical conditions (the electron and total density, ne and nH, the ionisation fraction, xe, and the temperature, Te), as a function of both distance from the source and gas velocity. The presence of dust grains in the jet is investigated by estimating the gas-phase abundance of calcium with respect to its solar value.
Results. The detected lines show broad velocity profiles at the base of the jet (up to 100 km s-1) where up to three velocity components are detected. At 5′′ from the source, however, only the denser and more excited high velocity components survive and the lines are narrower (10-30 km s-1). The jet is strongly asymmetric both in velocity and in its physical structure. The red lobe, which is slower (140 km s-1) and more collimated (opening angle: 3-4∘), presents low ionisation fractions (xe0.1-0.4) and temperatures (Te5 103 K), while the total density is up to 2.5 104 cm-3. The blue lobe, faster (-320 km s-1) and less collimated (14∘), is also less dense (nH1 104 cm-3) but highly excited (Te up to 5 104 K and xe up to 0.9). The estimated mass loss rate turns out to be similar in the two lobes (6-8 10-9 M⊙ yr-1 ), while the flux of linear momentum is 3 times higher in the blue one (2.5 10-7 M⊙ yr-1 km s-1). Calcium is strongly depleted with respect to its solar abundance, indicating that the jet contains dust grains. The depletion is lower for higher velocities, consistent with dust destruction by shocks.
Conclusions. The similar mass loss rate in the two lobes suggests that the ejection power is comparable on the two sides of the system, as expected from a magneto-centrifugal ejection mechanism, and that the observed asymmetries are due to different mass load and propagation properties in an inhomogeneous environment. The presence of dust grains implies that the jet is generated from a region of the disk extending beyond the dust sublimation radius.
Key Words.:
ISM: jets and outflows – Herbig-Haro objects – dust, extinction – Stars: formation1 Introduction
Stellar jets from young stellar objects (YSO) play a key role in the star formation process and a wealth of information can be derived analysing their characteristic emission line spectra. The observed lines are collisionally excited in the shock waves generated by the interaction of the jet material with the interstellar medium or previously ejected matter and contain important information on the gas physics/kinematics. Different methods have been proposed to derive the physical conditions of the gas propagating in the jets from emission line ratios, such as the comparison with the predictions of a grid of shock models (e.g., Raga & Böhm 1986; Hartigan et al. 1994), or, alternatively, spectral diagnostics techniques (e.g., Bacciotti & Eislöffel 1999, hereafter referred to as the BE technique).
The application of these methods to analyse emission lines allows one to derive the jet structure on different scales, depending on the angular resolution of the observations: from parsec scales to hundreds of AU (Hartigan et al. 1994; Bacciotti & Eislöffel 1999; Podio et al. 2006), and down to 15 AU from the emitting source with space or Adaptive Optics-assisted observations (Lavalley-Fouquet et al. 2000; Bacciotti et al. 2000; Woitas et al. 2002; Hartigan & Morse 2007; Melnikov et al. 2009). In particular, the analysis of emission lines can shed light on the gas conditions at the base of the flow and on the mechanism that generates it. Proposed magneto hydro-dynamical (MHD) models suggest that the wind is accelerated and collimated by magneto-centrifugal forces. It is not clear, however, where the jet originates: from the star itself (Sauty & Tsinganos 1994), from the radius at which the stellar magnetosphere truncates the disk (X wind, Shu et al. 2000), or from an extended region of the disk (Disk wind, Königl & Pudritz 2000).
In addition to the uncertainty on the launch mechanism, other observed properties still lack a proper modeling. For example, velocity resolved observations of the jets from T Tauri stars and younger Class 0/I protostars show that these can be highly asymmetric and can have different velocity components (Hamann 1994; Hirth et al. 1994, 1997; Davis et al. 2001; Garcia Lopez et al. 2008, 2010). Despite some attempts to explain these observational features by means of the existing MHD models (e.g., Pesenti et al. 2003; Ferreira et al. 2006) their origin is still unclear. A viable possibility to clarify these aspects is to investigate the variation of the jet physical properties in asymmetric jets and in different velocity channels, as it has been attempted in recent works conducted at moderate and high spatial/spectral resolution (Lavalley-Fouquet et al. 2000; Woitas et al. 2002; Coffey et al. 2008; Garcia Lopez et al. 2008, 2010; Melnikov et al. 2009; Podio et al. 2009).
Another interesting issue, which remains not fully clarified, is the dust content of jets. Refractory species such as Ca, Ni, Cr, Fe, are often locked onto dust grains, thus a strong depletion of their gas phase abundance is expected in the interstellar medium (ISM) (Savage & Sembach 1996). A few studies have investigated the gas phase abundance of Fe and Ni in HH jets (Beck-Winchatz et al. 1994, 1996; Mouri & Taniguchi 2000; Böhm & Matt 2001; Nisini et al. 2002) and only recently the analysis has been extended to other refractory species such as Si, Ca, C, Cr, and Ti (Nisini et al. 2005, 2007; Cabrit et al. 2007; Podio et al. 2006, 2009; Garcia Lopez et al. 2008). These studies showed that the refractory species may be depleted up to 90% in HH jets and molecular outflows, thus suggesting the presence of dust grains in the ejected material. This in turn can put constraints on the region of the disk from where jets originate. In fact the stellar radiation destroys dust grains in the disk up to the so called dust evaporation radius, Revp. This is located between 0.03 and 1.5 AU from the star in T Tauri and Herbig Ae/Be stars depending on the stellar luminosity and the dust properties (Isella & Natta 2005; Akeson et al. 2005; Eisner et al. 2007), but no direct observations and/or modeling of the inner disk structure are available for younger Class 0/I sources, still surrounded by circumstellar matter. In general, we expect that a ‘dusty’ jet can only arise from a region in the disk extended beyond Revp. The passage through a shock front, however, can destroy part of the dust grains which may be transported in the jet, complicating the picture (e.g., May et al. 2000; Guillet et al. 2009). Therefore, accurate studies of the gas-phase abundance of refractory species are necessary to determine the dust content in the jet and to constrain the shock efficiency in destroying the dust grains.
To improve our understanding of the physics of HH jets from YSO, particularly their launch mechanism, we investigate the physical and kinematical structure of the HH 159 jet emitted by the young source DG Tau B, focusing on the analysis of the velocity components detected at its base, the asymmetry between the two jet lobes, and, finally, the estimate of the dust content in the jet.
HH 159 is a bipolar jet, first detected by Mundt & Fried (1983). The red lobe consists of a chain of bright knots extending to 55′′ from the source, while the blue lobe, fainter and less collimated, is detected only up to 10′′ from the source (Mundt et al. 1991; Eislöffel & Mundt 1998). A large molecular outflow spatially coincident with the redshifted optical jet has been detected in the CO lines by Mitchell et al. (1994, 1997). The driving star, DG Tau B, has been classified as a Class I source based on its spectral energy distribution (Watson et al. 2004; Luhman et al. 2010) and at optical wavelengths it is obscured by circumstellar optically thick material detected in absorption through broadband imaging with the Hubble Space Telescope (HST) (Stapelfeldt et al. 1997). The observed dark lane, elongated and perpendicular to the jet, indicates the presence of a circumstellar disk, confirmed by 13CO millimeter observations (Padgett et al. 1999, 2000), and flattened residual envelope. The source position has been determined from 3.5 cm VLA radio continuum observations by Rodriguez et al. (1995), who locate it within the observed dark lane. Further HST studies in the near-infrared indicated the presence of a bipolar reflection nebula, whose axis of symmetry is coincident with the axis of the optical jet (Padgett et al. 1999). The eastern lobe of the nebula, surrounding the blue jet lobe, is V-shaped, suggesting that the nebula traces the walls of the blueshifted outflow cavity. The western lobe is fainter and more collimated, and encompasses the redshifted optical jet and the CO outflow.
Previous spectroscopic (Mundt et al. 1987; Eislöffel & Mundt 1998) and imaging (Mundt et al. 1991; Stapelfeldt et al. 1997; Padgett et al. 1999) studies highlighted a strong asymmetry between the two lobes in morphology, velocity and degree of excitation. These studies, however, focused only on the H and [S ii] emission lines as well as on the continuum emission in the optical and near-infrared bands. On the contrary, in this paper we present for the first time very deep and high-spectral resolution spectroscopic observations of a large number of forbidden and permitted lines in the optical range from 5300 to 8500 . The high spectral resolution coupled with long integration times highlight a very complex velocity structure with multiple velocity components evolving along the jet. The large number of detected lines has allowed a detailed study of the gas physical conditions, through the application of spectral diagnostic techniques to selected line ratios. This has provided a rich information on the excitation and dynamics of the flow, as well as on the dust reprocessing. The comparison of our results with those obtained for other jets provides means of investigating the nature of the detected velocity components and the origin of asymmetric jets. This, in turn, can help understanding the generation of outflows and their role in young systems.
2 Observations and data reduction


High resolution echelle spectra of the jet from DG Tau B were obtained with the HIRES spectrograph at the Keck I telescope (Vogt et al. 1994), located at the Keck Observatory on Mauna Kea, Hawaii, on February 23/24, 1998. The weather conditions were stable and photometric during the nights, providing a seeing of typically 07-08. Four deep spectra of 2700 s integration time were obtained using a long slit decker of 28′′115, and a 20482048 CCD Tektronix detector with 2binning in the spatial direction. This setting provided very high spectral resolution (R34 000, i.e. 8.8 km s-1), spectral sampling of 0.036-0.052 Å pixel-1, (corresponding to 2.15 km s-1), and a spatial scale of 0378 pixel-1.
The decker was aligned along the jet position angle (PA295∘, Eislöffel & Mundt 1998). Since the decker is 28′′ long, i.e. shorter than the jet (Eislöffel & Mundt 1998), to cover the full jet length the observations were carried out by centering the decker on the jet source, and then shifting it along the jet PA towards the south-east and north-west relative to the source position, along the blue and the red lobe. In this way a length of 55′′ was covered along the spatial direction. The position angle tracking mode allowed us to keep the slit orientation at the chosen PA during the four exposures. By using the decker, 23 spectral orders overlapping along the spatial direction were obtained, covering a wavelength range from 5300 to 8500 .
The raw frames were reduced following standard recipes with the noao.imred.ccdred package in IRAF111IRAF is distributed by National Optical Astronomy Observatories, which is operated by the Association of Universities for Research in Astronomy, Inc. under contract with the National Science Foundation, including overscan correction, bias and dark subtraction, flat-fielding, background subtraction, and wavelength calibration using Thorium-Argon arcs. The Laplacian Cosmic Ray Identification method (‘lacos’ method, van Dokkum 2001) was used to clean the images from cosmics.
Because of the characteristic jet emission line spectrum we are interested in short sections of the echelle spectra. Thus, the latter were transformed into ordinary long-slit spectra centered around the detected lines. A flat-field frame obtained with a 28′′ long slit was used to calculate the tilt of the orders in the echelle images with respect to a normal long slit spectrum. Hence, the orders containing the emission lines were corrected for the estimated tilt. The same procedure was applied to the Thorium-Argon arcs frames.
Wavelength calibration for the selected spectral orders was performed by means of Thorium-Argon arcs, providing an accuracy of about 0.003 Å. The observed velocities were corrected for the velocity of DG Tau B with respect to the observer, hence the values of showed in all the plots refer to the gas radial velocity with respect to the driving source. Since the central source is obscured it is not possible to estimate the source radial velocity from photospheric absorption lines, e.g. Li 6710 Å. Thus, following Eislöffel & Mundt (1998) we assume that DG Tau B has the same heliocentric radial velocity as the surrounding molecular gas (16.3 km s-1, Mitchell et al. 1994), which translates in a source velocity with respect to the observer of 46.4 km s-1.
Finally, the four frames centered on different positions along the jet PA were aligned and then combined by estimating the position of the brightest emission knots.Thus we obtain for each detected line a long slit spectrum covering 55′′ along the spatial direction and 310 km s-1 along the spectral one (see the position-velocity (PV) diagrams in Fig. 1 and 2 for selected lines). Note that in all the figures shown in this paper the distance from the source is positive along the blue lobe and negative along the red one.
At the end of the data reduction process, telluric features overlapping with the jet emission lines and background caused by the overlap of adjacent orders were fitted by a polynomial surface and then subtracted. The extremely bright [O i]6300 telluric line could not be properly subtracted, thus the [O i]6300 line PV shows a 20 km s-1 cut in the blue lobe centered at -46.4 km s-1(see Fig. 1). This cut is also clearly visible in the PV diagrams of the derived line ratios and of the jet physical properties (see Fig. 5 and Fig. 6).
3 Results


The deep KECK/HIRES spectra (see Fig. 1 and Fig. 2) allowed us to analyse the emission of the HH 159 jet up to 40′′ in the bright red lobe (knots A1, A3, A2, B2, C, and D, following the nomenclature by Eislöffel & Mundt 1998) and 10′′ in the fainter blue lobe (knot F1, F2, and G). Besides the [S ii]6716, 6731 and H 6563 lines, which have been previously observed by Mundt et al. (1987, 1991) and Eislöffel & Mundt (1998), we detected strong and broad emission in [O i]6300, 6364, and in [N ii]6548, 6583 (see Fig. 1). The jet is emitting also in a number of fainter and narrower emission lines, such as [Fe ii]5159, [N i]5198, 5200, [Ca ii]7291, and [Ni ii]7378, detected up to 20′′ (knot C) (see Fig. 2). Finally, very faint emission in the Na i D lines at 5890, 5896 is also detected at a 6 level in knots A1, A3. Since the ionisation energy of Na i is very low, i.e. 5.1 eV, the Na i D lines are rarely observed in HH objects (see, e.g., HH 1 spectra by Solf et al. 1988). The detection of such lines suggests that the excitation conditions are quite low in the red lobe. This idea is confirmed by our analysis of the gas physical conditions (see Sect. 3.2).
3.1 Jet kinematics: asymmetries and velocity components
The PV diagrams of selected emission lines in Fig. 1 show very broad (up to 200 km s-1 FWZI) and complex (up to 3 velocity components) velocity profiles in the first few arcseconds from the source. Thanks to the high spectral resolution of the data (8.8 km s-1) we can resolve and analyse each velocity component in the jet separately. To derive the kinematical properties we extracted the jet spectral profile in the two lobes by spatially integrating the [S ii]6731 and H emission lines over the seeing full width at half maximum (FWHMseeing07-08, i.e. 2 pixels) at different distances along the jet length. Fig. 3 show the variation of the [S ii]6731 and H velocity profile in the red and the blue lobe up to 6′′ from the source. The red lobe clearly shows the presence of a low and a high velocity component (LVC and HVC), while in the blue lobe we detect three velocity components, at low, moderate, and high velocities (LVC, MVC, and HVC, respectively). Interestingly, in both lobes, the low and moderate velocity components fade away at 4-5′′ from the source, while the high velocity components survive further out. This trend has been observed on a large sample of T Tauri stars but on much smaller scales, i.e between a few tens and 200 AU from the source, by, e.g., Hirth et al. (1997) and Pyo et al. (2003), and on similar or even larger scales at the base of HH jets from Class 0/I sources (Garcia Lopez et al. 2008, 2010).
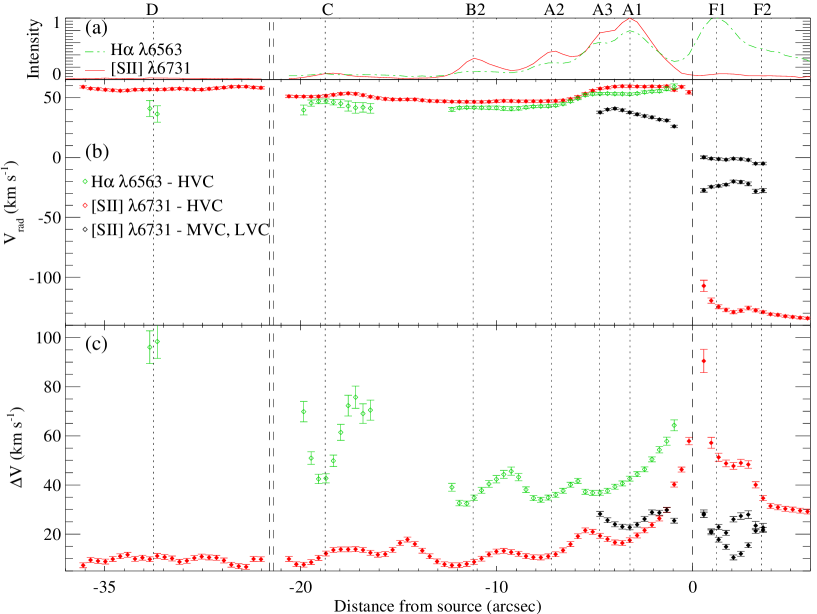
By deblending and Gaussian fitting the spectral profiles shown in Fig. 3 we obtain the gas radial velocity with respect to DG Tau B, , and the spectral width of each velocity component in the jet, V, measured as the observed line full width at half maximum (FWHMobs) corrected for the instrumental width (FWHMinst8.8 km s-1). This is done by assuming a Gaussian profile for both the instrumental and the emission-line profile (i.e. V = (FWHMobs2 - FWHMinst2)1/2). The error on the obtained determination of and V varies between 1-4 km s-1. The parameters derived by fitting the [S ii]6731 and the H 6563 line profiles are plotted in Fig. 4 as a function of distance from the source.
The [S ii]6731 line profiles in Fig. 3 show very well defined velocity components. In the red lobe the HVC radial velocity is decreasing in the first 14′′ from the source from 60 km s-1 in the innermost knots A1, A3 down to 47 km s-1 in knots B2. Then is increasing again moving towards the outer knots C (50-55 km s-1 ) and D (55-60 km s-1 ). This trend, clearly visible also in the line PV diagrams (see Fig. 1 and 2), can be explained if the jet direction is changing due to precession or interaction with the ambient medium. Observational evidences of precessing jets have been already reported by, e.g., Giannini et al. (2005), Hodapp et al. (2005), and Caratti o Garatti et al. (2008). The LVC peak velocity instead varies between 25 and 42 km s-1. In the blue lobe much higher radial velocities are measured of 120-135 km s-1 in the HVC, 20-30 km s-1 in the MVC, and a few km s-1 in the LVC. Given the jet inclination angle with respect to the line of sight of 65∘ estimated through proper motions measurements (Eislöffel & Mundt 1998), the bulk of the gas is moving with a velocity 140 km s-1 in the red lobe, and more than two times higher (-320 km s-1) in the blue one. These values are in agreement with those estimated by Eislöffel & Mundt (1998). The width, V, of the high velocity component is decreasing with distance from the source in both lobes. In the blue lobe we measure V60 km s-1 at 1′′, decreasing to 30 km s-1 at 6′′. In the red lobe V decreases more steeply from 40-60 km s-1 within 1′′ from the source down to 15 km s-1 at 3′′, and values between 6-20 km s-1 for larger distances.
The H 6563 line profiles are much broader than the [S ii] profiles (FWZI up to 200 km s-1) and the emission is very diffuse in this line, making it difficult to separate the different velocity components. Thus we only report the values of and V estimated for the HVC of the red lobe. Fig. 4 shows that has the same trend as in the [S ii] lines, with only slightly lower values. The line width is much larger, though (V varies between 35 and 100 km s-1). A broader H line profile was also noted by Eislöffel & Mundt (1998).
The large velocity dispersion measured within a few arcseconds from the source and, in particular, in the blue lobe, suggests that stronger shocks are present at the jet base, and in the blue lobe. As we will show in the next section this reflects in higher excitation conditions in the blue lobe, that is the jet is highly asymmetric not only in velocity but also in its physical structure.
3.2 Jet physical structure: density and excitation
| Lobe | VC | V | ne | xe | Te | nH | |||
|---|---|---|---|---|---|---|---|---|---|
| km s-1 | km s-1 | 103 cm-3 | 104 K | 104 cm-3 | 10-9 M⊙ yr-1 | 10-6 M⊙ yr-1km s-1 | |||
| Red | HVC | 58 (54) | 27 (46) | 3.3 | 0.22 | 0.45 | 1.49 | 4.2 | 0.6 |
| LVC | 35 | 26 | 1.9 | 0.17 | 0.40 | 1.29 | 2.2 | 0.2 | |
| Blue | HVC | -126 | 47 | 3.6 | 0.88 | 2.46 | 0.41 | 8.2 | 2.5 |
| LVC | -2 | 18 | 1.1 | 0.41 | 0.74 | 0.29 | 0.09 | 7 10-4 |
The position-velocity diagrams shown in Fig. 1 suggest a strong asymmetry of the gas excitation conditions in the two jet lobes. Low excitation lines, such as [S ii]6731 and [O i]6300, are much fainter in the blue lobe than in the red one, while higher excitation lines, such as [N ii]6583 and H 6563, are equally bright in the two lobes (see also the top panel of Fig. 7). This suggests that the gas in the blue lobe is not only moving at higher velocity, as inferred in the previous section, but is also more excited with respect to the gas in the red lobe.
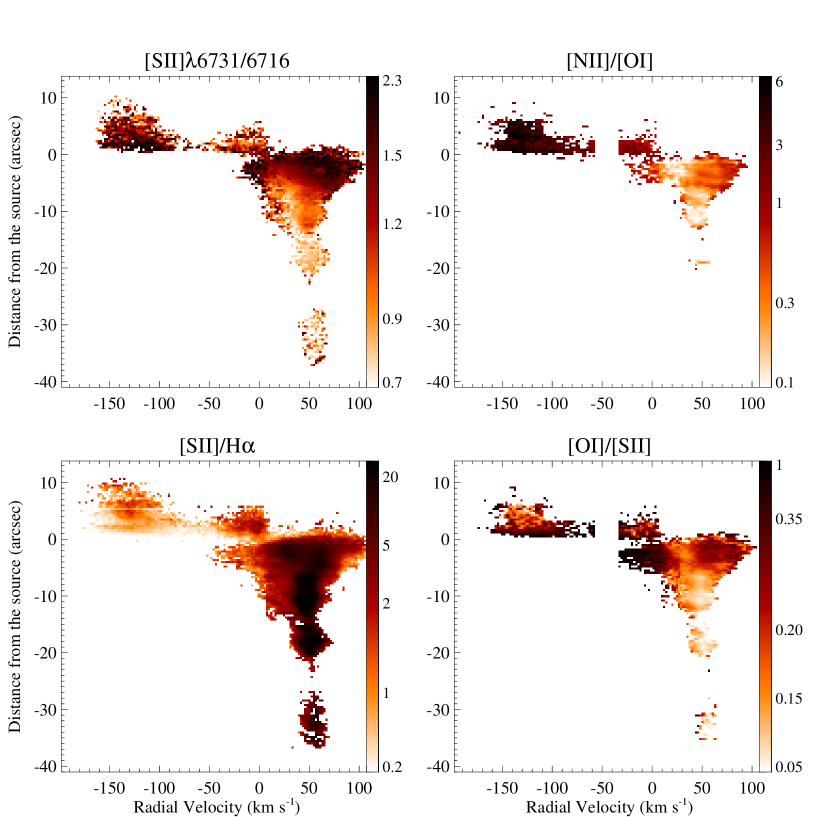
In order to examine the jet physical conditions we compute selected line ratios which are known to be good tracers of the gas excitation (see Fig. 5). [S ii]6731/6716 probes the electron density, ne, increasing up until ne reaches a critical density of 2.5 104 cm-3. On the other hand, [N ii](6548+6583)/[O i](6300+6364) (hereafter [N ii]/[O i]) and [O i](6300+6364)/[S ii](6716+6731) (hereafter [O i]/[S ii]) strongly depend on the gas ionisation fraction and temperature (Bacciotti & Eislöffel 1999). In particular, the [N ii]/[O i] line ratio is increasing with xe while [O i]/[S ii] increases with both Te and the density. Finally, the [S ii](6716+6731)/H 6563 line ratio (hereafter [S ii]/H) is an indicator of the excitation level (see, e.g., the predictions from shock models by Hartigan et al. 1994). In agreement with Mundt et al. (1987, 1991), we found that [S ii]/H can be as high as 20 in the red lobe and very low (0.2-1) in the blue one. This confirms that the redshifted jet is generally of low excitation, while the gas in the blue lobe is highly excited.
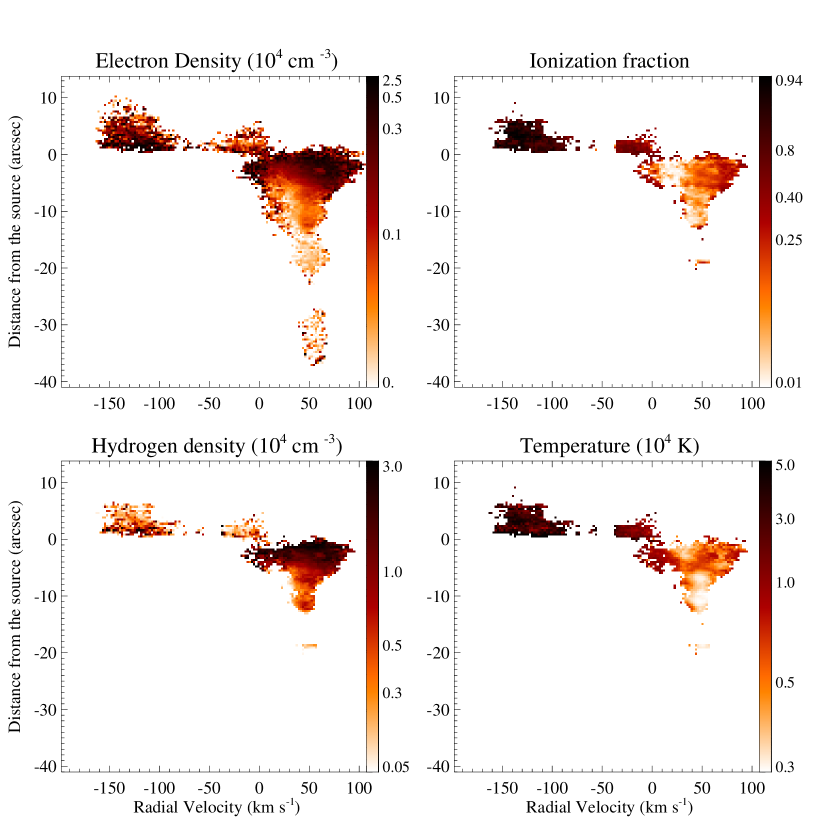
By applying the so-called BE technique, described in Bacciotti & Eislöffel (1999), to the computed [S ii]6731/6716, [N ii]/[O i], and [O i]/[S ii] ratios pixel by pixel we obtain position-velocity maps of the parameters characterizing the gas conditions, i.e. ne, xe, Te, and nH (Fig. 6). The method relies on the fact that the observed forbidden lines are collisionally excited and that, in low-excitation conditions, and provided that no strong sources of ionising photons are present, the ionisation fraction of hydrogen is tightly related to those of nitrogen and oxygen via charge exchange processes. Bacciotti & Eislöffel (1999) and, later, Nisini et al. (2005), verified that the lines used in the technique are emitted in a region of similar temperature, density, and ionisation fraction. Hartigan & Morse (2007) further confirmed the validity of the method by applying spectral diagnostic techniques to infer the physical properties of the HH 30 jet. With this technique one can retrieve the gas physical conditions comparing the observed line ratios with the ones computed for a grid of values of ne, xe, and Te. The errors affecting the estimated parameters are due mainly to the errors on the measured line fluxes, i.e. on the signal-to-noise (see Podio et al. 2006, 2009 for a discussion on the computation of the errors). Note that the diagnostic technique uses ratios between different species and, thus, the obtained xe and Te may depend on the chosen set of elemental abundances. However, as stressed in Podio et al. (2006), the relative variations of the parameters (i.e. in different knots and/or velocity components) do not depend on the choice of an abundance set (see Fig. 1 of Podio et al. 2006) which, therefore, can be thought of as a model parameter. Moreover, the most recent determinations by Asplund et al. (2005) (Solar) and Esteban et al. (2004) (Orion) are in good agreement and produce diagnostic results that differ by not more than 15%, which in most cases is smaller than the uncertainty derived by measurements errors. Since the inferred physical parameters are used also to determine the calcium gas-phase abundance with respect to Solar (see Sect. 4.2), we adopt the Solar abundances estimated by Asplund et al. (2005), as in Podio et al. (2009). We did not apply to the spectra a correction for extinction, but we note that, despite the fact that the source is highly extincted by the surrounding optically thick disk (AV6.5 mag or higher, Jones & Cohen 1986; Watson et al. 2004), the Balmer decrement measured in the inner knots A and F (H/H6-7, Jones & Cohen 1986) indicate that AV is always 1 along the jet. (According to shock models H/H may vary between 6-7 in low velocity shocks (Vs20 km s-1) down to a minimum value of 3 in very high velocity shocks (Vs100 km s-1), Hartigan et al. 1994). On the other hand, Bacciotti & Eislöffel (1999) show that, since the lines used in this diagnostic are very close in wavelength, errors introduced by not correcting for extinction are at most 8%-10% for the ionization fraction and 15% for the temperature, as long as the visual extinction is lower than 3. To check the obtained xe values we compare the observed [N ii](6548+6583)/[N i](5198+5200) with those computed using the inferred parameters. We selected the pixels with high S/N since the [N i] lines are much fainter than the lines used in the diagnostics. For S/N20 we find that observed and computed ratios agree within 20%-30%, i.e. within the error.
The PV diagrams in Fig. 6 show the variation of the electron and total density, ne and nH, the ionisation fraction, xe, and the temperature, Te, both along the two jet lobes and as a function of the gas velocity. The PV diagrams indicate that the jet is denser and more excited close to the source and at high velocities in both lobes. The diagnostic confirms the strong asymmetry between the two lobes, the blue one being more excited, with values of the ionisation fraction going up to 0.9 and temperatures up to 5 104 K.
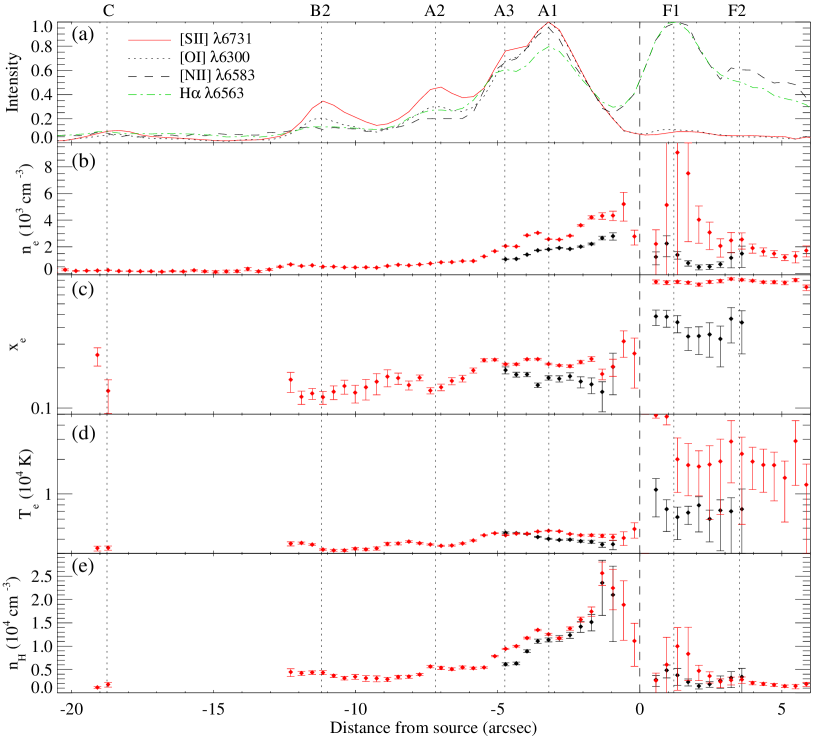
To have a clear view of the variation of the gas physical conditions along the two jet lobes and in the different velocity components we computed, at each position along the jet, the median of ne, xe, Te, and nH on a 20 km s-1 velocity interval centered on the peak velocity of the low and the high velocity components. The obtained values are shown in Fig. 7, while their average over the first 5′′ where both the HVC and LVC are detected, is reported in Tab. 1. The contribution of the MVC, only barely visible in the blue lobe, is not significant and it is not reported in the figure and in the table. The error bars are the median of the errors on the estimated gas physical parameters over the selected 20 km s-1 interval. Note that these are much larger in the blue lobe where the signal-to-noise is much lower.
The electron density ne has a symmetrical trend on the first few arcseconds of the two lobes, decreasing from values of 6-8 103 cm-3 close to the source to 1 103 cm-3 at 6′′ in the HVC, and from 3 103 cm-3 to 500 cm-3 in the LVC. It is then even lower in knots C and D of the red lobe, where it reaches values of 200 cm-3. The excitation conditions, however, are dramatically different in the two lobes. The gas in the blue lobe is very hot (Te(HVC)1-5 104 K, Te(LVC)0.6-1 104 K) and highly ionised (xe(HVC)0.7-0.8 and xe(LVC)0.3-0.5). On the contrary, in the red lobe the temperature is lower (Te3-5 103 K) as well as the degree of ionisation (xe0.1-0.3). Finally, the total hydrogen density is higher in the red lobe, where it decreases from 2-2.5 104 cm-3 in the first 1.5′′ down to 5 103, 3 103, and 1 103 cm-3 in knots A2, B2 and C, respectively; nH is much lower in the blue lobe, decreasing from 1 104 cm-3 in knot F1 to 1 103 cm-3 in knot F2.
The fact that electron and total density peak close to the source, where the velocity dispersion is higher, suggests that stronger shocks are occurring at the jet base which compress and heat the flow.
4 Discussion
In this section we derive from the inferred jet kinematical and physical properties crucial information on the dynamics of the outflows, that is the mass and momentum transported by the two jet lobes in their different velocity components. We then investigate the depletion of refractory species in gas phase, and finally we discuss the jet asymmetry and the kinematical/physical structure of the detected velocity components comparing our results with those obtained for other jets from T Tauri and younger Class 0/I stars.
4.1 Jet dynamics: mass and momentum flux rates
The mass and momentum flux transported by the jet, and , are fundamental parameters to understand the dynamical relationship between the jet and its environment, and to test the validity of the magneto hydro-dynamical models proposed to explain the jet launch. For example, the models predict that the ratio between the rate of mass ejected into the jet () and accreted from the disk onto the star () is fixed (/ 0.01 - 0.1, Shu et al. 2000; Königl & Pudritz 2000).
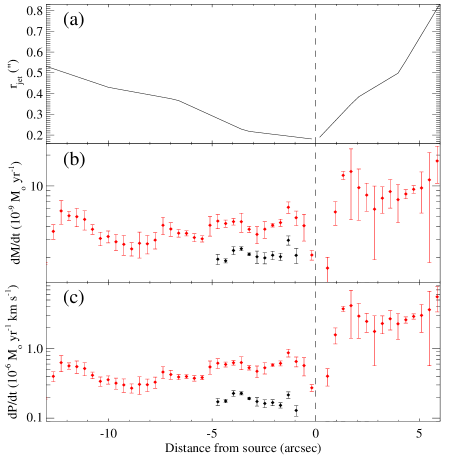
As shown in previous studies (Hartigan et al. 1994; Bacciotti & Eislöffel 1999; Nisini et al. 2005; Podio et al. 2006) an estimate of can be inferred from the determined total density, , and the measured gas velocity, , and jet radius, , as = 2 , where =1.49 is the mean atomic weight and the proton mass. The flux of linear momentum transported by the jet, , is then easily obtained as = . As noted in Podio et al. (2006) this way of estimating the mass flux is independent on reddening and distance estimates. On the other hand, it assumes that the jet is uniformly filled at the density derived from the diagnostics within the estimated jet radius, , thus providing basically an upper limit to . Such an effect is partially compensated for by the presence of regions at higher densities in the jet than those traced by the [S ii] lines, which are not taken into account in the calculations (Nisini et al. 2005; Podio et al. 2006).
We estimate separately in the low and high velocity components in the two jet lobes. The absolute jet velocity, , is derived from the radial velocities estimated by Gaussian fitting of the [S ii]6731 line profile (see Fig. 4) and correcting for the inclination angle of 65∘ (Eislöffel & Mundt 1998). The jet radius, , has been estimated by Mundt et al. (1991) for distances larger than 2′′ and 35 in the blue and red lobe, respectively, and by Stapelfeldt et al. (1997) for d01-5′′. The variation of with distance from the source, obtained by interpolating the estimates from these authors, is shown in the upper panel of Fig 8. The errors on the inferred values of are obtained by propagating the errors affecting our estimates of the jet total density, nH, and of the radial velocity, . One should keep in mind, however, that the main source of uncertainty is the jet radius. For example, Mundt et al. (1991) estimated by applying one-dimensional deconvolution method to seeing-limited images of the jet in the [S ii] lines and the uncertainty on the obtained values can be as high as 30%. The values of obtained by Stapelfeldt et al. (1997) through HST/WFPC2 broadband imaging are more accurate because the jet width is resolved thanks to the high angular resolution offered by HST (01). In both cases, however, there is no spectral information, thus estimates of relative to the different velocity components are not available. Here we assume that the values derived from the works cited above are valid for all velocities, despite the fact that Bacciotti et al. (2000) and Lavalley-Fouquet et al. (2000) showed that, in the case of the jet from DG Tau, the high velocity gas is more collimated than the low velocity component.
The estimated values of in the HVC and in the LVC of the red and the blue lobe are plotted in Fig. 8. In the red lobe turns out to be 2-6 10-9, 2-3 10-9 M⊙ yr-1 in the high and low velocity components, respectively. In the blue lobe (HVC)0.2-2 10-8 M⊙ yr-1 and (LVC)0.3-4 10-10 M⊙ yr-1.
For what concerns the linear momentum, in the red lobe turns out to be 3-9 10-7 and 1-2 10-7 M⊙ yr-1 km s-1 in the high and low velocity components, respectively, while in the blue lobe it is 2-6 10-6 and 0.05-5 10-9 M⊙ yr-1 km s-1 in the HVC and LVC, respectively. The values of and for the blue lobe LVC are 2-3 orders of magnitude lower than in the HVC, because of the very low velocity (only a few km s-1) coupled to very low total densities (nH5 103 cm-3), and are not reported in Fig. 8. In general, the much lower and higher velocities of the LVC and the HVC in the blue lobe with respect to the red one, suggest less interaction with the ambient medium, as explained in more details in Sect. 4.3.
The average of and over the first 5′′ in the high and the low velocity components of both lobes are summarised in Tab. 1. The average values of indicate that, summing the HVC and LVC contributions, the mass outflow rate transported by the blue lobe ((blue)8.2 10-9 M⊙ yr-1) is only 1.3 times higher than that transported by the red one ((red)6.4 10-9 M⊙ yr-1). Considering the large error on this quantity, it can be said that in practice the amount of mass transported by the jet in the two lobes is comparable, despite the large differences in density and velocity. This situation, already found for the asymmetric bipolar jet from the T Tauri star RW Aur by Melnikov et al. (2009), indicates that the ejection power is similar on the two sides of the disk, as it is further discussed in Sect. 4.3.
The rate of mass ejected into the jet, , cannot be compared with the mass accretion rate onto the star, , because DG Tau B is obscured by the optically thick accretion disk, thus preventing veiling measurements at optical and/or near-infrared wavelengths (e.g., Hartigan et al. 1995). The inferred value of 6-8 10-9 M⊙ yr-1 is of the same order of magnitude of those estimated for more evolved T Tauri stars ((TTSs)10-10-5 10-8 M⊙ yr-1) through the same method adopted in this paper (Coffey et al. 2008; Melnikov et al. 2009; Maurri et al. 2010) or also from the luminosity of optical forbidden lines (Hartigan et al. 1995), while it turns out to be lower than the typical values inferred for HH jets emitted by young Class 0/I sources ((Class 0/I)7 10-8-4 10-7 M⊙ yr-1, Hartigan et al. 1994; Bacciotti & Eislöffel 1999; Podio et al. 2006). The derived low values of may indicate that the bulk of the gas is emitting in lower excitation lines lying at far-infrared wavelengths, such as the [O i] 63m line. This hypothesis seems to be confirmed by preliminary results from the analysis of Herschel/PACS observations (Podio et al. 2010).
The linear momentum transported by the blue lobe ((blue)2.5 10-6 M⊙ yr-1km s-1) is 3 times higher than in the red one ((red)8 10-7 M⊙ yr-1km s-1), due to the multiplication by the jet velocity. In order to understand the dynamical relationship between the jet and coaxial molecular outflows, it is very interesting to compare the estimated value of the momentum flux transported by the jet, with the momentum flux transported by the surrounding molecular outflow detected in CO lines. Mitchell et al. (1994) estimated a momentum flux of 1.9 10-6 M⊙ yr-1km s-1 by assuming a distance of 160 pc and an inclination angle with respect to the sky of 15∘. Correcting this value for recent more accurate estimates of the distance (d140 pc) and of the inclination angle (i25∘, Eislöffel & Mundt 1998) one obtains 10-6 M⊙ yr-1km s-1. This value is comparable to the momentum estimated for the jet, indicating that the latter is powerful enough to drive the molecular outflow detected at millimeter wavelengths. How precisely the jet transfers its linear momentum to the surrounding medium, however, remains an open question (see, e.g., Downes & Cabrit 2007).
4.2 Dust reprocessing along the jet: investigating Ca, Ni, and Fe gas-phase abundance
The KECK spectra of DG Tau B include also a number of emission lines from “refractory” species, such as Fe, Ni, and Ca. These species are known to be highly depleted in the interstellar medium because their atoms may be locked onto dust grains (Savage & Sembach 1996). Estimates of Ca, Fe, and Ni gas-phase abundance in Orion and Oph indicate that they are depleted up to four orders of magnitude with respect to their solar abundances (Baldwin et al. 1991; Savage & Sembach 1996; Esteban et al. 2004). On the other hand, dust grains can be partially or completely destroyed both in the jet launching region and in the shocks occurring along the flow, releasing Ca, Fe, and Ni atoms into the gas-phase.
Both the models (Isella & Natta 2005) and near-infrared interferometric observations (Akeson et al. 2005; Eisner et al. 2007) show that the inner part of the accretion disk around T Tauri and Herbig Ae/Be stars is dust-free, because dust grains are destroyed by the stellar radiation up to the so-called dust evaporation radius, Revp. This is located at 0.1-1.5 AU in Herbig stars (Eisner et al. 2007) and at 0.05-0.3 AU in T Tauri stars (Akeson et al. 2005). For younger Class I sources there are no direct estimates of Revp because of their embedded nature. However, we can obtain a rough estimate of the position of Revp for DG Tau B, assuming that the model by Isella & Natta (2005) is still valid for such a young source. For a luminosity of 0.7-0.9 L⊙ (Jones & Cohen 1986; Watson et al. 2004) and a mass accretion rate of at least 10 times higher the inferred we find that Revp is located at about 1-6 times the position of the truncation radius, Rt, where the stellar magnetosphere truncates the disk. (The position of Rt is computed from equation (2.2a,b) of Shu et al. (1994), assuming typical temperature and mass for DG Tau B spectral type (K6, Watson et al. 2004), T3000-5000 K and M0.1-1 M⊙, and stellar magnetic field strength, B∗, of 0.5-3 kG, Johns-Krull 2007). Thus, if the jet originates in the inner region of the disk (Revp) we expect Ca, Fe, and Ni to be present in solar abundance. On the contrary, if the jet originates from a region of the disk extending beyond Revp, part of the dust is lifted with the jet material, and these species will be observed in the jet to be depleted with respect to their solar abundances.
Also the shocks occurring along the jet can affect the gas-phase abundances of refractory species. Theoretical models of C- and J-shocks showed that processes such as thermal and inertial sputtering, photoevaporation and shattering, can destroy from a few percent up to 90% of the dust grains depending on a number of parameters such as the shock velocity, the gas pre-shock density, the intensity of the magnetic field, and the size and structure of the dust grains (e.g., Jones et al. 1994; Jones 2000; May et al. 2000; Draine 2003; Guillet et al. 2009).
Thus, investigating the gas-phase abundances of Ca, Fe, and Ni along jets we can test observationally the predictions of jet launching models and dust reprocessing in shocks.
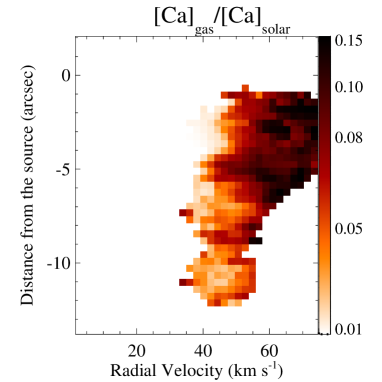
To this aim we analyse the spatio-kinematical distribution of the emission from Ca, Fe, and Ni in the jet, and we estimate the gas-phase abundance of calcium, [Ca/H]gas (hereafter [Ca]gas). The PV diagrams in Fig. 2 show that the emission in these lines is confined to the high velocities both in the red and in the blue lobe. The velocity profiles suggest that the atoms of Ca, Fe, and Ni, highly depleted in the ISM, may be released in gas-phase in the inner disk region and/or in the shocks. In both cases higher abundances are expected in the high velocity component. In fact, on the one hand, the jet launch models predict that the gas extracted from the inner disk region is accelerated to higher velocities with respect to the gas extracted from the outer disk. On the other hand, the destruction rate in a shock is highly dependent on the shock velocity. Thus higher destruction rate is expected in the strongest shocks and at high velocities.
We estimate the Ca gas-phase abundance following the procedure illustrated in Nisini et al. (2005) and Podio et al. (2006, 2009), that consists of comparing observed and predicted ratios between refractory and non-refractory species, such as sulphur, which are expected to be present in solar abundance in the interstellar medium. Following these studies we compare observed [Ca ii]7291/[S ii]6731 ratios (hereafter [Ca ii]/[S ii]), with those computed through the estimated parameters (ne, xe, and Te) and assuming solar abundance for both Ca and S (Asplund et al. 2005). The abundance of calcium in gas-phase in the jet with respect to its solar value is given by the ratio between observed and predicted [Ca ii]/[S ii] ratios: [Ca]gas/[Ca]solar=([Ca ii]/[S ii])obs/([Ca ii]/[S ii])predicted. Following Hartigan et al. (2004) we assume that the [Ca ii] lines are collisionally excited and compute the level populations. As in previous works (Nisini et al. 2005; Podio et al. 2006, 2009) we also assume that there is no calcium in the form of Ca0, since its ionisation potential is very low, 6.1 eV. (Note that emission in the Na i D lines is barely detected only at the peak velocity of knots A1, A3 at 6 ). Also we assume that at every position along the jet, the amount of calcium ionised twice with respect to singly ionised calcium, i.e. Ca++/Ca+, is equal to the hydrogen ionisation fraction, xe. As explained in Podio et al. (2009) the latter assumption is justified by the fact that the ionisation potential of Ca+ is similar to that of hydrogen (11.9 eV and 13.6 eV, respectively), as are the recombination and collisional ionisation coefficients for temperatures lower than 3 104 K. Thus, Ca+ and H0 atoms can be thought of as undergoing the same processes when moving along the jet.
We have no estimates of the visual extinction, thus we cannot correct the Ca+ and S+ line fluxes for reddening. This implies that the observed ratios (assuming AV=0) are actually upper limits to the real values (which decrease for increasing AV). Thus, the calcium depletion inferred from our analysis is a lower limit.
Even so, the results shown in Fig. 9 show that Calcium turns out to be strongly depleted, its gas-phase abundance varying between a few percent and 15% of its solar value ([Ca/H]solar2.04 10-6, Asplund et al. 2005). Interestingly, the Ca abundance is at a maximum close to the source and at high velocities, where the broad velocity profiles and high values of ne and xe suggest the presence of strong shocks. We also derived an estimate of the Ca gas-phase abundance in the blue lobe, despite the very low signal-to-noise of calcium emission here. It turns out that the observed [Ca ii]/[S ii] ratio is 1-3 times the predicted one, implying that Ca is completely released into the gas-phase in the blue lobe, where the very high excitation conditions (xe, Te) indicate very high shock velocities. Similar results have also been found in the HH 111 protostellar jet (Podio et al. 2009) and confirm the dependence of elemental depletion on shock velocity as predicted by shock dust destruction models (e.g., Guillet et al. 2009).
4.3 Investigating the origin of velocity components and asymmetries in stellar jets
The presence of a low and a high velocity components in jets from young stars was first noted by Hamann (1994). Hirth et al. (1997) analysed [S ii], [O i], and [N ii] forbidden emission lines in 38 TTSs and report 58% of them showing a LVC and a HVC, with the LVC being always less extended than the HVC. Similarly, two velocity components have been detected at the base of HH jets emitted by Class 0/I sources and, also in these cases, the LVC is less extended than the HVC. However, while in the flow from T Tauri stars the LVC is confined within 20-200 AU (Hirth et al. 1997), the jets emitted by younger Class 0/I sources present LVC extending up to 1000-2000 AU from the source (Garcia Lopez et al. 2008, 2010). In agreement with these results the LVC from DG Tau B is observed up to 500-700 AU from the source.
Moreover, Hirth et al. (1997) note that the LVC is not observed in the [N ii] lines, suggesting that the LVC is less excited than the HVC, i.e. N is ionised only once in the low velocity gas. More recent deeper observations, however, have shown low velocity [N ii] emission in a few objects, such as DG Tau and CW Tau, allowing us to apply spectral diagnostic techniques and to infer the physical properties of the gas in the two velocity components. Therefore, we compare our results with those found for DG Tau and CW Tau to investigate the properties and the origin of the high and the low velocity components in jets.
The values of the physical parameters summarised in Tab. 1 show that in the jet from DG Tau B the HVC is denser and more excited than the LVC in both the blue and the red lobe. Higher electron densities and ionisation fractions in the HVC have been found also in DG Tau (Lavalley-Fouquet et al. 2000; Maurri et al. 2010), and in CW Tau (Coffey et al. 2008). On the other hand, the analysis of the line ratios in a large sample of TTSs by Hamann (1994) suggest higher temperatures but lower electron densities in the HVC. Combining the results from DG Tau B with these previous estimates, we can conclude that there is clear evidence that the HVC is more excited than the LVC. To understand if the HVC is also denser is more difficult since in many cases an accurate estimate of the total density is limited by the fact that the [S ii] lines used to infer ne are saturated in one or both velocity components, hence obtaining only lower limits to the real density (Lavalley-Fouquet et al. 2000; Coffey et al. 2008; Maurri et al. 2010). For jet from Class 0/I sources, the electron density, estimated through near-infrared [Fe ii] lines, is higher at high velocities along HH 1 and at low velocities in HH 34 and HH 46-47. Since no estimate of the ionisation fraction are available, however, it is not possible to understand which is the denser component. Interestingly, higher densities and excitation conditions at high velocities have been noted at the position of the shock surfaces detected along the HH 111 jet 20-60′′ away from the source (Podio et al. 2009).
The fact that the LVC shows lower excitation conditions suggests that this component is originated in an extended disk-wind where the gas extracted from an outer region of the disk with respect to that emitting the HVC is accelerated at lower velocities and give rise to slower shocks (hence, the lower ionisation fraction and temperature). This hypothesis seems to be confirmed by high angular resolution observations of DG Tau obtained with adaptive optics system and/or with the Hubble Space Telescope which resolve the jet perpendicular to its axis and show that the HV gas is more collimated than the LV gas (Bacciotti et al. 2000; Lavalley-Fouquet et al. 2000; Maurri et al. 2010).
Another interesting and still unexplained characteristic of jets from young stars is that they are often asymmetric. Hirth et al. (1994) noted that 8 out of 15 objects for which estimates of the radial velocities in both lobes are available show a velocity asymmetry with the ratio between the velocity of the fast lobe and the velocity of the slow lobe, Vf/Vs, ranging between 1.4 and 2.6. However, a statistical study of asymmetric jets, aimed to investigate the origin of such an asymmetry, is hampered by the fact that in most of the cases one lobe is much more extincted or intrinsically fainter than the other one making it difficult to derive the gas properties in both lobes. Our deep KECK/HIRES observations allows for the first time to detect both lobes of DG Tau B in all the emission lines which are employed in our diagnostic techniques and thus to derive ne, xe, Te, and nH in both lobes.
We compared our results against those found by Melnikov et al. (2009) for the well-known asymmetric jet from RW Aur, finding that the jets from the two stars have very similar kinematical and physical characteristics. First of all, in both cases the blue lobes are unusually much fainter than the red ones. We note that in both cases the density of the blue lobe is lower, implying intrinsically fainter emission. The blue lobe is also faster in both targets, probably indicating less interaction with the environment on that side of the system. In more detail, the blue lobe is 1.8 times faster than the red one in RW Aur and 2.3 in DG Tau B, it is more ionised by a factor of 3 in RW Aur and 3.3 in DG Tau B and in both jets the fast lobe is less dense than the slow one by a factor 0.3. An important difference between the two jets is that while the width of the jet from RW Aur is similar in the two lobes ( f/ s1), the available images of DG Tau B indicate that the fast lobe is less collimated than the slow one ( f/ s2). The most interesting similarity, however, is that in both DG Tau B and RW Aur the mass transported by the two lobes is comparable (with a ratio of about 1.3 in both targets, smaller than the error on the estimates) despite the observed asymmetry in the physical quantities. Finally, the flux of linear momentum transported by the fast lobe is obviously larger than that transported by the slow one in both systems ( f/ s1.4 for RW Aur and 3 for DG Tau B). We note that similar in the two jet lobes has also been found in other stellar jets showing asymmetries in the physical conditions as, e.g., the HH 30 jet (Bacciotti et al. 1999) and the bipolar jet from the Herbig Ae/Be star LkH 233 (Melnikov et al. 2008).
The striking similarity between the properties of these asymmetric jets suggests that similar effects are at work. As discussed in Melnikov et al. (2009), the fact that the global mass outflow rate is comparable on the two sides of the DG Tau B system appears to indicate that, as much as in the RW Aur case, the power transferred by the rotating disk is the same on both sides of the disk, supporting the validity of a magneto-centrifugal mechanism. In this scenario, however, an asymmetric ambient medium can lead to an asymmetric interaction of the disk with the environment, hence different mass load, lever arms and/or radial extensions of the disk region producing the jet on the two sides (Ferreira et al. 2006). For example, if the ambient radiation field is stronger on one side, this increases the level of ionisation on the surface of the disk on that side, leading to enhanced mass load on the magnetic field lines, and/or to a larger jet launching region. In the case of DG Tau B, larger mass-load and interaction with the surrounding medium in the red lobe is suggested by the detection of a redshifted molecular outflow in the millimeter CO lines (Mitchell et al. 1994).
5 Summary and Conclusions
In this paper we investigate the kinematical and physical structure of the HH 159 jet emitted by the young Class I source DG Tau B, by means of high spectral resolution observations acquired with KECK/HIRES. With respect to previous studies (e.g., Eislöffel & Mundt 1998) we couple the analysis of the jet kinematics with a detailed study of its physical and dynamical properties in each of its lobes and velocity components. Our method involves the analysis of selected line ratios through the so-called BE diagnostic technique (Bacciotti & Eislöffel 1999) to infer the gas physical conditions (ne, xe, Te, and nH). Our main conclusions are as follows:
-
-
the velocity variations along the jet indicates that the ejection direction is changing due to precession and/or interaction with the surrounding medium. The electron and total density, as well as the ionisation fraction and the temperature, are decreasing along both lobes, due to gas dilution, i.e. to the jet propagation in a conical geometry, and/or to stronger shocks at the jet base, where the ejected material interacts with the dense parental cloud.
-
-
the lines show a complex velocity and excitation structure, with multiple velocity components. The high velocity component, HVC, is extending more than the low velocity component, LVC, which is fading at 500-700 AU from the source, similarly to what previously observed for other jets from Class 0/I sources (Garcia Lopez et al. 2008) and, on smaller scales, for jets from CTTSs (e.g., Hirth et al. 1997). The HVC appears to be denser and more excited suggesting that the LV gas is extracted from an outer region of the disk with respect to the HV gas and is thus accelerated at lower velocities.
-
-
the jet show a strong asymmetry: the blue lobe is faster and more excited than the red lobe but less dense and collimated, suggesting that the interaction of the ejected material with the ambient medium is stronger on the red-lobe side. This asymmetry is similar to the one observed in other jets, and in particular in RW Aur (Melnikov et al. 2009).
-
-
despite the observed asymmetries, the mass loss rate is similar in the two lobes (6-8 10-9 M⊙ yr-1), as in other asymmetric jets. This means that the the power transferred by the rotating disk is the same on both sides of the system, as expected if the jet is launched by a magneto-centrifugal engine. The observed asymmetries can be explained in the framework of a MHD disk wind, if the latter propagates in an inhomogeneous ambient medium (Ferreira et al. 2006).
-
-
the redshifted molecular outflow detected in the CO millimeter lines (Mitchell et al. 1994) supports the idea of an asymmetric ambient medium and a larger mass-load on the red-lobe side. The flux of linear momentum transported by the jet is comparable to that estimated for the molecular outflow, thus the latter can be jet-driven (0.8-2.5 10-6 M⊙ yr-1km s-1).
-
-
the depletion of Ca gas-phase abundance with respect to its solar abundance ([Ca]gas/[Ca]solar0.01-0.15) indicates that most Ca atoms are locked onto dust grains. The minimum depletion is observed close to the source and in the HVC, where the strongest shocks are occurring, in agreement with the predictions from models of dust reprocessing in shocks (e.g., Guillet et al. 2009). The presence of dust in the jet may imply that the material is extracted from a region of the disk extending beyond the so-called dust evaporation radius, Revp. However, more stringent constraints on the jet launching region can can only be derived by analysing higher angular resolution observations, to infer Ca gas-phase abundance in the first tens of AU from the source where the gas has not been reprocessed by shocks, and for more unembedded sources, for which the location of Revp can be derived from near-infrared interferometric observations (e.g., Akeson et al. 2005).
Acknowledgements.
The data presented herein were obtained at the W. M. Keck Observatory, which is operated as a scientific partnership among the California Institute of Technology, the University of California, and the National Aeronautics and Space Administration. The Observatory was made possible by the generous financial support of the W. M. Keck Foundation. The authors wish to recognize and acknowledge the very significant cultural role and reverence that the summit of Mauna Kea has always had within the indigenous Hawaiian community. We are most fortunate to have the opportunity to conduct observations from this mountain. J.E. thanks the Institute for Astronomy, UH, for its hospitality during his stay as an Otto-Hahn fellow of the Max-Planck Society. L.P. thanks the Irish Research Council for Science, Engineering and Technology which partially funded her work. Finally, this work was partially supported by the European Community’s Marie Curie Research and Training Network JETSET (Jet Simulations, Experiments and Theory) under contract MRTN-CT-2004-005592.References
- Akeson et al. (2005) Akeson, R. L., et al. 2005, ApJ, 622, 440
- Asplund et al. (2005) Asplund, M., Grevesse, N., & Sauval, A. J. 2005, Cosmic Abundances as Records of Stellar Evolution and Nucleosynthesis, 336, 25
- Bacciotti & Eislöffel (1999) Bacciotti, F., & Eislöffel, J. 1999, A&A, 342, 717
- Bacciotti et al. (1999) Bacciotti, F., Eislöffel, J., & Ray, T. P. 1999, A&A, 350, 917
- Bacciotti et al. (2000) Bacciotti, F., Mundt, R., Ray, T. P., Eislöffel, J., Solf, J., & Camezind, M. 2000, ApJ, 537, L49
- Baldwin et al. (1991) Baldwin, J. A., Ferland, G. J., Martin, P. G., Corbin, M. R., Cota, S. A., Peterson, B. M., & Slettebak, A. 1991, ApJ, 374, 580
- Beck-Winchatz et al. (1994) Beck-Winchatz, B., Böhm, K. H., & Noriega-Crespo, A. 1994, PASP, 106, 1271
- Beck-Winchatz et al. (1996) Beck-Winchatz, B., Böhm, K.-H., & Noriega-Crespo, A. 1996, AJ, 111, 346
- Böhm & Matt (2001) Böhm, K.-H., & Matt, S. 2001, PASP, 113, 158
- Cabrit et al. (2007) Cabrit, S., Codella, C., Gueth, F., Nisini, B., Gusdorf, A., Dougados, C., & Bacciotti, F. 2007, A&A, 468, L29
- Caratti o Garatti et al. (2008) Caratti o Garatti, A., Froebrich, D., Eislöffel, J., Giannini, T., & Nisini, B. 2008, A&A, 485, 137
- Coffey et al. (2008) Coffey, D., Bacciotti, F., & Podio, L. 2008, ApJ, 689, 1112
- Davis et al. (2001) Davis, C. J., Hodapp, K. W., & Desroches, L. 2001, A&A, 377, 285
- Downes & Cabrit (2007) Downes, T. P., & Cabrit, S. 2007, A&A, 471, 873
- Draine (2003) Draine, B.T. 2003, arXiv:0304488
- Eislöffel & Mundt (1998) Eislöffel, J., & Mundt, R. 1998, AJ, 115, 1554
- Eisner et al. (2007) Eisner, J. A., Chiang, E. I., Lane, B. F., & Akeson, R. L. 2007, ApJ, 657, 347
- Esteban et al. (2004) Esteban, C., Peimbert, M., García-Rojas, J., Ruiz, M. T., Peimbert, A., & Rodríguez, M. 2004, MNRAS, 355, 229
- Ferreira et al. (2006) Ferreira, J., Dougados, C., & Cabrit, S. 2006, A&A, 453, 785
- Garcia Lopez et al. (2008) Garcia Lopez, R., Nisini, B., Giannini, T. et al. 2008, A&A, 487, 1019
- Garcia Lopez et al. (2010) Garcia Lopez, R., Nisini, B., Eislöffel, J., Giannini, T., Bacciotti, F., & Podio, L. 2010, A&A, 511, A5
- Giannini et al. (2005) Giannini, T., et al. 2005, A&A, 433, 941
- Guillet et al. (2009) Guillet, V., Jones, A. P., & Pineau Des Forêts, G. 2009, A&A, 497, 145
- Hamann (1994) Hamann, F. 1994, ApJS, 93, 485
- Hartigan et al. (1994) Hartigan, P., Morse, J. A., & Raymond, J. 1994, ApJ, 436, 125
- Hartigan et al. (1995) Hartigan, P., Edwards, S., & Ghandour, L. 1995, ApJ, 452, 736
- Hartigan et al. (2004) Hartigan, P., Edwards, S., & Pierson, R. 2004, ApJ, 609, 261
- Hartigan & Morse (2007) Hartigan, P., & Morse, J. 2007, ApJ, 660, 426
- Hirth et al. (1994) Hirth, G. A., Mundt, R., Solf, J., & Ray, T. P. 1994, ApJ, 427, L99
- Hirth et al. (1997) Hirth, G. A., Mundt, R., & Solf, J. 1997, A&AS, 126, 437
- Hodapp et al. (2005) Hodapp, K. W., Bally, J., Eislöffel, J., & Davis, C. J. 2005, AJ, 129, 1580
- Isella & Natta (2005) Isella, A., & Natta, A. 2005, A&A, 438, 899
- Johns-Krull (2007) Johns-Krull, C. M. 2007, ApJ, 664, 975
- Jones & Cohen (1986) Jones, B. F., & Cohen, M. 1986, ApJ, 311, L23
- Jones et al. (1994) Jones, A. P., Tielens, A. G. G. M., Hollenbach, D. J., & McKee, C. F. 1994, ApJ, 433, 797
- Jones (2000) Jones, A.P. 2000, J. Geophys. Res., 105, 10257
- Königl & Pudritz (2000) Königl, A., & Pudritz, R. E. 2000, Protostars and Planets IV, 759
- Lavalley-Fouquet et al. (2000) Lavalley-Fouquet, C., Cabrit, S., & Dougados, C. 2000, A&A, 356, L41
- Luhman et al. (2010) Luhman, K. L., Allen, P. R., Espaillat, C., Hartmann, L., & Calvet, N. 2010, ApJS, 186, 111
- Maurri et al. (2010) Maurri, L., Bacciotti, F., Podio, L. et al., in preparation
- May et al. (2000) May, P. W., Pineau des Forêts, G., Flower, D. R., Field, D., Allan, N. L., & Purton, J. A. 2000, MNRAS, 318, 809
- Melnikov et al. (2008) Melnikov, S., Woitas, J., Eislöffel, J., Bacciotti, F., Locatelli, U., & Ray, T. P. 2008, A&A, 483, 199
- Melnikov et al. (2009) Melnikov, S. Y., Eislöffel, J., Bacciotti, F., Woitas, J., & Ray, T. P. 2009, A&A, 506, 763
- Mitchell et al. (1994) Mitchell, G. F., Hasegawa, T. I., Dent, W. R. F., & Matthews, H. E. 1994, ApJ, 436, L177
- Mitchell et al. (1997) Mitchell, G. F., Sargent, A. I., & Mannings, V. 1997, ApJ, 483, L127
- Mouri & Taniguchi (2000) Mouri, H., & Taniguchi, Y. 2000, ApJ, 534, L63
- Mundt & Fried (1983) Mundt, R., & Fried, J. W. 1983, ApJ, 274, L83
- Mundt et al. (1987) Mundt, R., Brugel, E. W., & Buehrke, T. 1987, ApJ, 319, 275
- Mundt et al. (1991) Mundt, R., Ray, T. P., & Raga, A. C. 1991, A&A, 252, 740
- Nisini et al. (2002) Nisini, B., Caratti o Garatti, A., Giannini, T., & Lorenzetti, D. 2002, A&A, 393, 1035
- Nisini et al. (2005) Nisini, B., Bacciotti, F., Giannini, T. et al. 2005, A&A, 441, 159
- Nisini et al. (2007) Nisini, B., Codella, C., Giannini, T., Santiago Garcia, J., Richer, J. S., Bachiller, R., & Tafalla, M. 2007, A&A, 462, 163
- Padgett et al. (1999) Padgett, D. L., Brandner, W., Stapelfeldt, K. R., Strom, S. E., Terebey, S., & Koerner, D. 1999, AJ, 117, 1490
- Padgett et al. (2000) Padgett, D. L., Stapelfeldt, K. R., & Sargent, A. F. 2000, Bulletin of the American Astronomical Society, 32, 1481
- Pesenti et al. (2003) Pesenti, N., Dougados, C., Cabrit, S., O’Brien, D., Garcia, P., & Ferreira, J. 2003, A&A, 410, 155
- Podio et al. (2006) Podio, L., Bacciotti, F., Nisini, B., Eislöffel, J., Massi, F., Giannini, T., & Ray, T. P. 2006, A&A, 456, 189
- Podio et al. (2009) Podio, L., Medves, S., Bacciotti, F., Eislöffel, J., & Ray, T. 2009, A&A, 506, 779
- Podio et al. (2010) Podio, L., et al., in preparation
- Pyo et al. (2003) Pyo, T.-S., et al. 2003, ApJ, 590, 340
- Raga & Böhm (1986) Raga, A. C., & Böhm, K. H. 1986, ApJ, 308, 829
- Rodriguez et al. (1995) Rodriguez, L. F., Anglada, G., & Raga, A. 1995, ApJ, 454, L149
- Sauty & Tsinganos (1994) Sauty, C., & Tsinganos, K. 1994, A&A, 287, 893
- Savage & Sembach (1996) Savage, B. D., & Sembach, K. R. 1996, ARA&A, 34, 279
- Shu et al. (1994) Shu, F., Najita, J., Ostriker, E., Wilkin, F., Ruden, S., & Lizano, S. 1994, ApJ, 429, 781
- Shu et al. (2000) Shu, F. H., Najita, J. R., Shang, H., & Li, Z.-Y. 2000, Protostars and Planets IV, 789
- Solf et al. (1988) Solf, J., Böhm, K. H., & Raga, A. 1988, ApJ, 334, 229
- Stapelfeldt et al. (1997) Stapelfeldt, K., Burrows, C. J., Krist, J. E., & WFPC2 Science Team 1997, Herbig-Haro Flows and the Birth of Stars, 182, 355
- van Dokkum (2001) van Dokkum, P. G. 2001, PASP, 113, 1420
- Vogt et al. (1994) Vogt, S. S., et al. 1994, Proc. SPIE, 2198, 362
- Watson et al. (2004) Watson, D. M., et al. 2004, ApJS, 154, 391
- Woitas et al. (2002) Woitas, J., Ray, T. P., Bacciotti, F., Davis, C. J., & Eislöffel, J. 2002, ApJ, 580, 336