Rare Earth Monopnictides and Monochalcogenides from First Principles: Towards an Electronic Phase Diagram of Strongly Correlated Materials
Abstract
We present results of an ab-initio study of the electronic structure of 140 rare earth compounds. Specifically we predict an electronic phase diagram of the entire range of rare earth monopnictides and monochalcogenides, composed of metallic, semiconducting and heavy fermion-like regions, and exhibiting valency transitions brought about by a complex interplay between ligand chemistry and lanthanide contraction. The calculations exploit the combined effect of a first-principles methodology, which can adequately describe the dual character of electrons, itinerant vs. localized, and high throughput computing made possible by the increasing available computational power. Our findings, including the predicted ”intermediate valent” compounds SmO and TmSe, are in overall excellent agreement with the available experimental data. The accuracy of the approach, proven e.g. through the lattice parameters calculated to within 1.5% of the experimental values, and its ability to describe localization phenomena in solids, makes it a competitive atomistic simulation approach in the search for and design of new materials with specific physical properties and possible technological applications.
I Introduction
Increased computer power, together with reliable electronic structure codes, have opened up the possibility of exploring electronic properties of huge numbers of materials.Ortiz et al. (2009) A systematic first principles based theoretical study of entire families of compounds has the potential of exploring new trends in their physical properties or discovering materials with improved characteristics of possible interest for technological applications.
The ab-initio determination of materials properties requires electronic structure calculations that are accurate and parameter-free. With the advent of density functional theory (DFT),Hohenberg and Kohn (1964) quantum mechanical calculations of the electronic structure of solids were put on a rigorous theoretical foundation. Nevertheless, the lack of knowledge of the exact exchange-correlation energy functional constitutes a substantial obstacle regarding the predictive power of the calculations, as different mechanisms are at work depending on the relative importance of band formation energy on one hand and on-site electron-electron interaction and electron localization on the other. Standard electronic structure calculations, based on the local spin density approximation (LSDA)Kohn and Sham (1965); von Barth and Hedin (1972) to density functional theory, work very well for conventional materials like simple metals and their alloys, characterized by delocalized electron states and large band formation energies. However, for systems where localized electron states occur, such as the 4’s in rare earth compounds, the LSDA suffers from a sizeable self-interaction (SI) error,Fermi and Amaldi (1934) brought about by the local approximation to the exchange-correlation energy functional. Consequently, different assumptions and/or parameters need to be invoked to describe the electronic structure of strongly correlated electron materials.Temmerman et al. (2009)
The self-interaction correctedPerdew and Zunger (1981) local-spin-density (SIC-LSD) energy functional is free of the SI error and fulfils the requirement of being parameter free and of sufficient accuracy to study trends in properties of entire families of materials containing both localized and itinerant electrons.Temmerman et al. (2000); Svane et al. (2000); Svane (1996) Here we apply the SIC-LSD to provide global understanding of the ground state electronic structure of rare earth monopnictides and monochalcogenides and, through that, also demonstrate the predictive power and accuracy of this approach. Specifically, the present study covers 140 distinct compounds, RX, with R referring to the rare earth atoms Ce, Pr, Nd, Pm, Sm, Eu, Gd, Tb, Dy, Ho, Er, Tm, Yb, Lu, and X standing for the pnictide atoms N, P, As, Sb, Bi and the chalcogenide atoms O, S, Se, Te, Po. Most of these compounds are known to exist in nature, crystallizing predominantly in the rocksalt structure. Due to the intricate dual nature of the 4-electrons, as a function of chemical environment these compounds display an extraordinarily wide range of electronic, magnetic, optical, and magneto-optical properties with, among other things, potential practical applications in the field of spintronics.Schmehl et al. (2007); LeClair et al. (2002) A considerable number of theoretical studies on the RX compounds have resulted in greatly improved insight into their properties.Duan et al. (2007); Petukhov et al. (1996); Larson et al. (2007); Antonov et al. (2004) However those calculations have often been guided by experiment, relying on parameters to reproduce the observed properties. The goal of the present systematic study is to establish a paramater-free unified theoretical picture of the RX electronic properties and possibly provide directions for further experimental investigations. With future applications in mind, we show how large scale computational infrastructures can potentially be exploited in the search for the novel rare earth related materials that play an increasingly prominent role in innovative technologies and the quest for renewable energies.Ramsden et al. (2001)
II Theoretical Background
In the LSD approximation the total energy functional is decomposed as
| (1) |
where is the kinetic energy operator, and represents the interaction with an external potential. The electron-electron interaction is given as the sum of the Hartree term and the local exchange-correlation term, .
In the Hartree-Fock approximation, the expectation value of the electron repulsion operator in some multiplet state may be written as Jorgensen (1962); Nugent (1970)
| (2) |
where is in general given by a linear combination of Slater determinants. Since commutes with total , , and , the above matrix elements are equal for quantum numbers belonging to one () family. are the Racah parameters, Racah (1942) which are related to the Slater two-electron integrals (defined later). The coefficients depend on the particular -configuration chosen.
The quantity is the Coulomb repulsion between two -electrons, and the Coulomb energy term in the LSD total energy functional (1) corresponds to the part of the first term in Eq. (2). The term, , in Eq. (2), cancels an equivalent contribution in the Hartree energy term, representing the interaction of an electron with itself. A similar cancellation does not occur in the LSD functional, which therefore carries an unphysical self-interaction. Perdew and Zunger (1981) This interaction, which tends to be insignificant for extended band state, may lead to uncontrollable errors in the description of atomic-like localized states, for example the -electrons in the rare earths. Following the suggestion by Perdew and Zunger Perdew and Zunger (1981), in the SIC-LSD methodology, the LSD functional (1) is corrected for this spurious self-interaction by adding an explicit energy contribution for an electron to localize. The resulting, orbital dependent, SIC-LSD total energy functional has the form Temmerman et al. (2000); Svane (1996)
| (3) |
where
| (4) | |||||
| (5) |
The self-interaction energy (4) consists of the self-Coulomb and self-exchange-correlation energies of the occupied orbitals with charge density and spin density . For itinerant states, the self-interaction vanishes identically, while for localized (atomic-like) states may be appreciable. Thus, the self-interaction correction constitutes a negative energy contribution gained by an electron upon localization, which competes with the band formation energy gained by the electron if allowed to delocalize and hybridize with the available conduction states. Different localized/delocalized configurations are realized by assuming different numbers of localized states - here -states on rare earth atom sites. The SIC-LSD approach is fully ab-initio, as both localized and delocalized states are expanded in the same set of basis functions, and are thus treated on an equal footing. If no localized states are assumed, coincides with the conventional LSD functional, i.e., the Kohn-Sham minimum of the functional is also a local minimum of .
The spin-orbit interaction (5) couples the band Hamiltonian for the spin-up and spin-down channels, i.e. a double secular problem must be solved. The spin-orbit parameter,
in atomic Rydberg units, is calculated from the self-consistent potential .
Of the remaining terms in Eq. (2), the term accounts for Hund’s first rule. The term only contributes to the level spacing of excited multiplets and will not be relevant in a functional for the ground state energy. The term, describes the level spacing between multiplets in the maximum spin configuration, i.e. this term accounts for Hund’s second rule, by which the multiplet of maximum total orbital momentum, , has the lowest energy. With respect to the average (maximum spin) energy (the grand bary center), the maximum multiplet is lowered by , where for , and respectively. It is an atomic effect which results in an increased stability at 1/4 and 3/4 filling of the 4-shell, and this second Hunds’s rule effect is often referred to as the tetrad effect (TE). Nugent (1970) Although, both LSD and SIC-LSD take into account Hund’s first and third rules, with respectively the exchange interaction and spin-orbit coupling included in the total energy functional, Hund’s second rule is not defined for the homogeneous electron gas, underlying LDA.Eriksson et al. (1990) To account for it in our total energy calculations, we add (a posteriori) to the SIC-LSD total energy functional the relevant correction
| (6) |
The parameter is equivalent to Racah’s -parameter,Racah (1942) and is given in terms of the reduced Slater integrals as:
| (7) |
where . Here are numerical constants (=225, 1089, 7361.64 for =2, 4, 6) and the Slater integral is defined through
| (8) |
Here, is the f-partial wave as calculated in the self-consistent crystal potential, and () denotes the smaller (larger) of the variables and . In reality, correlation effects in the solid environment tend to reduce the multiplet energy level splittings. Hence our calculated TE values are on average 15-20% larger than their experimental counterparts.Nugent (1970)
III Calculational details
Given the total energy functional , the computational procedure is as for the LSD case, i.e. minimization is accomplished by iteration until self-consistency. In the present work, the electron wavefunctions are expanded in the linear-muffin-tin-orbital (LMTO) basis functions.Andersen (1975) The atomic spheres approximation (ASA) is used, whereby the crystal volume is divided into slightly overlapping atom-centered spheres of a total volume equal to the actual volume. A known shortcoming of the ASA is that different crystal structures have different degrees of overlap of the ASA spheres resulting in substantial relative errors in the evaluation of the total energy. While this inhibits the comparison of energies of different crystal structures, when comparing the energies of different localization/delocalization scenarios within the same crystal structure the ASA error is of minor influence. To improve the packing of the structure empty spheres have been introduced on high symmetry interstitial sites. Two uncoupled energy panels have been considered when constructing the LMTO’s to ensure an accurate description of semicore states. The -coupling scheme is adopted for the localized -states by starting the iterations with Wannier states of appropriate symmetry. During iteration to self-consistency the symmetry of the Wannier states may change, however grossly retaining their overall characteristics due to the fact that the energy scale of spin-orbit interaction is smaller than that of exchange, but larger than that of crystal field for the -states. The rocksalt structure with the magnetic moments arranged ferromagnetically was assumed in all the calculations. To conduct the present large scale systematic study of rare earth compounds, in addition to a reliable theory and computer codes, we have made an extensive use of grid computing and automated data/metadata management tools.Tyer et al. (2005); Calleja et al. (2004)
IV Total energies and valency transitions
In the SIC-LSD methodology, both the itinerant and localized limits are described by the same energy functional, which enables us to predict the ground state of correlated electron materials from total energy considerations.Temmerman et al. (2000); Svane et al. (2000) Hence, one can investigate localization phenomena in solidsTemmerman et al. (2009) by realizing and studying different localization/delocalization scenarios, giving rise to different valency configurations, and through total energy minimization determine the ground state electronic structure and valency configurations of the compound under consideration.Petit et al. (2001) This nominal valency is defined as an integer number of electrons available for band formation,
| (9) |
obtained by subtracting from the atomic number () the sum of core (), and localized () electrons. In this paper we will be using two interchangeable nomenclatures, and Rm+, to describe the configuration of the rare earth ion, implying and , respectively. The total number of -electrons may be larger than , because, in addition to the localized -states, the band states also contribute to the total -count on a given ion. Note that our calculated valencies, refer to the number of rare earth electrons that contribute to bonding, and thus do not necessarily coincide with the nominal (ionic) valency of a compound.
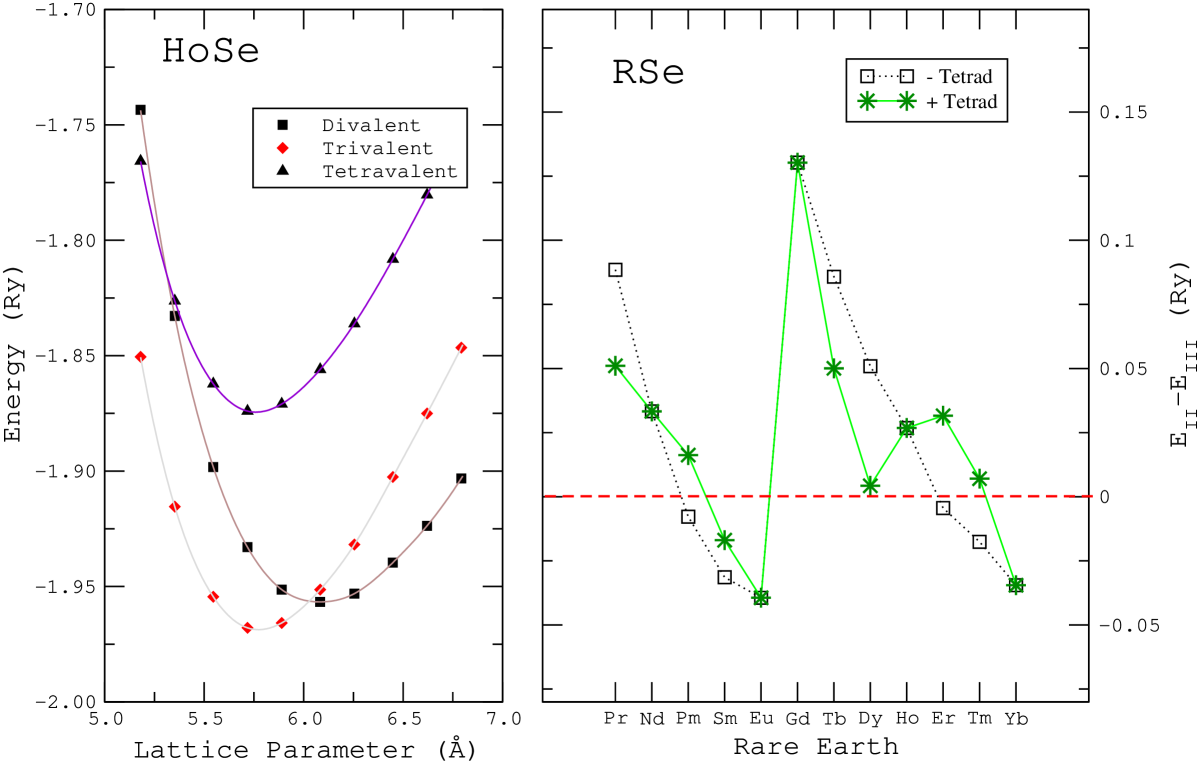
In our study of the rare earth monopnictides and monochalcogenides, for each given compound the self-consistent calculations involve the total energy minimization as a function of lattice parameter with respect to a number of different possible localization/delocalization scenarios, in order to determine the global energy minimum and the corresponding equilibrium volume. To understand what is involved in this process, we explain the minimization procedure on the example of HoSe depicted in Fig. 1a. What is seen in the figure are total energy curves, as a function of lattice parameter, for three energetically relevant valency configurations. The way they come about is based on electronic structure considerations. The Ho atom contributes 67 electrons to the total electron count of HoSe, 54 of which are considered to be part of the core (and semicore), and thus not contributing signifcantly to its chemistry. The remaining 13 electrons on the outer most shells, 11 of which are the -electrons, are chemically active and constitute the valence electrons. The latter can either hybridize with the other band electrons or localize on site, playing no role in band formation. Assuming all the 11 -electrons to be localized, means that only two -electrons of Ho contribute to band formation, a scenario which we refer to as divalent and which represents, with respect to -electrons, the fully localized limit. Configurations with one or two delocalized (bonding) -electrons are respectively referred to as trivalent and tetravalent. The LDA scenario, which treats all the ligand and rare earth valence electrons, including the 11 -electrons, as band electrons, is found energetically unfavourable by 1 Ry, as compared to any of the other scenarios, and is therefore not shown in Fig. 1a. Altogether at least some forty self-consistent calculations are required to establish the global energy minimum for a compound like HoSe which, as can be seen in Fig. 1a, is obtained in the trivalent scenario.
From the calculated local energy minima we can evaluate the energy differences between respectively the divalent and trivalent configurations, , and the tetravalent and trivalent configurations, , both of which are a measure of stability of the ground state configuration. From Fig. 1a, we find for HoSe = 90 mRy and = 20 mRy, indicating a rather stable trivalent ground state, with no tendency towards delocalization of an additional -electron, but with some, albeit marginal, tendency to localization of an additional electron. Thus whilst we predict a trivalent ground state at ambient conditions, with respect to possible phase transformations, for example under negative pressure, is the relevant energy scale to consider in HoSe. The calculated trivalent equilibrium lattice parameter is equal to 5.55 Å, differing from the divalent minimum by about 5%.
In Fig. 1b, we present the calculated total energy differences, , for the entire rare earth selenide series (RSe) from Pr onwards. The two curves shown refer respectively to the SIC-LSD calculations with (stars) and without (squares) the TE. The positive values indicate a trivalent ground state, whereas the negative values refer to the divalent configuration being energetically more favourable. One can see that without the TE, decreases monotonously from trivalent PrSe to divalent EuSe, and again from trivalent GdSe to divalent YbSe. The increasing trend towards divalency is associated with the enhanced localized nature of the -electrons and can be understood as a manifestation of the well known lanthanide contraction. A small indicates that for the given compound no clear ground state emerges, as the divalent and trivalent configurations are close to energetically degenerate, due to the competition between band formation and self-interaction correction (localization) energies.
The overall trend of decreasing energy differences is still recognizable in both halves of the selenide series when the TE is included. However, due to the abrupt decrease in at DySe a characteristic hump, also observed in experiments on rare earthsJohansson (1979); Patthey et al. (1993), develops in the later part of the series, implying that this compound is considerably less trivalent than one would expect from the SIC-LSD result prior to taking Hund’s second rule into account. Even more important are the changes in predicted ground state configurations for ErSe and TmSe (as well as PmSe), indicating that the tetrad effect can bring about a qualitative change in compounds where the original energy differences are small. Otherwise, inplementing Hund’s second rule has only a quantitative effect on the of those compounds that from the outset are either solidly trivalent or divalent.
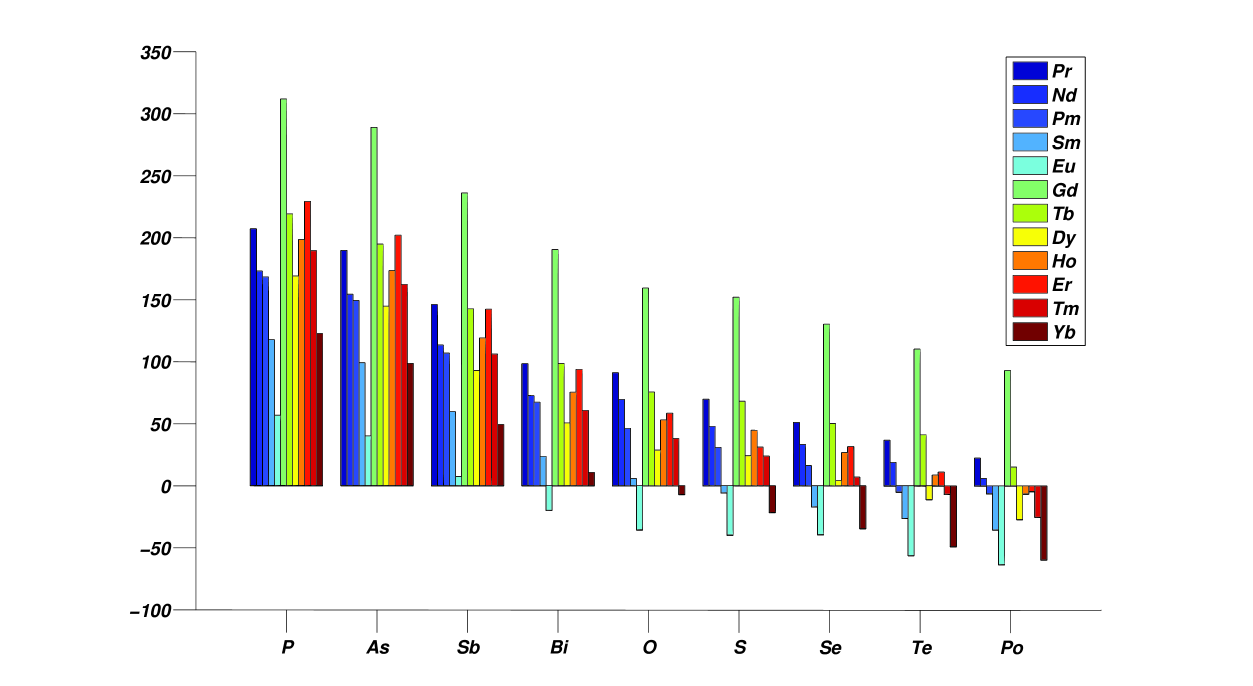
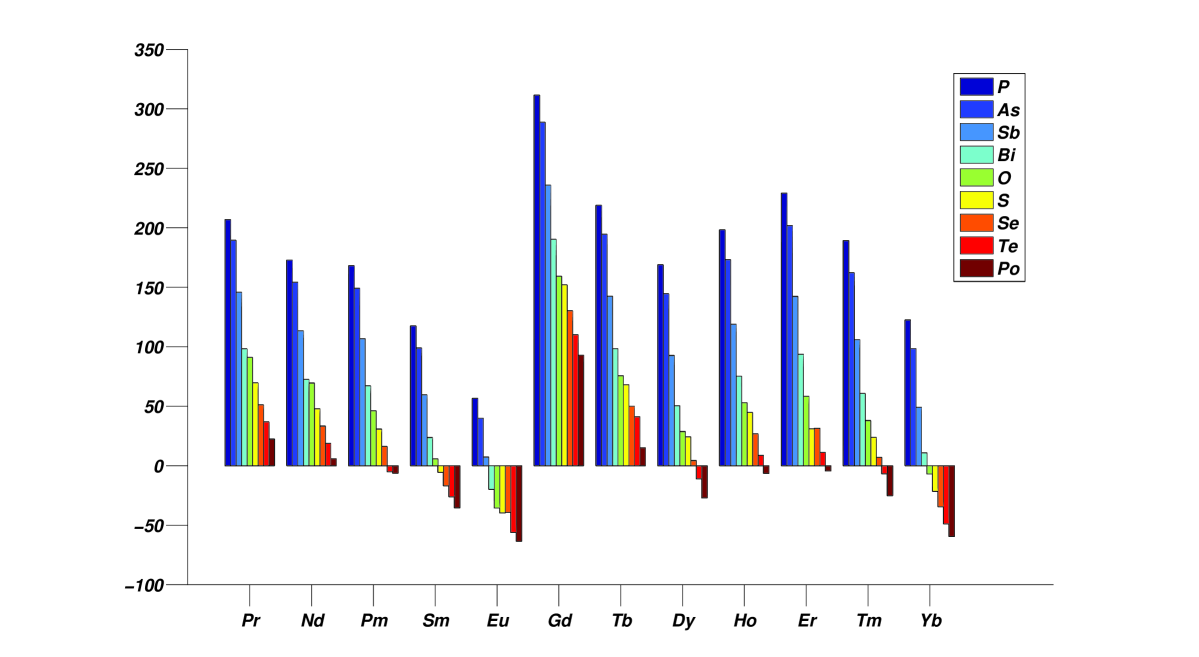
Taking the TE into account, the divalent-trivalent energy differences, , for all the RX compounds (except for the rare earth nitrides and the Ce compounds) are collected in Fig. 2. The positive and negative values again indicate respectively a trivalent and divalent ground state configurations. In Fig. 2a, for each of the ligand ions the data are plotted as clusters of bars, representing the rare earth ions ranging from Pr to Yb. We notice that the total energy trends, observed for the selenide series in Fig. 1b, are reproduced in all the ligands, but overall, in the chalcogenides the divalent configuration becomes increasingly more favourable as a function of ligand size, whilst in the pnictides the trivalent configuration remains the ground state, even for the ”late” rare earth Eu and Yb (with the exception of EuBi). The trivalent to divalent localization transition thus mainly pertains to the rare earth chalcogenides. In Fig. 2b, the same total energy data are depicted as a function of rare earth, with the ligands plotted as clusters of bars ranging from P to Po for each of the rare earth ions. In this representation one can clearly see the combined effect of the lanthanide contraction, leading gradually towards the more preferred divalent configurations, and the repetition of this trend due to the half-filled shell effect.
Although is the relevant energy scale for the large majority of the RX, there are a number of exceptions where the delocalized tetravalent scenario is energetically more favourable than the localized divalent scenario even though according to our calculations it never actually becomes the true ground state. The trivalent-tetravalent energy difference, , is the more relevant energy scale for the Ce compounds for example, as the divalent configuration is always very unfavourable, and in most cases could not even be converged. In the case of CeN, and to some degree in CeO, the tetravalent and trivalent scenarios are actually close to energetically degenerate. Since the divalent scenario is so highly unfavourable, the Ce pnictides and chalcogenides, as well as all the other rare earth nitrides, are not shown in Fig. 2. For the LuX compounds is not adequate, as a divalent scenario would here imply 15 localized -electrons.
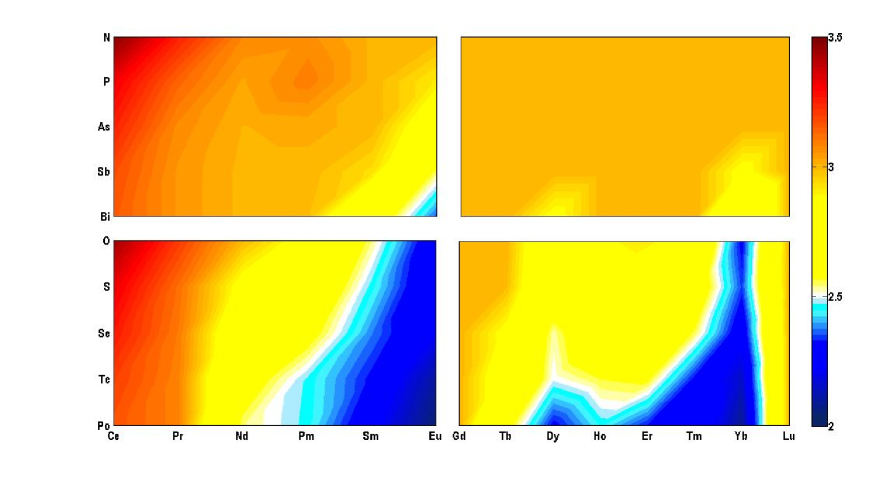
As shown in Fig. 3, a unified picture for all the RX compounds emerges when we map the calculated energy differences into ground state valencies. Here the valency scale is defined such that it runs from 3.5 for the tetravalent/trivalent degenerate compounds (=0) to 2.5 for the trivalent/divalent degenerate (=0) compounds. The yellowish areas, that dominate throughout the phase diagram, demonstrate the overall preferred trivalent ground state configuration for the large number of the RX compounds, in particular the monopnictides. The trend towards delocalizing an additional electron is only noticeable for the CeX systems and some of the nitrides, as indicated by the more reddish areas of the phase diagram, whilst the trivalent to divalent localization transition occurs around the regions indicated in white. The blue zones represent the stable divalent configuration, which is the dominating ground state for many of the ”heavy” chalcogenides, in combination with the rare earths situated in the middle and later parts of the series.
V Electronic structure
V.1 Density of states: chalcogen versus pnictogen chemistry
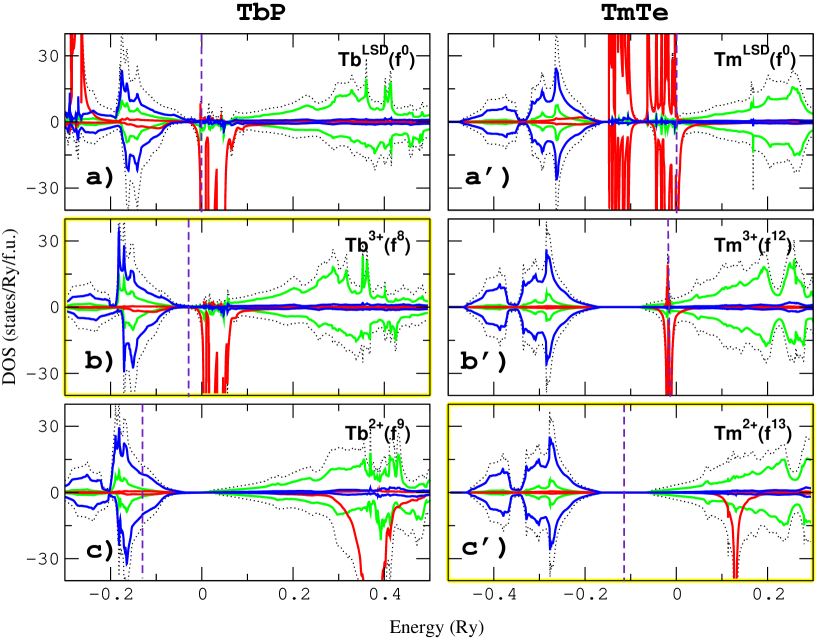
The observed total energy trends can be understood in terms of variations in the ground state electronic structures brought about by changes in the atomic composition, the distance between atoms, and the relative position of the atomic energy levels. In the RX compounds, the electronic structure results mainly from the - and -orbitals on the R-sites overlapping with the -orbitals on the ligand-sites, as well as with the - and -orbitals on neighbouring R-sites. In figure 4, using TbP (column 1) and TmTe (column 2) as representative examples for the pnictide and chalcogenide rare earth compounds, we depict the density of states (DOS) for three different valency scenarios, as realized respectively in the delocalized (Figs. 4a and 4a’) , trivalent (Figs. 4b and 4b’), and divalent (Figs. 4c and 4c’) configurations.
The LSD band picture, for both TbP (Fig. 4a) and TmTe (4a’), is characterized by a large, -derived, DOS at the Fermi level. A noticeable difference is observed with respect to the relative strength of the exchange and spin-orbit interactions. In TbP the exchange interaction dominates, which results in the splitting of the -states into majority spin states, situated at the bottom of the phosphorus -band, and minority spin states, situated at the Fermi level. In TmTe the spin-orbit interaction has become more important, splitting the thulium -states into and bands, with the exchange interaction being responsible for the additional splitting within each of the two groups of bands.
In spite of its interesting features, the band picture (Figs. 4a and 4a’) is an unphysical representation of the RX compounds, as the large DOS at the Fermi level is not observed experimentally. The trivalent scenarios of Figs. 4b and 4b’ are obtained by localizing respectively eight -electrons in TbP (Tb3+ Tb()), and twelve -electrons in TmTe (Tm3+ Tm()). Compared to the LSD scenario the trivalent configuration is found to be energetically more favourable by 700 mRy for TbP and 1200 mRy for TmTe. In TbP the seven majority spin states , as well as one of the minority spin states, are no longer available for band formation and hybridization and have vanished from the band picture in Fig. 4b. Similarly in the DOS for TmTe (Fig. 4b’), the localization of the six -electrons as well as six of the electrons, implies that only two -states are available for band formation. Notice that in the DOS plots only the band states are displayed, i.e. the itinerant valence states, including the delocalized -states. The localized ’s are not shown since the SIC-LSD approach, which after all is a one-electron ground state theory, does not give accurate removal energies of localized states due to electron-electron interaction effects,Svane (2006) and the neglect of screening and relaxation contributions.Temmerman et al. (1993)
The trivalent DOSs, in respectively Figs. 4b and 4b’, differ noticeably from each other, as in the former the Fermi level is situated in the gap between the filled phosphorus -band and the unoccupied -band, whilst in the latter the Fermi energy is pinned to the sharp -peak above the conduction band minimum. The P atom has three unoccupied -orbitals and in the TbP crystal it can accommodate three electrons from the Tb ion through charge transfer and hybridization which results in the filled -band of Fig. 4b. The Te atom on the other hand has one additional -electron in its outer shell, which is why the -band in TmTe can only accommodate two electrons, and as a consequence of this, here in the trivalent Tm scenario, the third electron is forced to occupy the -conduction band.
The variation in -orbital occupation is fundamental to the overall difference that we observe in figure 3 with respect to the ground state valency configurations of the pnictides and chalcogenides. Thus we find that when trying to localize an additional -electron in TbP, the resulting divalent configuration, depicted in figure 4c, is energetically unfavourable compared to the trivalent scenario in figure 4b by 250 mRy. The to localization is associated with charge transfer, and brings about the depopulation of the P -states, as indicated by the Fermi level being situated in the -band. The removal of the bonding states results in a considerable loss in hybridization and Madelung energy, which is not compensated by the gain in self-interaction energy, and the divalent scenario will therefore not be realized in TbP. In TmTe on the other hand, the localization transition from in Fig. 4b’ to in Fig. 4c’, is associated with a minor loss in band formation energy, given the vanishing width of the occupied -peak, and the gain in self-interaction (localization) energy is comparatively larger by 35 mRy. Accordingly, the divalent scenario of Fig. 4c’, becomes the ground state scenario for TmTe.
V.2 Electronegativity and lanthanide contraction
Apart from the fundamental difference between the pnictide and chalcogenide electronic structure, the observed energy trends in each series, as a function of R-ion in figure 2a and as a function of ligand in figure 2b, are determined by further factors such as ligand electronegativity, and lanthanide contraction.

These changes in electronic structure are presented schematically in Fig. 5. Here we depict the densities of states (DOS) for eight distinct scenarios observed throughout the rare earth compounds. Each DOS is composed of several rectangles, referring respectively to the ligand -states (situated lowest in energy), the rare-earth -states, and the localized and delocalized -states. The occupied states are indicated in blue. For both the pnictides and chalcogenides, the electronegativity decreases with increasing anion size, i.e. respectively from N to Bi and from O to Po. On the other hand, the -electron localization increases due to the lanthanide contraction, as we move through the rare earth series from Ce to Eu, and again from Gd to Yb. In terms of DOS, these two trends manifest themselves respectively via ligand -bands moving up in energy (towards lower binding energies), and unoccupied -states moving towards higher binding energies. In Fig. 5, the combined effect of these two trends is depicted in the two sets of DOSs respectively along the diagonals of the pnictide ((A) (C)) and chalcogenide compounds ((D) (F)). As the -states move towards lower energy they get pinned to the Fermi level and start filling up. Ultimately the degree of -band filling becomes such that the gain in energy associated with localizing the given -state becomes more important than the corresponding loss in band formation energy, and the divalent scenario becomes the ground state (scenarios (C’) and (F’)).Temmerman et al. (2007) As seen in Fig. 5, owing to the additional electron, in the chalcogenides the filling of -states sets in much earlier than in the pnictides, which explains why the trivalent scenario is relatively more dominant in the pnictides.
VI Electronic Properties
VI.1 Lattice parameters
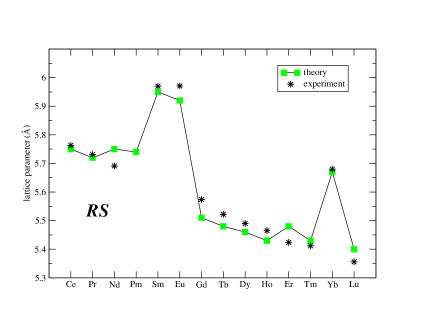
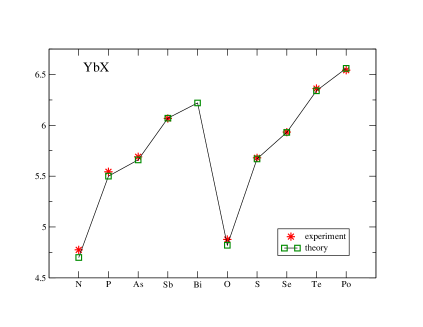
For each given compound, the calculated global energy minimum determines the equilibrium lattice parameter as well as the ground state. The calculated lattice parameters for the rare earth sulphides and the ytterbium pnictides and chalcogenides are compared to their experimental counterparts in respectively Figs. 6a and 6b. The agreement is good, reproducing the sudden increase in lattice parameter at SmS, EuS and YbS, due to the increased -electron localization. We have observed that quite systematically the calculated lattice parameters for the divalent and trivalent scenarios of a given compound differ by about 5 %. Therefore, a comparison to the experimental lattice parameters is expected to provide a good indication as to whether the calculations predict the correct ground state and valency configuration.
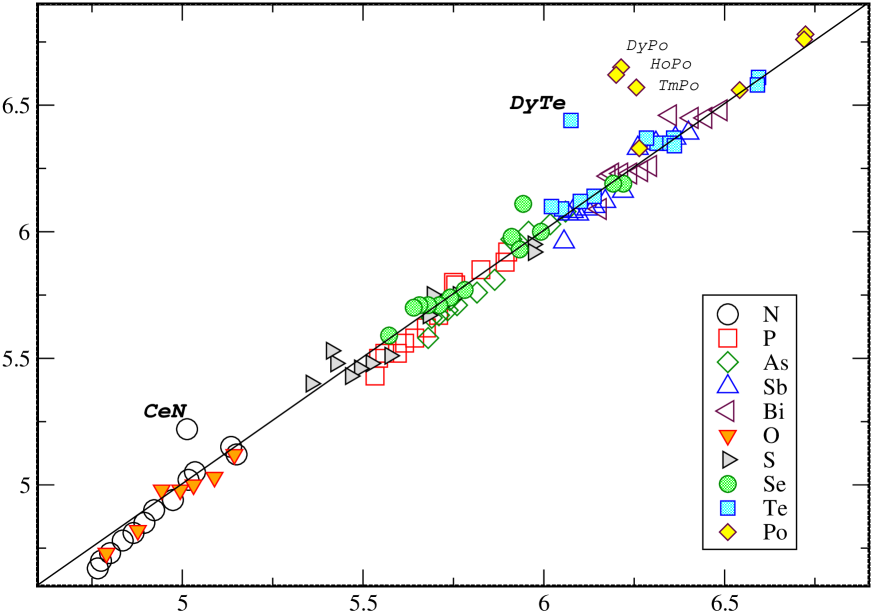
In Fig. 7, the experimental equilibrium lattice parameters for all the rare earth monopnictides and monochalcogenidesVillars and Calvert (1991) are plotted along the x-axis, whilst our calculated equilibrium counterparts are plotted along the y-axis. In this representation, the proximity of the data points to the line is a measure of the agreement between theory and experiment. We find that for the large majority of the compounds the calculated equilibrium lattice parameters lie within 1.5% of the experimental values, i.e. well below the 5% that would indicate a wrongly predicted ground state configuration. The only exceptions are CeN, DyTe, and three of the polonide compounds. With respect to the latter compounds, polonium is difficult to handle, and it is unclear to what degree the experimental results refer to stoichiometric samples.Kershner et al. (1966)
It is well established from rare earth halide dataJohnson (2006) as well as XPS measurements on the rare earth elementsJohansson (1979) that the divalent configuration becomes more competitive in Dy compounds due to the 3/4 filling of the -shell. The inclusion of the TE leads to a considerable reduction of for DyX compounds, as can be seen on the example of DySe in Fig. 1b, and quite generally gives rise to the negative dip around Dy in Fig. 2b. This trend reproduces overall very well the experimentally observed data,Patthey et al. (1993) however we wrongly predict a Dy2+ ground state in DyTe. This seems to indicate that in some cases we tend to overestimate the tetrad effect’s influence as a result of approximating the respective Slater integrals by the fully localized atomic limit instead of considering also corrections due to the solid state environment (screening/hybridization). For CeN, the experimental lattice parameter seems to suggest a tetravalent ground state,Jayaraman et al. (1975) whereas our calculations predict the trivalent configuration to be marginally more favourable than the tetravalent configuration by 3 mRy, which on the other hand could be indicative of an intermediate valency scenario implied by experiments.Baer et al. (1978)
In Fig. 7, the wrongly predicted ground state of DyTe shows up as noticeably off diagonal data point, but at the same time it also highlights the excellent agreement obtained for all the other cases investigated with the present approach. Thus, the SIC-LSD methodology is capable of predicting, with considerable accuracy, the ground state valency and lattice parameter of the rare earth monochalcogenides and monopnictides, and the associated ground state electronic structures can be expected to make valid predictions concerning the other physical properties of these materials.
VI.2 Electronic Phase Diagram
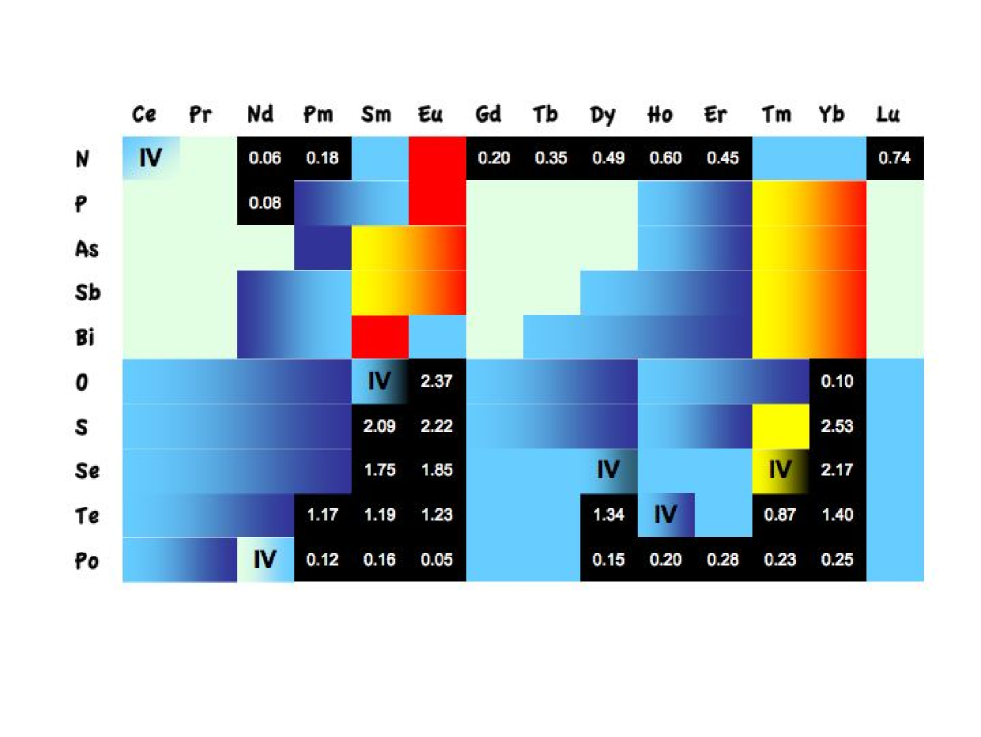
Here we concentrate on establishing global trends in the ground state electronic structure which we base on the calculated DOS at the Fermi energy, EF, as providing a guideline for predicting materials with specific properties when we systematically scan the full manifold of rare earth compounds. The corresponding results are summarized in the form of an ”electronic phase diagram” presented in Fig. 8, where based on the calculated DOS we distinguish between semiconductors, semi-metals, metals, and heavy fermion-like compounds.
Looking at the phase diagram, we see that our calculations predict a considerable number of compounds to be semiconductors. In particular, with respect to the pnictides, NdN, PmN and the majority of the rare earth nitrides from GdN onwards are found to be small gap semiconductors, with energy band gaps ranging from 0.06 eV in NdN to 0.6 eV in HoN. Few conclusive conductivity measurements for the nitrides exist, and it is for example still not fully established whether GdN is semiconductingGranville et al. (2006) or semi-metallic.Leuenberger et al. (2005) Our calculations predict GdN to be a semiconductor, although in an earlier SIC-LSD calculation, where spin-orbit coupling was not taken into account, a half-metallic ground state was observed instead.Aerts et al. (2004) All the divalent monochalcogenides turn out to be semiconductors, in good agreement with experiment. The divalent character implies that in the chalcogenide semiconductors the energy gap is brought about by localizing an additional -electron, as depicted through the transition from (F) to (F’) in Fig. 5, in variance to the energy gap observed in the trivalent nitride semiconductors, resulting from the filling of the unoccupied anion -states, as represented by scenario (A) in Fig. 5. In the SIC-LSD the occupied 4-levels tend to be situated at too low energies,Petit et al. (2010) as this ground state methodology can not reproduce the spectroscopy of an eventual experimentally observed mid-gap -level. For EuO, EuS, and YbS, the calculations overestimate the energy gaps by a factor 2.Steeneken et al. (2002); Jayaraman and Maines (1979)
The dominant part of the electronic phase diagram in Fig. 8 consists of metallic compounds. The indicated differences in conductivities can be straightforwardly related to the trends in electronic structure observed when moving along the diagonals in Fig 5. In the pnictides, the closing of the semiconducting gap due to the onset of pnictogen - rare earth overlap gives at first rise to a vanishingly small DOS, resulting in the semi-metals CeX to PrX and GdX to DyX (light blue areas). As the overlap gradually increases (due to decreasing electronegativity and/or increasing lanthanide contraction), the behaviour becomes fully metallic (dark blue areas), and eventually in the ”late” rare earths, with more and more of the -states getting occupied, heavy fermion-like behaviour sets in (yellow-red areas). The rare earth chalcogenides display less variety in terms of metallic behaviour. Here we start out with a partially occupied conduction band, and semi-metallic behaviour is not observed. Instead, as can be seen from Fig. 8, the rare earth systems, CeX to PmX, and GdX to ErX (apart from the polonides and a couple of tellurides) are metallic. Compared to the pnictides, in the late rare earth chalcogenides, the -states start filling even before they have moved far enough towards lower binding energies to achieve significant hybridization. Instead of forming a heavy metal, a relatively pure -state pins the Fermi level (scenarios (E) and (F) in Fig. 5) and the divalent semiconducting scenario (scenario (F’) in Fig. 5) correspondingly becomes energetically more favourable.
The agreement between observed and predicted properties is overall very good, except maybe for the calculated heavy fermion pnictides. Thus the ”late” rare earths, SmX, and YbX, are described as low carrier semi-metallic compounds, seemingly at odds with the large DOS at the Fermi level that is predicted in the SIC-LSD calculations. The experimentally observed large specific heat coefficient in these systems has been interpreted as heavy fermion behaviour by some authors,Ott et al. (1985) whilst others have explained it in terms of the Kondo effect.Monnier et al. (1990); Wachter (2001) Since our calculations are based on the effective one electron picture, they can not adequately describe the many-body physics of these compounds. However the large peak at the Fermi level that is calculated in the trivalent configuration indicates strong -mixing, i.e. a prerequiste for the hybridization between the narrow -peak and the sea of conduction electrons that underpins the Kondo effect. EuSb, YbBi, EuBi (as well as EuAs) do not actually crystallize in the NaCl structure investigated here,Horne et al. (2004) i.e., the very same pnictides that we find to be divalent or close to divalent do not occur in nature. As indicated schematically in Fig. 5, for the pnictides, localization of an additional -electron ((C) (C’) transition) implies the removal of some bonding -states. This, however, would destabilize the underlying NaCl crystal structure and, as a result of this competition between band formation and correlations, it seems that these materials prefer to distort and crystallize in a different structure altogether.
In Fig. 8 the compounds marked as ”intermediate valent” (IV) are those where the calculations find close to degenerate energy configurations, meaning either or is smaller than 5 mRy. Given the dual nature of the -electrons, it is to be expected that these materials are highly sensitive to environmental changes such as pressureSvane et al. (2004, 2001) or doping. In the phase diagram of Fig. 3 they correspond to the trivalent-divalent degenerate compounds in and around the white area, and to CeN, the only compound that is at the borderline of the tetravalent-trivalent degeneracy. For the Tm chalcogenides, it emerges from XPS measurements that TmS is metallic trivalent, TmSe is intermediate valent, and TmTe is semiconducting divalent.Bucher et al. (1975); Kinoshita et al. (1998) This, as can be seen from Fig. 8, exactly matches the valency sequence that we have derived from the SIC-LSD calculations. For SmS we find = -5.6 eV, indicating a divalent semiconductor, but given the small energy difference, susceptible to undergo a localization-delocalization transition under pressure,Svane et al. (2005) as has been observed experimentally.Henry et al. (1979) Apart from EuO, the rare earth monoxides do not appear to occur naturally, but a number of them have been synthesized under high pressure, where it has emerged that EuO and YbO are divalent semiconductors, CeO, PrO and NdO are trivalent metals, whilst SmO is a metal with the Sm in an intermediate valent state.Leger et al. (1981) These findings, including the intermediate valent nature of SmO, are again in excellent agreement with our predictions.
In summary, this effective one-electron SIC-LSD methodology accurately predicts the phase transitions associated with the -electron localization/delocalization. However, we should note here that because of the many-body effects, beyond those included in the SIC exchange-correlation energy functional, the representation of the calculated densities of states in terms of the described above phase diagram is most likely not the full picture of the underlying electronic structure. This is in particlular true in the ’IV’ and heavy fermion areas of the phase diagram, where those ’left out’ many-body interactions will introduce additional refinements into the physical trends based on SIC-LSD. Therefore, compounds that are situated in those areas provide the greater challenge and should be further investigated by methodologies such as the dynamical mean field theory (DMFT)Pourovskii et al. (2009) or GW.Chantis et al. (2007)
VII Conclusions and outlook
We have shown that the orbital dependent DFT approach, based on the LSD energy functional, appended by two important corrections, namely the self-interaction correction and the tetrad effect, can provide a global picture of the electronic structure of the rare earth monopnictides and monochalcogenides, expressed through the uncovered trends in their behaviour. We believe that this SIC-LSD based study provides an important understanding of the physical properties of these compounds. Although for a given compound the DMFT+LDA or GW approaches can give added insight into the details of the electronic structure, they can not at the present time be employed for large scale predictive studies given that they either depend on parameters and/or are very time consuming.
Our study has given rise to a unified picture of the ground state valency and valency transitions across the entire range of rare earth monopnictides and monochalcogenides, starting from tetravalency, through trivalency to divalency, as one moves from the early to late rare earths, in correlation with the ligands. We have also discovered the important links between the underlying electronic structure, valency and physical properties of these compounds, ranging from semiconducting to semi-metallic, metallic and even heavy-fermion-like behaviour.
The present study has also established that if the energy differences between the energetically relevant valency scenarios are small, then fluctuations will play an important role, giving rise to intermediate ground states. This effect can be described within the SIC-LSD formalism by mapping the valence (and also spin) fluctuations on to disorder in the spirit of the Hubbard III approach,Lüders et al. (2005) which we intend to apply in future to the ”intermediate” compounds identified in the present study.
Acknowledgments
This work made use of computational resources at the Danish Center for Scientific Computing (DCSC) and NW-GRID computers, the latter jointly provided by Daresbury Laboratory and the Universities of Lancaster, Liverpool and Manchester with funding from the North West Development Agency. We gratefully acknowledge helpful discussions with M. S. S. Brooks.
References
- Ortiz et al. (2009) C. Ortiz, O. Eriksson, and M. Klintenberg, Computational Materials Science 44, 1042 (2009).
- Hohenberg and Kohn (1964) P. Hohenberg and W. Kohn, Phys. Rev 136, B864 (1964).
- Kohn and Sham (1965) W. Kohn and L. J. Sham, Phys. Rev 140, A1133 (1965).
- von Barth and Hedin (1972) U. von Barth and L. Hedin, J. Phys. C: Sol. State Phys. 5, 1629 (1972).
- Fermi and Amaldi (1934) E. Fermi and E. Amaldi, Accad. Ital. Rome 6, 119 (1934).
- Temmerman et al. (2009) W. M. Temmerman, L. Petit, A. Svane, Z. Szotek, M. Lüders, P. Strange, J. B. Staunton, I. D. Hughes, and B. L. Gyorffy, in Handbook on the Physics and Chemistry of Rare Earths, edited by K. A. Gschneidner, J. C. G. Bünnzli, and V. K. Pecharsky (North-Holland, Amsterdam, 2009), vol. 39.
- Perdew and Zunger (1981) J. P. Perdew and A. Zunger, Phys. Rev. B 23, 5048 (1981).
- Temmerman et al. (2000) W. M. Temmerman, A. Svane, Z. Szotek, H. Winter, and S. V. Beiden, in Lecture Notes in Physics, edited by M. Dreyssé (Springer-Verlag, Berlin Heidelberg, 2000), vol. 535, p. 286.
- Svane et al. (2000) A. Svane, W. M. Temmerman, Z. Szotek, J. Lægsgaard, and H. Winter, Int. J. Quant. Chem. 77, 799 (2000).
- Svane (1996) A. Svane, Phys. Rev. B 53, 4275 (1996).
- Schmehl et al. (2007) A. Schmehl, V. Vaithyanathan, A. Herrnberger, S. Thiel, C. Richter, M. Liberati, T. Heeg, M. Röckerath, L. F. Kourkoutis, S. Mühlbauer, et al., Nature Materials 6, 882 (2007).
- LeClair et al. (2002) P. LeClair, J. K. Ha, J. M. Swagten, J. T. Kohlhepp, C. H. van de Vin, and W. J. M. de Jonge, Appl. Phys. Lett. 80, 625 (2002).
- Duan et al. (2007) C. G. Duan, R. F. Sabirianov, W. N. Mei, P. A. Dowben, S. S. Jaswal, and E. Y. Tsymbal, J. Phys.:Condens. Matter 19, 315220 (2007).
- Petukhov et al. (1996) A. G. Petukhov, W. R. L. Lambrecht, and B. Segall, Phys. Rev. B 53, 4324 (1996).
- Larson et al. (2007) P. Larson, W. R. L. Lambrecht, A. Chantis, and M. van Schilfgaarde, Phys. Rev. B 75, 045114 (2007).
- Antonov et al. (2004) V. N. Antonov, A. P. Shpak, and A. N. Yaresko, Condensed Matter Physics 7, 211 (2004).
- Ramsden et al. (2001) V. S. Ramsden, P. A. Watterson, G. P. Hunter, J. G. Zhu, W. M. Holliday, H. C. Lovatt, W. Wu, B. A. Kalan, S. C. Collocott, J. B. Dunlop, et al., Renewable Energy 22, 159 (2001).
- Jorgensen (1962) C. K. Jorgensen, in Orbitals in Atoms and Molecules (Academic, London, 1962).
- Nugent (1970) L. J. Nugent, J. Inorg. Nucl. Chem. 32, 3485 (1970).
- Racah (1942) G. Racah, Phys. Rev. 62, 438 (1942).
- Eriksson et al. (1990) O. Eriksson, M. S. S. Brooks, and B. Johansson, Phys. Rev. B 41, 7311 (1990).
- Andersen (1975) O. K. Andersen, Phys. Rev. B 12, 3060 (1975).
- Tyer et al. (2005) R. P. Tyer, P. A. Couch, K. K. van Dam, I. T. Todorov, R. P. Bruin, T. O. H. White, A. M. Walker, K. F. Austen, M. T. Dove, and M. O. Blanchard, Proceedings of the UK e-Science All Hands Meeting 2005 (2005).
- Calleja et al. (2004) M. Calleja, L. Blanshard, R. Bruin, C. Chapman, A. Thandavan, R. P. Tyer, P. Wilson, V. Alexandrov, R. J. Allen, J. Brodholt, et al., Proceedings of the UK e-Science All Hands Meeting 2004 ISBN 1-904425-21-6, 812 (2004).
- Petit et al. (2001) L. Petit, A. Svane, Z. Szotek, P. Strange, H. Winter, and W. M. Temmerman, J. Phys.: Condens. Matter 13, 8697 (2001).
- Johansson (1979) B. Johansson, Phys. Rev B. 20, 1315 (1979).
- Patthey et al. (1993) F. Patthey, E. L. Bullock, W. D. Schneider, and F. Hulliger, Z. Phys. B 93, 71 (1993).
- Svane (2006) A. Svane, Solid State Commun. 140, 364 (2006).
- Temmerman et al. (1993) W. M. Temmerman, Z. Szotek, and H. Winter, Phys. Rev. B 47, 1184 (1993).
- Temmerman et al. (2007) W. M. Temmerman, A. Svane, L. Petit, M. Lüders, P. Strange, and Z. Szotek, Phase Transitions 80, 415 (2007).
- Villars and Calvert (1991) P. Villars and L. D. Calvert, in Pearson’s Handbook of Cystallographic Data for Intermetallic Phases, 2nd ed. (ASM International, Ohio, 1991).
- Kershner et al. (1966) C. J. Kershner, R. J. DeSando, R. F. Heidelberg, and R. H. Steinmeyer, J. inorg. nucl. Chem. 28, 1581 (1966).
- Johnson (2006) D. A. Johnson, in Inorganic Chemistry in Focus III, edited by G. Meyer, D. Naumann, and L. Wesemann (Wiley-VCH, Weinheim, 2006), p. 1.
- Jayaraman et al. (1975) A. Jayaraman, W. Lowe, L. D. Longinotti, and E. Bucher, Phys. Rev. B 36, 366 (1975).
- Baer et al. (1978) Y. Baer, R. Hauger, C. Zürcher, M. Campagna, and G. K. Wertheim, Phys. Rev. B 18, 4433 (1978).
- Granville et al. (2006) S. Granville, B. J. Ruck, F. Budde, A. Koo, D. J. Pringle, A. R. H. Preston, D. H. Housden, N. Lund, A. Bittar, G. V. M. Williams, et al., Phys. Rev. B 73, 235335 (2006).
- Leuenberger et al. (2005) F. Leuenberger, A. Parge, W. Felsch, K. Fauth, and M. Hessler, Phys. Rev. B 72, 014427 (2005).
- Aerts et al. (2004) C. M. Aerts, P. Strange, M. Horne, W. M. Temmerman, Z. Szotek, and A. Svane, Phys. Rev B 69, 045115 (2004).
- Petit et al. (2010) L. Petit, A. Svane, Z. Szotek, W. M. Temmerman, and G. M. Stocks, Phys. Rev. B 81, 045108 (2010).
- Steeneken et al. (2002) P. G. Steeneken, L. H. Tjeng, I. Elfimov, G. A. Sawatzky, D. Ghiringhelli, N. B. Brookes, and D. J. Huang, Phys. Rev. Lett. 88, 047201 (2002).
- Jayaraman and Maines (1979) A. Jayaraman and R. G. Maines, Phys. Rev. B 19, 4154 (1979).
- Ott et al. (1985) H. R. Ott, H. Rudigier, and F. Hulliger, Solid State Commun. 55, 113 (1985).
- Monnier et al. (1990) R. Monnier, L. Degiorgi, and B. Delly, Phys. Rev. B 41, 573 (1990).
- Wachter (2001) P. Wachter, Physica B 300, 105 (2001).
- Horne et al. (2004) M. Horne, P. Strange, W. M. Temmerman, Z. Szotek, A. Svane, and H. Winter, J. Phys.: Condens. Matter 16, 5061 (2004).
- Svane et al. (2004) A. Svane, G. Santi, Z. Szotek, W. M. Temmerman, P. Strange, M. Horne, G. Vaitheeswaran, V. Kanchana, L. Petit, and H. Winter, phys. stat. sol. b 241, 3185 (2004).
- Svane et al. (2001) A. Svane, P. Strange, W. M. Temmerman, Z. Szotek, H. Winter, and L. Petit, phys. stat. sol. b 223, 105 (2001).
- Bucher et al. (1975) E. Bucher, K. Andres, F. D. di Salvo, J. P. Maita, A. C. Gossard, A. S. Cooper, and G. W. Hull, Phys. Rev. B 11, 500 (1975).
- Kinoshita et al. (1998) T. Kinoshita, Y. Ufuktepe, K. G. Nath, S. Kimura, H. Kumigashira, T. Takahashi, T. Matsumura, T. Suzuki, H. Ogasawara, and A. Kotani, J. Electron Spectrosc. Relat. Phenom. 88-91, 377 (1998).
- Svane et al. (2005) A. Svane, V. Kanchana, G. Vaitheeswaran, G. Santi, W. M. Temmerman, Z. Szotek, P. Strange, and L. Petit, Phys. Rev. B 71, 045119 (2005).
- Henry et al. (1979) D. C. Henry, K. J. Sisson, W. R. Savage, J. W. Schweitzer, and E. D. Cater, Phys. Rev. B 20, 1985 (1979).
- Leger et al. (1981) J. M. Leger, N. Yacoubi, and J. Loriers, J. Solid State Chem. 36, 261 (1981).
- Pourovskii et al. (2009) L. V. Pourovskii, K. T. Delaney, C. G. V. de Walle, N. A. Spaldin, and A. Georges, Phys. Rev. Lett. 102, 096401 (2009).
- Chantis et al. (2007) A. N. Chantis, M. van Schilfgaarde, and T. Kotani, Phys. Rev B 76, 165126 (2007).
- Lüders et al. (2005) M. Lüders, A. Ernst, M. Däne, Z. Szotek, A. Svane, D. Ködderitzsch, W. Hergert, B. L. Gyorffy, and W. M. Temmerman, Phys. Rev. B 71, 205109 (2005).