Three Dimensional Ising Model, Percolation Theory and Conformal Invariance
Abstract
The fractal structure and scaling properties of a 2d slice of the 3d Ising model is studied using Monte Carlo techniques. The percolation transition of geometric spin (GS) clusters is found to occur at the Curie point, reflecting the critical behavior of the 3d model. The fractal dimension and the winding angle statistics of the perimeter and external perimeter of the geometric spin clusters at the critical point suggest that, if conformally invariant in the scaling limit, they can be described by the theory of Schramm-Löwner evolution (SLEκ) with diffusivity of and , respectively, putting them in the same universality class as the interfaces in 2d tricritical Ising model. It is also found that the Fortuin-Kasteleyn (FK) clusters associated with the cross sections undergo a nontrivial percolation transition, in the same universality class as the ordinary 2d critical percolation.
pacs:
75.10.Hk, 05.50.+q, 11.25.Hf, 75.40.Mg, 61.43.HvConformal invariance plays the key role in the analytical
description of two-dimensional (2d) systems at their critical points
NC . One of the approaches to study the critical behavior of
spin models such as q-state Potts model () is the
geometrical approach based on percolation theory sahimi ; SA
and also finite-size scaling (FSS) relations supplied by conformal
field theory (CFT) BH ; Geometric . Fortuin-Kasteleyn (FK) bond
representation of Potts model gives a close relation between
percolation and thermal phase transition in which critical
singularities can be represented in terms of FK clusters FK .
An FK cluster can be constructed from a ”geometric” cluster
i.e., a set of nearest neighbor sites of like states, by assigning a
bond between each pair of sites with a certain temperature-dependent
probability. The FK clusters always percolate right at the critical
temperature . The percolation temperature for both FK and
geometric clusters of a q-state Potts model coincide only in
two dimensions.
Critical behavior of the interfaces of these
clusters in the scaling limit is conjectured, and in some cases
proven, to be described by the theory of Schramm-Löwner
evolution (SLEκ) schramm . The diffusivity
denotes the classification of conformally invariant interfaces whose
value for the hull and the external perimeter (EP) of an FK cluster,
and respectively, satisfy a duality relation
duplantier1 (for a review on SLE, see
SLE ). Another similar duality also holds in 2d, between the
hull of an FK cluster and the hull of a spin cluster. Considering
these two duality relations together, one finds that the hull of a
spin cluster and the EP of an FK cluster can be described with the
same . Many connections between SLE and various 2d systems
such as turbulence, spin glasses, growth models, sandpile models and
disordered Potts model have been recently noticed and discussed
applications .
For the Ising model, equivalent to Potts model, in three dimensions (3d) the percolation transition of geometric spin (GS) clusters occurs at some temperature well below the Curie point Muller-Krumbhaar . Thus, contrary to the FK clusters, the 3d geometric clusters do not capture the critical properties of the model. The question that arises is how the FK and GS clusters in a 2d cross sectional slice of the 3d Ising model behave and whether they reflect the critical properties of the 3d model. This is the main subject of the present letter.
In this letter we present the results of extensive Monte Carlo study
of 3d Ising model simulated by using Wolff’s algorithm wolff
based on single cluster update. We examine the FSS hypothesis for
some percolation observables on a 2d slice of the lattice,
indicating that the percolation threshold of the geometric clusters
coincides with the critical point. This is in agreement with the
observation of Dotsenko , in which the authors have found a
power-law scaling behavior in the length distribution of the loops
formed by an arbitrary cross section of the boundaries of 3d GS
clusters at . In this paper, we undertake a detailed and
systematic study of the statistical and percolation properties of
all GS clusters on an arbitrary cross section of the system. Note
that disjoint GS clusters on a 2d cross section may belong to a 3d
GS cluster. The scaling behavior of the GS clusters motivated us to
examine possible conformal invariance of the critical geometric
clusters which seem to undergo a continuous transition at the
threshold. We find that the perimeter and the EP of a GS cluster at
the critical point satisfy the duality relation and their fractal
dimensions and winding angle statistics are compatible, in the
scaling limit, with the family of conformally invariant curves i.e.,
SLEκ with and respectively. This latter is
in the same universality class as interfaces in tricritical Ising
model in two dimensions.
Our analysis of FK clusters on 2d slices also indicates that
these clusters undergo a nontrivial percolation transition at
, in the same universality class as
the classical bond percolation.
There exist some numerical investigations of 3d Ising model on special geometries with specific boundary conditions (bc) Janke ; Blote which confirm a linear relation between the scaling dimension of the operators of 3d systems and their correlation lengths. This relation has been given by Cardy cardy by exploiting the conformal group transformations.
In order to investigate the fractal structure of the GS clusters on
2d cross sectional slices of 3d Ising model, we first examine the
FSS hypothesis for some percolation observables i.e., percolation
probability , percolation strength , and the mean cluster
size . For this purpose, the simulation of 3d Ising model is
carried out by using the Wolff’s Monte Carlo algorithm wolff
on simple cubic (SC) lattices of different size with free bc,
and sizes up to . After discarding the first Monte
Carlo sweeps for equilibration, we then analyze the spin
configuration of a planar slice of the lattice parallel to the
xzplane located at
( denotes the integer part). We check
whether it contains a GS cluster which spans the plane in just a
certain direction e.g., zdirection. Therefore, we can
obtain the probability to have a spanning GS cluster at
temperature . We then measure the average mass of the largest
spin-cluster, . At each temperature, the averages are taken over
independent simulation runs and during each run another
average is taken over independent samples each of which is
taken after Monte Carlo steps 111The dynamic critical
exponent for the 3d Ising model simulated by the Wolff
algorithm has been reported in Tamayo . To ensure that the
sample configurations are equilibrated and statistically
independent, we considered the relaxation time , and
the time scale between two selected samples , much
larger than those reported in Tamayo .. This rather large
number of averages is needed to obtain smooth curves close enough to
the Curie point. The results are shown in Figs. 1 and
2 as a function of inverse temperature .
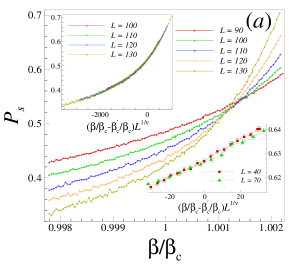
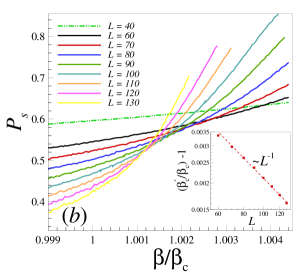
As shown
in Fig. 1, the curves computed for different
cross sectional lattice sizes for sufficiently near sizes, cross at
the same point very close to the Curie point, implying that the
scaling dimension of the percolation probability is zero. This
agrees with what is expected from scaling theory BH which
states that the curves should have the form . The exponent characterizes
the divergence of the correlation length as the percolation
threshold is approached, . Note
that here is proportional to the spatial extent of the GS
clusters in 2d slices of the 3d Ising model 222The two point
spin-spin correlation function in the original 3d Ising model is
equal to the pair connectedness function of 3d FK clusters, i.e.,
, which
equals the probability that points and belong to the same FK
cluster Hu . The corresponding correlation length of the 3d
Ising model which is proportional to the spatial extent of the 3d FK
clusters is characterized by the well-known exponent .
.
By utilizing the data collapse, it is possible to estimate the values of the exponent and the crossing point of the curves . To measure the quality of the collapse of the curves we define a function as a function of the chosen values of and (the smaller is indicative of a better quality of the collapse see Kawashima ; Bhattacharjee and appendix of HH ). We find its minimum for values and , confirming the percolation threshold of the 2d GS clusters at the Curie point. Applying these values for and , rescaling of the data for different lattice sizes fall onto a universal curve (see upper inset of Fig. 1()). However crossing point of the curves is slightly different from , but if one does not consider this discrepancy, the proper data collapse would not be achieved because, due to the relatively small value of , the factor would magnify this discrepancy along the axis and thus the curves do not collapse onto a single function. This effect will be more evident when one zooms in around zero on the axis. We find that the crossing point moves towards the Curie point for larger system sizes (Fig. 1()). Considering the curve for as a reference curve, we find that the crossing point of the other curves for different sizes with this reference curve i.e., , behaves like , with , which is independent of . Therefore, to obtain a proper collapse even close enough to the crossing point, we need to measure with high precision which is possible for only two curves. An example of such collapse is shown in the lower inset of Fig. 1(), for system sizes and . However, our estimation for the exponent is not accurate and has to be reevaluated by considering the corrections-to-scaling effects.
In order to check that the coincidence between the percolation threshold of the 2d GS clusters and the Curie point is not specific to the considered lattice geometry, i.e., SC structure, we repeated the Monte Carlo computations for a face-centered cubic (FCC) lattice. Note that both and depend on lattice geometry. We find again their coincidence for the FCC lattice.
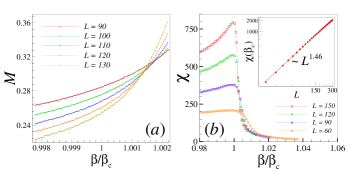
We have also computed the percolation strength , as the order
parameter in the percolation, and the mean cluster size (Fig.
2). We find that, at the Curie point scales as
, with . These are indicative of a
continuous transition of 2d GS clusters.
These scaling arguments
suggest a fractal structure for 2d GS clusters, meaning that at
there exists a set of GS clusters and their surrounding
loops at all scales.
In order to investigate manifestation of conformal invariance in the critical behavior of the GS clusters on the cross sections, we analyze statistical properties of the boundaries of these clusters and compare them with the SLE curves. We first measure the fractal dimension of the cluster boundaries and check the duality relation. The fractal dimension of SLE curves is given by , and the duality conjecture duplantier1 states that the EP of SLE hulls for looks locally as SLE curves but with a dual value .
We undertook extensive Monte Carlo simulations with anisotropic geometry to obtain a reliable estimate of the fractal dimension at the Curie point (the value of has been determined to a high precision in Ref. T_c ). We present the results of calculations for rather large system sizes of , with , and . The periodic boundary condition was applied along all three directions. After equilibration, we collected a number of () of independent spin configurations on a planar cross section of the 3d sample located at for smallest (largest) system size. Each configuration was taken after the Monte Carlo steps. We then identified all GS clusters on each cross section of a fixed size , and marked all spanning clusters (if exist) along the zdirection. For each spanning cluster, a walker was applied to determine each of its perimeters which connect the lower boundary to the upper one along the zdirection. The walker was forced to start moving from a node on the dual lattice (which is also a square lattice) lied at the most left (right) site belonging to the spanning cluster on the lower boundary, by using the turn-right (left) tie-breaking rule Saberi and thereby, for each size , an ensemble of interfaces was obtained. It is shown in Saberi that using these tie-breaking rules, one can obtain the interfaces on a square lattice without any ambiguity compatible with the conformal invariant properties of critical lattice models. According to each interface, the EP was also determined as the border of the corresponding interface after closing off all its boundary narrow passageways of lattice spacing .
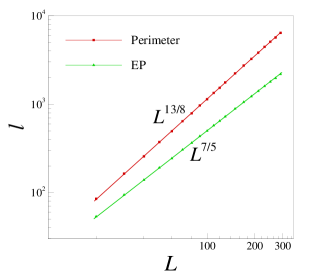
For fractal interfaces, their average length , measured in units of lattice spacing (which is set to unity here), scales as a function of the system size as where is the fractal dimension. Applying this relation for the ensemble of the perimeters and the EPs, we find their fractal dimensions equal to and , respectively. These results give rise to and for the perimeter and EP of a GS cluster, respectively, comparable with ones for SLE curves with diffusivity and , which satisfy the duality relation (we find , comparable with the exact one ). To show this consistency, we have compared the results of our simulations with those predicted for SLE curves in Fig. 3. The exponent obtained in Dotsenko for the hull of the GS clusters is also in a good agreement with our result with .
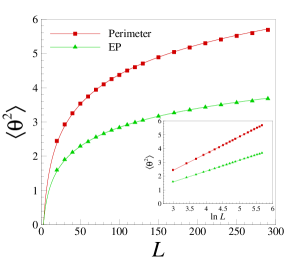
To verify further the consistency between the statistical behavior of the interfaces of GS clusters in a 2d cross section of the 3d Ising model and the SLE curves with and , let us now examine their winding angle statistics which is predicted by the theory of SLE for critical interfaces schramm . We use the definition given in wilson . For each interface, an arbitrary winding angle is attributed to the first edge (which is taken to be zero here). The winding angle for the next edge is then defined as the sum of the winding angle of the present edge and the turning angle to the new edge measured in radians. It is shown that wilson the variance in the winding grows with the system size like
| (1) |
where is a constant whose value is irrelevant. As shown in Fig. 4, the winding angle statistics of GS interfaces are in a good agreement with those of the corresponding SLE curves. We find that and .
The point which has to be explained and discussed here is the seeming discrepancy between the exponents obtained from the direct percolation properties of the GS clusters and the ones obtained by analyzing the fractal properties of their hull and external perimeter. The latter study gives rise to a connection between statistical behavior of the boundaries of GS clusters in a 2d cross section of the 3d Ising model with those of FK clusters in a pure 2d tricritical Ising model, while the values of the geometrical exponents obtained in the first part of the paper are obviously not those predicted for tricritical Ising model at its thermal critical point. Although we do not have a full description of such discrepancy, its resolution seems to lie on natural difference between GS and FK clusters. Moreover, the notion of conformal invariance in the statistical behavior of the hull and external perimeter of GS clusters requires extraction of the statistics of the Loewner driving function and showing that it is a Brownian motion, which is very hard to do on small samples such as ours. These will be investigated in details in a future work.
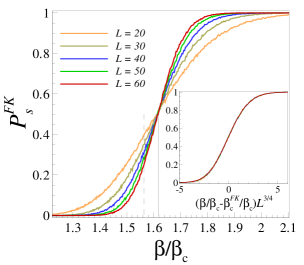
So far, we have focused only on the statistical properties of GS clusters. We now present the results of the same study for the FK clusters built up on a 2d spin configuration by assigning a bond between each pair of nearest neighbor sites of the like spins with probability . Our analysis indicates that the percolation transition of the FK clusters occurs at (shown by the vertical solid line in Fig. 5). This is obtained by computing the percolation probability shown in Fig. 5, with the same procedure as for GS clusters. We find that the critical behavior of these clusters is in the same universality class as the 2d critical percolation. As shown in the inset of Fig. 5, all curves fall well onto a universal curve with the same correlation exponent i.e., as for classical bond percolation. The percolation threshold of 2d bond percolation on a square lattice is located at which is determined by the vertical dashed line in the Fig. 5, at , indicative of a nontrivial percolation transition at . The latter is expected due to the condensation of the majority spins at low temperatures. The analysis of the statistical properties of the perimeter and EP of FK clusters will appear in the forthcoming paper.
We would like to thank J. Cardy and M. Sahimi for their constructive comments and M.M. Sheikh-Jabbari for critical reading of the manuscript. A.A.S. acknowledges financial support by the National Elite Foundation (Bonyad-e-Melli-e-Nokhbegan) of Iran, and INSF grant No. 87041917.
References
- (1) B. Nienhuis and J. Cardy, in: Phase Transitions and Critical Phenomena, edited by C. Domb and J.L. Lebowitz (Academic, London, 1987), Vol. 11.
- (2) M. Sahimi, Applications of Percolation Theory (Taylor Francis, London, 1994).
- (3) D. Stauffer and A. Aharony, Introduction to Percolation Theory, 2nd ed. (Taylor Francis, London, 1994).
- (4) K. Binder and D.W. Heermann, Monte Carlo Simulation in Statistical Physics, Springer, Berlin, (1997).
- (5) B. Nienhuis, J. Phys. A 15, 199 (1982); A. Coniglio, Phys. Rev. Lett. 62, 3054 (1989); A.L. Stella and C. Vanderzande, Phys. Rev. Lett. 62, 1067 (1989); H.W.J. Blöte et al, Phys. Rev. Lett. 68, 3440 (1992); B. Duplantier, J. Stat. Phys. 110, 691 (2003); Y. Deng et al, Phys. Rev. E 69, 026123 (2004); W. Janke and A.M.J. Schakel, Nucl. Phys. B, 700, 385 (2004) Phys. Rev. E 71, 036703 (2005); W. Janke and M. Weigel, Phys. Lett. B, 639, 373 (2006).
- (6) P.W. Kasteleyn and C.M. Fortuin, J. Phys. Soc. Jpn. 46 (Suppl.), 11 (1969); C.M. Fortuin and P.W. Kasteleyn, Physica (Amsterdam) 57, 536 (1972).
- (7) O. Schramm, Isr. J. Math. 118, 221 (2000).
- (8) B. Duplantier, Phys. Rev. Lett. 84, 1363 (2000).
- (9) J. Cardy, Ann. Physics 318, 81 (2005); M. Bauer and D. Bernard, Phys. Rep. 432, 115 (2006).
- (10) D. Bernard et al., Nat. Phys. 2, 124 (2006); D. Bernard et al., Phys. Rev. Lett. 98, 024501 (2007); C. Amoruso et al., Phys. Rev. Lett. 97, 267202 (2006); D. Bernard et al., Phys. Rev. B 76, 020403(R) (2007); J.P. Keating et al., Phys. Rev. Lett. 97, 034101 (2006); A.A. Saberi et al., Phys. Rev. Lett. 100, 044504 (2008); A.A. Saberi et al., Phys. Rev. E 77, 051607 (2008); A.A. Saberi and S. Rouhani, Phys. Rev. E 79, 036102 (2009); A.A. Saberi et al., Phys. Rev. E 79, 031121 (2009); J.L. Jacobsen et al., Phys. Rev. Lett. 102, 070601 (2009); A.A. Saberi et al. Phys. Rev. E 82, 020101(R) (2010); A.A. Saberi, Appl. Phys. Lett 97, 154102 (2010); C. Chatelain, J. Stat. Mech. (2010) P08004; F. Gliozzi and M.A. Rajabpour, J. Stat. Mech. (2010) L05004; J.D. Stevenson and M. Weigel, arXiv:1010.5973.
- (11) H. Muller-Krumbhaar, Phys. Lett. 48 A vec, 459 (1974).
- (12) U. Wolff, Phys. Rev. Lett. 62, 361 (1989).
- (13) V.S. Dotsenko et al., Nucl. Phys. B, 448, 577 (1995); Phys. Rev. Lett. 71, 811 (1993).
- (14) M. Weigel and W. Janke, Phys. Rev. Lett. 82, 2318 (1999); Europhys. Lett. 51, 578 (2000).
- (15) Y. Deng and H.W.J. Blöte, Phys. Rev. Lett. 88, 190602 (2002).
- (16) J.L. Cardy, J. Phys. A 17, L385 (1984); J. Phys. A 18, L757 (1985).
- (17) P. Tamayo et al., J. Stat. Phys., 58, 1083 (1990).
- (18) C,-K. Hu, Phys. Rev. B 29, 5103 (1984).
- (19) N. Kawashima and N. Ito, J. Phys. Soc. Jpn. 62, 435 (1993).
- (20) S. M. Bhattacharjee and F. Seno, J. Phys. A 34, 6375 (2001).
- (21) J. Houdayer and A.K. Hartmann, Phys. Rev. B 70, 014418 (2004).
- (22) H.W.J. Blöte et al, Int. J. Mod. Phys. C, 10, 1137 (1999).
- (23) A.A. Saberi, J. Stat. Mech., P07030 (2009).
- (24) B. Wieland and D.B. Wilson, Phys. Rev. E, 68, 056101 (2003).