The Galactic Plane at faint X-ray fluxes - I: Properties and characteristics of the X-ray source population
Abstract
We investigate the serendipitous X-ray source population revealed in XMM-Newton observations targeted in the Galactic Plane within the region 315∘ 45∘ and 2.5∘. Our study focuses on a sample of 2204 X-ray sources at intermediate to faint fluxes, which were detected in a total of 116 XMM-Newton fields and are listed in the 2XMMi catalogue. We characterise each source as spectrally soft or hard on the basis of whether the bulk of the recorded counts have energies below or above 2 keV and find that the sample divides roughly equally (56%:44%) into these soft and hard categories. The X-ray spectral form underlying the soft sources may be represented as either a power-law continuum with or a thermal spectrum with kT keV, with ranging from . For the hard sources, a significantly harder continuum form is likely, i.e., , with . For 50% of the hard sources, the inferred column density is commensurate with the total Galactic line-of-sight value; many of these sources will be located at significant distances across the Galaxy implying a hard band luminosity , whereas some will be extragalactic interlopers. A high fraction (90%) of the soft sources have potential near-infrared (2MASS and/or UKIDSS) counterparts inside their error circles, consistent with the dominant soft X-ray source population being relatively nearby coronally-active stars. These stellar counterparts are generally brighter than J=16, a brightness cutoff which corresponds to the saturation of the X-ray coronal emission at . In contrast, the success rate in finding likely infrared counterparts to the hard X-ray sample is no more than down to J=16 and down to J=20, set against a rapidly rising chance coincidence rate. The make-up of the hard X-ray source population, in terms of the known classes of accreting and non-accreting systems, remains uncertain.
keywords:
surveys – X-rays: general – X-rays: stars – X-rays: binaries1 Introduction
The brightest sources discovered in the first all-sky surveys conducted at X-ray wavelengths (e.g., Uhuru, Forman et al. 1978; Ariel V, Warwick et al. 1981), were found to be X-ray luminous close binary systems powered by the accretion of matter onto a compact object. These sources, with intrinsic X-ray luminosities (LX) typically in the range erg s-1 in the 2–10 keV band, can be classed either as low-mass or high-mass X-ray binaries (LMXBs or HMXBs) depending on the nature of the non-degenerate star, the companion objects being either neutron stars or black holes. X-ray catalogues of the time also contained a few examples of other types of Galactic X-ray source, including X-ray bright supernova remnants, cataclysmic variables (CVs) and coronally-active binaries, such as RSCVn systems, albeit with inferred X-ray luminosities typically much less than erg s-1.
Later more sensitive X-ray surveys utilising imaging instruments operating in a somewhat softer spectral regime (e.g., Einstein, Hertz & Grindlay 1984; ROSAT, Voges et al. 1999) showed that the X-ray sky at low Galactic latitude is crowded, with nearby coronally-active stars and binaries dominating the source statistics in the soft ( 2 keV) X-ray band (Motch et al. 1997). Subsequently, an imaging survey in the Galactic plane carried out by ASCA (Sugizaki et al. 2001) provided a first detailed view of the general population of faint Galactic X-ray sources in the 2–10 keV band. Since the impact of X-ray absorption by interstellar gas is greatly diminished above 2 keV, the ASCA survey was able to detect hard-spectrum sources with X-ray luminosities markedly lower than those of the classical Galactic X-ray binaries across a significant fraction of the inner Galaxy.
More recently, the improved sensitivity, spatial resolution and energy range afforded by the Chandra and XMM-Newton observatories has provided the opportunity to revisit the issue of the faint Galactic source populations in both the soft and hard X-ray bands. For both missions, the fields-of-view of the on-board X-ray cameras are such that in a typical low-latitude pointing, in addition to the primary target, many tens of serendipitous sources are seen. Both missions have also invested observing time in studying specific regions of the Galactic plane, most notably the Galactic centre, through both deep pencil-beam observations (Ebisawa et al. 2001; Ebisawa et al. 2005; Muno et al. 2003; Muno et al. 2004; Hong et al. 2009; Revnivtsev et al. 2009) and mini-surveys in which wider angle coverage is achieved by the mosaicing of multiple (relatively short) observations (Wang et al. 2002; Hands et al. 2004; Wijnands et al. 2006; Muno et al. 2006; Muno et al. 2009). The outcome is that 10 years post-launch both the Chandra and XMM-Newton archives contain a wealth of data relevant to Galactic X-ray sources at intermediate to faint flux levels, spanning a wide range of intrinsic luminosity.
Recent results from Chandra and XMM-Newton demonstrate the potential of Galactic X-ray surveys, at readily accessible sensitivity limits, to detect a wide variety of source types. For instance, coronally-active binaries can be detected at distances up to 1 kpc or beyond (Herent et al. 2006) and young stellar objects (YSOs) can be unveiled in regions of current star-formation. In the case of the latter, evolved protostars and TTauri stars with extreme coronal emission and hard X-ray spectra (kT1-4 keV) can be detected in dense molecular clouds despite the large line-of-sight column density (e.g., Feigelson & Montmerle 1999). Isolated Neutron Stars (ISNs), such as those discovered in the ROSAT survey (Haberl 2007), are radio-quiet objects located at distances of no more than a few hundred parsecs that display soft thermal X-ray spectra. CVs constitute a source class that may, potentially, be found in large numbers in sensitive Galactic X-ray surveys. In particular, it has been proposed that intermediate polars may account for a large fraction of the low LX sources which reside in the Galactic Centre region (Muno et al. 2006) and through their integrated emission may account for a significant fraction of the hard Galactic X-ray Ridge emission (Sazonov et al. 2006; Revnivtsev et al. 2006). Relatively quiescent X-ray binaries with either low-mass (e.g., black hole transients) or high-mass (e.g., Be star) secondaries may also make a non-negligible contribution to the source statistics.
However, in truth, our knowledge of the makeup of the Galactic X-ray source population at relatively faint levels is quite limited. This is certainly the case in the 2–10 keV band where, in principle, the visible volume extends to the edge of the Galaxy. In order to better define the various populations in terms of their space density, scale height and luminosity function, we need to characterise and, where possible, identify much larger samples of sources than are currently available. More comprehensively characterised source samples might also reveal how X-ray sources map onto structures such as the Galactic spiral arms, the thin and thick disc, the Galactic bulge and the mass concentration within 100 pc of the Galactic Centre. A range of astrophysical issues, for example, relating to the formation and evolution of close binary systems and accretion at low mass-transfer rates, might also be addressed.
In the above context, the Chandra Multiwavelength Plane (ChaMPlane) Survey is aiming at a systematic analysis of low-latitude fields with the objective of measuring or constraining the populations of low-luminosity ( LX erg s-1) accreting white dwarfs, neutron stars, and stellar mass black holes in the Galactic plane and bulge (see Grindlay et al. 2005 for full details). The programme utilises Chandra X-ray data in combination with follow-up optical and IR photometric and spectroscopic observations, so as to maximise the number of identified sources and explore the populations thereby revealed. Recent publications from the ChaMPlane programme include a study of Chandra fields in the Galactic anti-centre (Hong et al. 2005) and the Galactic centre and bulge (Laycock et al. 2005; Koenig et al. 2008; Hong et al. 2009; van den Berg et al. 2009).
In the case of XMM-Newton, the XMM-Newton Galactic Plane Survey (hereafter XGPS; Hands et al. 2004) has sampled a flux range which bridges the gap between the relatively shallow ASCA Galactic Plane Survey (Sugizaki et al. 2001) and the sensitivity limits reached in deep Chandra pointings (e.g., Ebisawa et al. 2001). In a paper reporting the XGPS, Hands et al. (2004) discussed the results from a programme including 22 pointings which cover a region of approximately 3 square degrees between 19°- 22° in Galactic longitude and 0.6° in latitude. Subsequent optical follow-up observations of a representative sample of the brightest identified low-latitude hard band sources detected in the XGPS have recently been presented by Motch et al. (2010).
In the present paper, we build on the XGPS studies of Hands et al. (2004) by carrying out a systematic investigation of the X-ray source population seen at intermediate to faint fluxes in XMM-Newton pointings targeted at the Galactic plane. More specifically, we consider observations encompassing a narrow strip of the Plane towards the central quadrant of the Galaxy. In the next section of this paper, we give details of the set of XMM-Newton observations which provide the basis of the study. In Section 3, we describe the selection criteria we employ to extract a clean “serendipitous” X-ray source sample from these fields, using the 2XMMi catalogue (Watson et al. 2009) as the input database. Section 4 goes on to investigate various properties of the sample with a focus on the available X-ray spectral information. In section 5 we present an investigation of the likely near-infrared counterparts based on a cross-correlation of the X-ray sample with both the 2MASS and UKIDSS surveys. This leads on to a discussion of the nature of the soft- and hard-source populations in section 6, followed by a brief summary of our conclusions of this first paper (Paper I). In subsequent papers (in preparation), we will explore the average X-ray spectral properties of a subset of relatively bright sources drawn from our source sample (Paper II), the log N - log S curves for both the soft and hard source samples (Paper III), and the broad-band colours of likely counterparts to the X-ray sources (Paper IV).
2 The XMM-Newton Galactic Plane Database
In this paper we utilise observations drawn from the XMM-Newton public data archive targeted at positions along the Galactic plane within the central quadrant of the Galaxy. More specifically we use observations with pointings in the region bounded by 315∘ 45∘ and 2.5∘. Our preliminary list of observations comprised those used in constructing the 2XMMi catalogue (Watson et al. 2009) - see Fig. 1. However, given our focus on the serendipitous source content of the XMM-Newton fields, we excluded those fields dominated by a very bright source, which in most cases was the target source. We also excluded a number of observations otherwise dominated by the target, such as those containing nearby star clusters or bright extended emission arising from supernova remnants. In some instances we excised the region within the field of view dominated by the bright emission but retained the rest of the observation. Observations which significantly overlapped with other deeper observations were also removed, although fields with fractional overlaps giving mosaiced coverage of particular regions were retained. A couple of observations with relatively short net exposures affording only poor sensitivity were also discarded.
This filtering process resulted in a final list of 116 observations which comprise the present survey. Details of the set of selected observations are given in Table 1 and the corresponding distribution of pointing directions along the Galactic plane is illustrated in Fig. 1. In brief, Table 1 provides the following information for each field: column 1 - the XMM-Newton observation ID; columns 2-3 - the nominal observation pointing position in Galactic coordinates (l,b); columns 4-6 - net exposure time in the three EPIC cameras; columns 7-9 - the filter deployed in each EPIC camera; column 10 - the fraction of the total field of view retained in those fields in which a sub-region was excluded; columns 11-13 - the number of sources detected in the field which pass the selection criteria defined in §3 (both the total number and the split between the soft and hard assignments are given).
Most of the observations were performed with the three EPIC cameras (pn, MOS-1 and MOS-2; Strüder et al. 2001; Turner et al. 2001) in operation in a Full-Frame Window mode for which all the pixels of all the CCDs are read out and the full field-of-view is covered. For five of the observations no suitable pn data were available. Although, in most cases, the Medium filter was selected, there were a few occasions when either the Thin1 or Thick filters were deployed (see Table 1). The distribution of the effective exposure time, calculated as the average of the individual pn, MOS1 and MOS2 exposures, with a double weighting for the more sensitive pn instrument, is illustrated in Fig. 2; the minimum effective exposure was 1.5 ks and the maximum 71.3 ks. The total sky area covered by the set of survey fields was 22.5 sq.deg.

| Observation | Pointing | Exposure (ks) | Filter | FoV | Sources | |||||||
|---|---|---|---|---|---|---|---|---|---|---|---|---|
| ID | pn | MOS1 | MOS2 | pn | MOS1 | MOS2 | Fraction | total | soft | hard | ||
| 0400910201 | 318.9 | 0.5 | 9.5 | 11.6 | 11.6 | Med | Med | Med | 13 | 12 | 1 | |
| 0405390401 | 323.4 | 1.7 | 12.4 | 16.6 | 16.3 | Med | Med | Med | 0.97 | 13 | 8 | 5 |
| 0400890101 | 325.9 | 1.8 | 15.4 | 21.6 | 23.2 | Thin1 | Thin1 | Thin1 | 0.88 | 27 | 19 | 8 |
| 0203910101 | 327.2 | 0.1 | 7.1 | 8.7 | 8.7 | Med | Med | Thin1 | 0.95 | 16 | 10 | 6 |
| 0143380101 | 328.4 | 0.2 | 0.0 | 50.0 | 50.2 | Thick | Thick | 0.98 | 34 | 26 | 8 | |
| 0406650101 | 331.7 | 0.6 | 24.7 | 31.6 | 31.6 | Med | Med | Thin1 | 61 | 47 | 14 | |
| 0406750201 | 333.8 | 0.1 | 6.0 | 7.6 | 7.6 | Med | Med | Med | 18 | 13 | 5 | |
| 0403280201 | 334.7 | 0.0 | 7.5 | 9.9 | 11.1 | Med | Med | Med | 0.82 | 23 | 16 | 7 |
| 0201000401 | 335.6 | 0.4 | 18.1 | 21.0 | 21.3 | Thin1 | Thin1 | Thin1 | 0.98 | 32 | 20 | 12 |
| 0022140101 | 336.4 | 0.2 | 4.3 | 13.8 | 14.7 | Med | Med | Med | 0.97 | 8 | 5 | 3 |
| 0204500301 | 337.1 | 0.0 | 30.7 | 32.6 | 32.6 | Thin1 | Thin1 | Thin1 | 0.88 | 28 | 15 | 13 |
| 0307170201 | 337.4 | 0.3 | 60.0 | 81.2 | 84.0 | Med | Med | Med | 70 | 48 | 22 | |
| 0303100101 | 337.8 | 0.1 | 38.3 | 45.3 | 45.7 | Med | Med | Med | 0.97 | 51 | 37 | 14 |
| 0200900101 | 343.1 | 0.1 | 23.9 | 27.3 | 27.6 | Med | Med | Med | 28 | 15 | 13 | |
| 0406752301 | 343.9 | 0.0 | 2.7 | 3.5 | 4.3 | Med | Med | Med | 9 | 3 | 6 | |
| 0112460201 | 345.0 | 2.5 | 20.9 | 27.7 | 27.9 | Med | Med | Med | 26 | 12 | 14 | |
| 0406750301 | 345.3 | 0.0 | 6.1 | 7.6 | 7.6 | Med | Med | Med | 18 | 13 | 5 | |
| 0144080101 | 345.7 | 0.2 | 10.9 | 16.9 | 16.9 | Med | Med | Med | 28 | 18 | 10 | |
| 0401960101 | 348.9 | 0.5 | 15.5 | 19.2 | 20.3 | Med | Med | Med | 28 | 18 | 10 | |
| 0103261201 | 350.5 | 0.5 | 4.3 | 6.7 | 6.7 | Med | Med | Med | 8 | 5 | 3 | |
| 0112201401 | 354.1 | 0.1 | 4.6 | 6.3 | 6.4 | Med | Med | Med | 0.77 | 7 | 3 | 4 |
| 0301730101 | 357.6 | 0.1 | 59.8 | 61.5 | 61.5 | Thick | Thick | Thick | 0.95 | 67 | 40 | 27 |
| 0103261301 | 358.6 | 1.0 | 5.0 | 7.6 | 7.6 | Med | Med | Med | 10 | 2 | 8 | |
| 0206990101 | 358.6 | 2.2 | 7.9 | 13.5 | 13.5 | Med | Med | Med | 43 | 28 | 15 | |
| 0406580201 | 358.8 | 0.5 | 14.1 | 18.4 | 19.1 | Med | Med | Med | 21 | 9 | 12 | |
| 0400340101 | 359.1 | 0.5 | 17.2 | 20.2 | 22.3 | Med | Med | Med | 0.95 | 25 | 10 | 15 |
| 0304220101 | 359.3 | 0.9 | 0.0 | 7.5 | 7.7 | Med | Med | 0.98 | 5 | 4 | 1 | |
| 0112970701 | 359.6 | 0.0 | 19.4 | 23.4 | 23.4 | Med | Med | Med | 59 | 13 | 46 | |
| 0302884301 | 359.7 | 0.3 | 5.0 | 6.5 | 6.5 | Med | Med | Med | 19 | 6 | 13 | |
| 0112971001 | 359.9 | 0.3 | 11.3 | 11.3 | 11.5 | Thick | Med | Med | 26 | 15 | 11 | |
| 0112971901 | 0.0 | 0.3 | 4.2 | 7.5 | 7.2 | Med | Med | Med | 11 | 3 | 8 | |
| 0307110101 | 0.0 | 1.6 | 13.3 | 21.2 | 21.9 | Med | Med | Med | 24 | 14 | 10 | |
| 0206590201 | 0.3 | 2.2 | 17.0 | 20.5 | 20.5 | Med | Med | Med | 42 | 29 | 13 | |
| 0112971501 | 0.6 | 0.0 | 6.9 | 9.3 | 9.3 | Med | Med | Med | 14 | 7 | 7 | |
| 0112970201 | 0.9 | 0.1 | 12.9 | 17.4 | 17.4 | Med | Med | Med | 0.98 | 38 | 15 | 23 |
| 0305830701 | 0.9 | 0.8 | 3.0 | 4.0 | 4.4 | Med | Med | Med | 3 | 1 | 2 | |
| 0205240101 | 1.0 | 0.1 | 15.1 | 32.8 | 34.3 | Med | Med | Med | 40 | 16 | 24 | |
| 0302570101 | 1.0 | 1.9 | 27.1 | 31.1 | 31.1 | Med | Med | Med | 60 | 34 | 26 | |
| 0148090501 | 3.3 | 0.3 | 6.5 | 8.8 | 8.7 | Thin1 | Thin1 | Thin1 | 16 | 8 | 8 | |
| 0301881001 | 6.1 | 1.2 | 14.1 | 15.9 | 14.8 | Med | Med | Med | 17 | 9 | 8 | |
| 0301540101 | 6.1 | 1.9 | 18.2 | 21.3 | 21.2 | Thin1 | Thin1 | Thin1 | 36 | 21 | 15 | |
| 0135742301† | 6.7 | 0.3 | 3.5 | 4.1 | 4.2 | Med | Med | Med | 0.81 | 4 | 3 | 1 |
| 0135742501† | 6.8 | 0.0 | 2.3 | 2.8 | 2.9 | Med | Med | Med | 0.71 | 3 | 2 | 1 |
| 0135742601† | 7.0 | 0.3 | 4.0 | 4.9 | 4.9 | Med | Med | Med | 10 | 8 | 2 | |
| 0135742801† | 7.2 | 0.0 | 4.7 | 5.8 | 6.0 | Med | Med | Med | 17 | 16 | 1 | |
| 0135742901† | 7.3 | 0.3 | 4.4 | 6.1 | 6.3 | Med | Med | Med | 12 | 10 | 2 | |
| 0135743101† | 7.5 | 0.0 | 4.9 | 6.6 | 6.6 | Med | Med | Med | 9 | 7 | 2 | |
| 0099760201 | 7.6 | 1.4 | 39.3 | 41.6 | 41.4 | Med | Med | Med | 55 | 22 | 33 | |
| 0145840201 | 9.4 | 1.0 | 19.7 | 25.4 | 25.7 | Thin1 | Thin1 | Thin1 | 54 | 38 | 16 | |
| 0164561401 | 10.0 | 0.2 | 0.0 | 32.0 | 32.6 | Med | Med | 0.92 | 21 | 13 | 8 | |
| 0152832801† | 10.3 | 0.3 | 7.6 | 9.4 | 9.4 | Med | Med | Med | 13 | 8 | 5 | |
| 0152832901† | 10.3 | 0.3 | 5.6 | 8.5 | 8.5 | Med | Med | Med | 9 | 6 | 3 | |
| 0145840101 | 10.4 | 0.1 | 20.2 | 26.2 | 26.5 | Thin1 | Thin1 | Thin1 | 33 | 18 | 15 | |
| 0152833001† | 10.5 | 0.0 | 5.7 | 8.2 | 8.3 | Med | Med | Med | 0.93 | 13 | 10 | 3 |
| 0301270401 | 10.7 | 0.2 | 29.3 | 39.0 | 22.0 | Med | Med | Med | 0.96 | 46 | 32 | 14 |
| 0152833101† | 10.7 | 0.3 | 7.0 | 8.7 | 8.7 | Med | Med | Med | 9 | 7 | 2 | |
| 0024940201 | 10.8 | 0.4 | 22.5 | 25.2 | 25.2 | Med | Med | Med | 0.98 | 50 | 33 | 17 |
| 0152833401† | 11.0 | 0.3 | 7.0 | 8.7 | 8.7 | Med | Med | Med | 22 | 17 | 5 | |
| 0152835101† | 11.5 | 0.0 | 1.4 | 4.8 | 5.5 | Med | Med | Med | 3 | 2 | 1 | |
| 0152835501† | 11.7 | 0.3 | 1.7 | 3.6 | 3.5 | Med | Med | Med | 4 | 3 | 1 | |
| 0152835701† | 11.7 | 0.3 | 8.0 | 10.7 | 10.7 | Med | Med | Med | 17 | 10 | 7 | |
| Observation | Pointings | Exposure ( ks) | Filter | FoV | Sources | |||||||
|---|---|---|---|---|---|---|---|---|---|---|---|---|
| ID | pn | MOS1 | MOS2 | pn | MOS1 | MOS2 | Fraction | total | soft | hard | ||
| 0152835401† | 11.8 | 0.0 | 1.2 | 3.0 | 3.2 | Med | Med | Med | 3 | 1 | 2 | |
| 0150960301 | 13.3 | 1.3 | 1.1 | 4.8 | 5.0 | Med | Med | Med | 3 | 3 | 0 | |
| 0152835001† | 14.8 | 0.0 | 6.9 | 8.5 | 8.5 | Med | Med | Med | 20 | 11 | 9 | |
| 0152834401† | 15.0 | 0.3 | 4.2 | 8.7 | 9.5 | Med | Med | Med | 11 | 8 | 3 | |
| 0152834501† | 15.0 | 0.3 | 4.2 | 8.9 | 9.5 | Med | Med | Med | 11 | 4 | 7 | |
| 0152834601† | 15.2 | 0.0 | 3.7 | 6.1 | 6.3 | Med | Med | Med | 7 | 2 | 5 | |
| 0152834801† | 15.3 | 0.3 | 3.7 | 7.0 | 7.1 | Med | Med | Med | 8 | 6 | 2 | |
| 0152834901† | 15.5 | 0.0 | 5.0 | 8.4 | 8.4 | Med | Med | Med | 18 | 9 | 9 | |
| 0040140201 | 17.5 | 0.1 | 12.3 | 11.3 | 12.3 | Med | Med | Med | 18 | 7 | 11 | |
| 0054540701 | 18.0 | 0.7 | 0.0 | 23.1 | 23.0 | Med | Med | 0.98 | 15 | 6 | 9 | |
| 0104460701 | 19.2 | 0.0 | 5.4 | 8.4 | 7.6 | Med | Med | Med | 11 | 6 | 5 | |
| 0051940101† | 19.4 | 0.3 | 4.8 | 7.8 | 7.8 | Med | Med | Med | 10 | 5 | 5 | |
| 0135745401† | 19.6 | 0.0 | 11.3 | 13.7 | 13.7 | Med | Med | Med | 13 | 6 | 7 | |
| 0051940301† | 19.8 | 0.3 | 6.1 | 9.1 | 9.1 | Med | Med | Med | 9 | 3 | 6 | |
| 0051940401† | 19.8 | 0.3 | 5.7 | 9.1 | 9.1 | Med | Med | Med | 16 | 10 | 6 | |
| 0104460301 | 20.0 | 0.0 | 7.7 | 11.2 | 11.0 | Med | Med | Med | 18 | 10 | 8 | |
| 0051940601† | 20.2 | 0.3 | 1.4 | 3.8 | 3.8 | Med | Med | Med | 2 | 1 | 1 | |
| 0051940501† | 20.2 | 0.3 | 6.8 | 9.6 | 9.6 | Med | Med | Med | 10 | 4 | 6 | |
| 0104460401 | 20.4 | 0.0 | 5.3 | 10.3 | 10.0 | Med | Med | Med | 9 | 1 | 8 | |
| 0135740701† | 20.6 | 0.3 | 4.8 | 7.3 | 7.4 | Med | Med | Med | 8 | 2 | 6 | |
| 0135745801† | 20.6 | 0.3 | 11.5 | 13.2 | 13.2 | Med | Med | Med | 15 | 3 | 12 | |
| 0104460901 | 20.8 | 0.0 | 11.3 | 13.6 | 13.6 | Med | Med | Med | 16 | 3 | 13 | |
| 0135740901† | 21.0 | 0.3 | 4.8 | 7.8 | 7.7 | Med | Med | Med | 11 | 5 | 6 | |
| 0135745901† | 21.0 | 0.3 | 5.8 | 9.1 | 9.5 | Med | Med | Med | 7 | 2 | 5 | |
| 0135745201† | 21.2 | 0.0 | 4.8 | 7.1 | 7.3 | Med | Med | Med | 7 | 5 | 2 | |
| 0122700801 | 21.3 | 0.8 | 12.5 | 15.0 | 14.8 | Med | Med | Med | 0.94 | 14 | 5 | 9 |
| 0112201001 | 21.4 | 1.3 | 0.0 | 4.4 | 4.5 | Med | Med | 4 | 2 | 2 | ||
| 0135745701† | 21.4 | 0.3 | 5.7 | 7.4 | 7.4 | Med | Med | Med | 10 | 5 | 5 | |
| 0135746801† | 21.4 | 0.3 | 2.7 | 4.4 | 4.4 | Med | Med | Med | 7 | 2 | 5 | |
| 0135746301† | 21.6 | 0.0 | 4.3 | 6.7 | 6.7 | Med | Med | Med | 6 | 2 | 4 | |
| 0135746401† | 21.8 | 0.3 | 1.7 | 4.3 | 4.5 | Med | Med | Med | 5 | 1 | 4 | |
| 0135741601† | 21.8 | 0.3 | 4.7 | 7.7 | 7.7 | Med | Med | Med | 11 | 1 | 10 | |
| 0135741701† | 22.0 | 0.0 | 3.6 | 6.5 | 6.8 | Med | Med | Med | 6 | 0 | 6 | |
| 0135744801† | 22.2 | 0.3 | 1.1 | 1.8 | 2.0 | Med | Med | Med | 2 | 1 | 1 | |
| 0302560301 | 23.2 | 0.3 | 15.1 | 17.9 | 18.2 | Med | Med | Med | 22 | 9 | 13 | |
| 0400910101 | 23.4 | 0.1 | 10.2 | 12.1 | 12.1 | Med | Med | Med | 11 | 3 | 8 | |
| 0203850201 | 24.3 | 0.1 | 5.3 | 6.8 | 7.2 | Med | Med | Med | 0.89 | 10 | 6 | 4 |
| 0400910301 | 25.4 | 0.1 | 7.5 | 9.1 | 9.1 | Med | Med | Med | 20 | 11 | 9 | |
| 0301880401 | 27.7 | 0.6 | 8.4 | 10.2 | 10.1 | Med | Med | Med | 6 | 3 | 3 | |
| 0302970301 | 28.4 | 0.1 | 22.7 | 26.7 | 26.7 | Med | Med | Med | 28 | 18 | 10 | |
| 0301880901 | 29.1 | 1.5 | 14.9 | 16.6 | 16.6 | Med | Med | Med | 0.88 | 17 | 7 | 10 |
| 0046540201 | 29.5 | 0.1 | 6.7 | 8.0 | 8.4 | Med | Med | Med | 7 | 3 | 4 | |
| 0406140201 | 29.8 | 0.7 | 17.0 | 18.5 | 18.5 | Med | Med | Med | 0.98 | 15 | 4 | 11 |
| 0302970801 | 30.3 | 0.5 | 11.7 | 15.5 | 15.6 | Med | Med | Med | 28 | 21 | 7 | |
| 0203850101 | 30.8 | 0.0 | 20.6 | 25.2 | 25.2 | Med | Med | Med | 0.97 | 31 | 18 | 13 |
| 0203910201 | 31.3 | 0.1 | 5.4 | 11.8 | 12.2 | Med | Med | Med | 0.85 | 6 | 6 | 0 |
| 0207010201 | 31.1 | 0.2 | 17.4 | 18.7 | 18.7 | Med | Med | Med | 0.89 | 7 | 1 | 6 |
| 0211080101 | 32.4 | 2.1 | 3.3 | 6.8 | 6.6 | Thin1 | Thin1 | Thin1 | 7 | 6 | 1 | |
| 0136030101 | 32.4 | 0.1 | 17.8 | 21.4 | 21.9 | Med | Med | Med | 0.90 | 27 | 15 | 12 |
| 0306170201 | 32.7 | 0.5 | 9.9 | 11.5 | 11.5 | Thin1 | Med | Med | 0.98 | 7 | 4 | 3 |
| 0017740601 | 33.0 | 2.0 | 20.0 | 22.3 | 22.3 | Med | Med | Med | 34 | 15 | 19 | |
| 0017740401 | 33.1 | 0.0 | 25.7 | 27.7 | 27.7 | Med | Med | Med | 0.77 | 16 | 8 | 8 |
| 0302970201 | 36.7 | 0.1 | 2.7 | 10.0 | 13.3 | Med | Med | Med | 6 | 3 | 3 | |
| 0136030201 | 38.5 | 0.0 | 13.3 | 16.0 | 16.0 | Med | Med | Med | 0.98 | 10 | 6 | 4 |
| 0305580201 | 43.0 | 0.8 | 22.3 | 27.8 | 28.2 | Med | Med | Med | 0.89 | 22 | 6 | 16 |
† Observations corresponding to the Galactic X-ray Survey Programme (XGPS)
3 Defining a serendipitous source sample
As the starting point for the compilation of a serendipitous X-ray source sample, we extracted a complete list of the sources detected in the 116 designated fields from the Second XMM-Newton Serendipitous Source Catalogue (2XMMi; Watson et al. 2009). The 2XMMi catalogue provides extensive details of the source properties including the net count rate and detection maximum likelihood of each source in five separate energy bands: Band 1 (0.2-0.5 keV); Band 2 (0.5-1.0 keV); Band 3 (1.0-2.0 keV); Band 4 (2.0-4.5 keV): and Band 5 (4.5-12.0 keV). This information is provided for each of the three EPIC instruments.
A preliminary step involved dealing with the relatively small number of observations in which instrument filters other than the medium filter were deployed. In these cases the recorded count rates measured in each camera and in each energy band were scaled to equivalent values for the medium filter, where the scale factors applied were derived from the ratio of the appropriate energy conversion factors (ECF) quoted in Mateos et al. (2009) 111These ECFs are calculated assuming a broad-band source spectrum, characterised as a power-law continuum with photon index = 1.7 absorbed by a line-of-sight column density = 31020 cm-2..
In our study of intermediate to faint Galactic Plane sources, it has proven convenient to compress the available spectral information into two bands, a soft band representing the combination of Bands 2 and 3, encompassing the energy range 0.5–2 keV, and a hard band based on Bands 4 and 5, corresponding to 2–12 keV. The 2XMMi Band 1 information has not been used in this analysis. The count rates measured in each EPIC camera for the soft and hard bands were obtained as the straight sum of the rates recorded in the respective input bands. We also calculated an effective detection maximum likelihood (maxl) in the soft and hard bands by the prescription given in the SAS emldetect documentation (see also Mateos et al. 2008).
A further compression of the information for each detected source was achieved by combining the count rates measured in the different cameras for the soft band and, separately, for the hard band. For the count-rate measurements for a particular source in a given camera to be considered valid, a requirement was that the 2XMMi source parameter, frac, should be greater than for that camera (i.e., that at least of the source response was contained within the camera’s active field-of-view). Count-rate measurements passing this criterion were included irrespective of whether the source was classed as detected or not in the camera/band combination under consideration (see below). The actual compression process involved first averaging valid MOS-1 and MOS-2 count rates using a statistical weighting to give a combined-MOS count rate estimate and then scaling the latter measurement to pn equivalent units222The scale factor for converting the combined-MOS to pn count rates was determined for each band on the basis of the average pn:combined-MOS count rate ratio derived for the full source sample. Finally the scaled-MOS and pn measurements were averaged, again using a statistical weighting, to give the final soft- and hard-band count rates. In following this process, the resultant source count rates may derive from one, two or three measurements depending on which combination of cameras were producing valid data for the source. Hereafter in this paper we quote count rates in the soft, hard and total (softhard) bands for the combined EPIC cameras in units of pn count ks-1.
The first step in excising relatively low-significance sources from the full 2XMMi source list involved the setting of a threshold value of maxl = 10 for the soft/hard band detection. Sources were only retained in the source list if this threshold was exceeded in either the soft or hard bands (or both) and in one or more of the EPIC cameras. For a source detection to be classed as valid in a particular camera, we required frac in that camera. Further criteria for source removal included the 2XMMi parameter Extent 0 (i.e., the exclusion of all non-pointlike sources) and the SUM-FLAG 3 (i.e., a quality check to exclude sources described as “located in an area where spurious detections may occur and may possibly be spurious” - see Watson et al. 2009).
After filtering the original 2XMMi source list using the above methodology, we visually inspected the soft- and hard-band images of each field (produced from the standard data products available from the XMM-Newton archive). As a result a number of sources classified at this stage as “valid detections” were flagged for removal. Frequently such source exclusions stemmed from the confusion of one source with another, generally brighter, object. A few sources embedded in bright diffuse regions were also removed. At this point we also excluded regions encompassing an obvious bright target source - essentially by spatially masking areas within the observation field of view. On occasion, regions affected by bright extended objects or by the scattering rings from very bright out-of-field-of-view sources were also excluded. Observations in which the target region or other specific regions have been excluded are flagged in Table 1.
Implementation of the above selection process left us with a catalogue of 2700 sources. A source could be included in this list based on a nominal detection (above a maximum likelihood threshold of 10) in just one band and one camera. Visual inspection suggested that at the limit, such sources were typically quite faint and in some cases potentially unreliable. Since a detailed analysis of the reliability of 2XMMi sources as a function of the detection maximum likelihood threshold was beyond the scope of the investigation (but see Watson et al. 2009; Mateos et al. 2009), we instead employed an empirical approach to arrive at a robust final source catalogue based on a further signal-to-noise selection. More specifically, we calculated the ratio of the count rate to count-rate error for each source using the combined camera measurements. We then set a minimum requirement that this ratio should exceed a value of 4 in the soft and/or hard bands. This further selection resulted in the exclusion of 252 sources detected only in the pn camera and 101 (133) sources seen only in the MOS-1 (MOS-2) cameras, with just 10 sources removed for which there was a simultaneous detection in more than one camera.
After applying all the above, we were left with a catalogue of 2204 point sources drawn from the 116 survey fields. Table 2 summarises the source detection statistics in terms of the soft/hard bands and the pn/MOS-1/MOS-2 cameras.
Although the field selection described in §2 involved the exclusion of duplicate observations of the same target or pairs of observations with fields-of-view which significantly intersect, some modest degree of field overlap was permitted. As a consequence of this overlap, there are a total 44 source duplications in the total of 2204, i.e., 2% of the sample. Within these 44 sources, 30 of which are soft detections and 14 hard, there are two instances of the same source being twice duplicated. In the following analysis we have ignored this duplication and treated all 2204 entries as individual sources.
| Camera | Soft-Band | Hard-Band | Both Soft | All |
|---|---|---|---|---|
| Only | Only | and Hard | ||
| pn onlya | 349 | 222 | 18 | 589 |
| MOS-1 onlya | 55 | 57 | 3 | 115 |
| MOS-2 onlya | 56 | 67 | 7 | 130 |
| Multipleb | 626 | 453 | 291 | 1370 |
| Total | 1086 | 799 | 319 | 2204 |
a Detections in a single camera only
b Detections in at least two cameras
4 Properties of the Source Sample
4.1 Spatial distribution
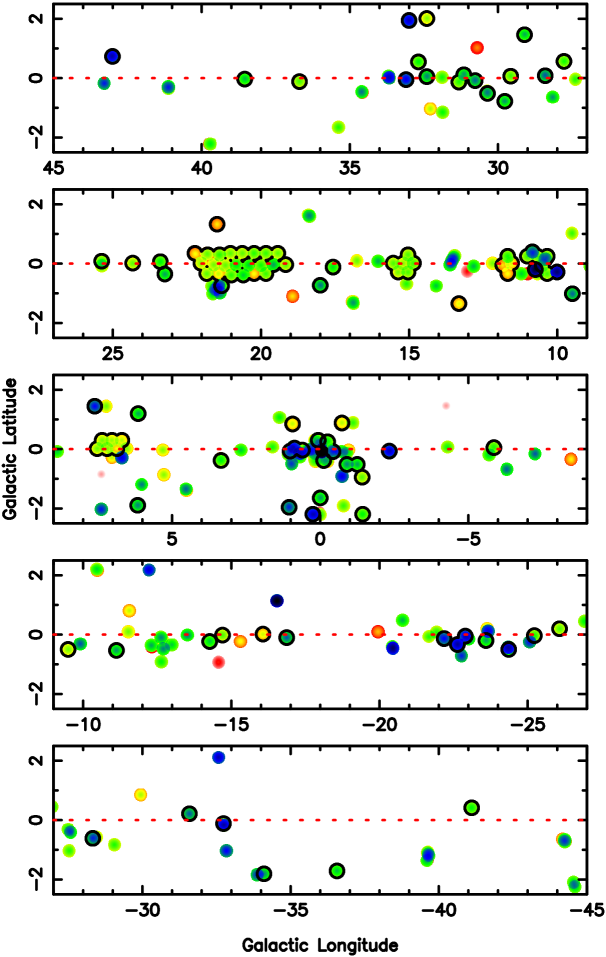
The distribution in Galactic longitude and latitude of the sources which comprise our serendipitous source sample is illustrated in Fig 3. These are the observed distributions without any correction applied for sky coverage or for the depth of the underlying observations.
It is evident from Figs. 1 and 3 that the coverage of the Galactic plane by XMM-Newton is far from uniform. Near the Galactic Centre, within 2∘, there is an obvious concentration of pointings. Similarly the regions near l = 7∘, 11∘, 15∘ and between 19∘-22∘ have relative good coverage in narrow strips along the Plane. The latter corresponds to the “XGPS region” studied by Hands et al. (2004), whereas the other three directions have enhanced coverage as a result of later phases of the XGPS programme. The observations drawn from the XGPS programme are flagged as such in Table 1 - generally these consist of sequences of relatively short exposures with some overlapping of the fields of view so as to give extended, albeit shallow, sky coverage.

4.2 Flux calibration and distribution
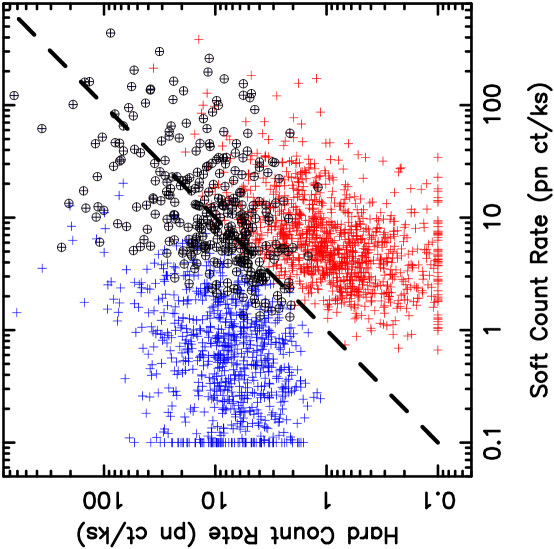
The distribution of measured total count rate for the source sample is illustrated in Fig. 4. Although the full distribution extends over 3 decades, of the sources have total count rates in the range 2-100 pn ct ks-1. Figure 5 shows how the total count rate splits between the soft and hard bands. Roughly 50% of the sources are detected only in the soft band, with 36% detected only in the hard band and just 14% detected in both bands (see Table 2). With the objective of dividing the sample into non-overlapping soft and hard subsets, we calculate a broad-band hardness ratio, , where S and H refer to the soft-band and hard-band count rates respectively. We then use HR=0, corresponding to the diagonal line in Fig. 5, (i.e., equal soft and hard count rates), as the boundary between the two designations. This provides a close match to the soft-only and hard-only detections; on the other hand, for the sources detected in both bands, the division somewhat favours the hard category. Hereafter we refer to sources as soft or hard depending on their position relative to the fiducial. On this basis there are 1227 soft sources and 977 hard sources in our sample.
Given the very different characteristics of the underlying source populations (see below), different spectral forms have been assumed for the soft and hard sources in deriving factors to convert the measured count rates to energy flux. In both bands we apply a spectral model consisting of a power-law continuum of photon index subject to line-of-sight absorption in a column density, . For the soft sources, the spectral parameters were set to = 2.5 and = 1021 cm-2 resulting in an energy conversion factor (ECF) of 4.91011 ct cm2 erg-1, where both the count rate and unabsorbed energy flux relate to the 0.5–2 keV band. For the hard sources, we use = 1.0 and = 31022 cm-2 leading to an ECF of 7.91010 ct cm2 erg-1, applicable to the 2–10 keV band. For a source with a nominal count rate of 2 pn ct ks-1 in the soft band, the equivalent unabsorbed flux is 410-15 erg s-1 cm-2 (0.5–2 keV). The same count rate in the hard band equates to an unabsorbed flux of 2.510-14 erg s-1 cm-2 (2–10 keV).

4.3 X-ray Spectral properties
Fig. 6 shows the distribution of the broad-band hardness ratio, HR, for the source sample. The distribution has a saddle-like form, with a broad minimum centred around HR0 separating maxima at, or near, the two extremes. We note that our focus on source detections in either the soft or hard bands (or both) might introduce a bias against sources of intermediate hardness in which the count rate is spread fairly evenly across the two spectral channels. However, when we plot the distribution in Fig. 6 including only relatively bright sources (e.g., sources with a total count rate greater than 20 ct/ks) the saddle distribution remains broadly unchanged. We conclude that the underlying source population splits rather cleanly into the designated soft and hard categories.

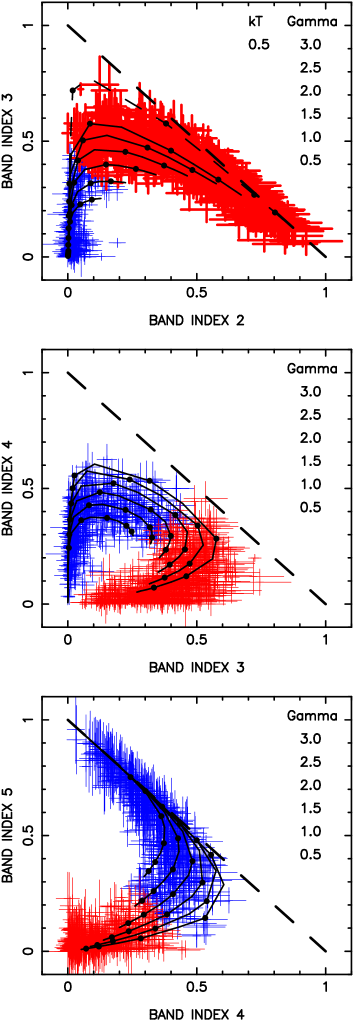
We have also investigated the spectral distribution of the sources with respect to the four 2XMMi bands, namely Bands 2-5. In this context a standard approach is to use X-ray two-colour diagrams, where each axis represents a different hardness ratio calculated for a pair of (adjacent) bands. However, for our sample which is strongly affected by absorption, the tendency was for such diagrams to be either dominated by errors (due to low intrinsic count rates in both selected bands) or, at least, very compressed along one axis. We have avoided this problem by calculating instead a set of Band Index () values, where -N is calculated simply as the count rate in Band N normalised to the total source count rate (i.e., in this case the sum of the count rates in Bands 2–5). The comparison of BI values for adjacent bands - see Fig. 7, then provides very similar information to a set of two-colour hardness ratio diagrams. We note that “quantile” analysis, as described by Hong et al. (2004), represents an alternative strategy for investigating the spectral properties of source samples in the low count rate limit.
Each diagram in Fig. 7 shows a smoothly varying distribution representing the range of source characteristics from the hardest through to the softest spectral forms. A rough calibration of this spectral diversity is provided by the model curves in Fig. 7, which correspond to power-law spectra with ranging from 0.5–3, subject to absorption ranging from . However, the sources with the softest spectra are not quite accommodated by the limits and in the -2 versus -3 diagram and are, in fact, better represented by a thermal (Mekal) spectrum with the same limiting and keV (the dashed curve in the top panel of Fig. 7). From the -3 versus -4 diagram, it is evident that transition from our soft to hard characterisation occurs for (depending on the slope of the continuum). In the hard spectral regime represented by the -4 versus -5 diagram, one finds that the bulk of the signal is contained in Bands 4 and 5 for . Evidently, there are a significant number of sources with -5 , implying in excess of , provided the underlying continuum is not exceedingly flat ().
4.4 Column density constraints
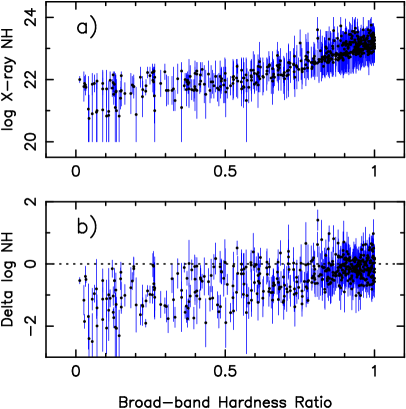
We have used the measured values to set more specific constraints on the line-of-sight column density for each source. Assuming an absorbed power-law spectral model, we calculated a two-dimensional array of values (one such array for each of the four spectral bands 2–5), with log along the x-axis (log in steps of 0.1) and the assumed along the y-axis ( in steps of 0.1). For a given source, we identified the region in each array bounded by the measured value and its error bar (we actually used errors corresponding roughly to 90% confidence combined in quadrature with a 2% systematic). The full constraint was then derived by taking the minimum bound on log consistent with all four plots. We set the final estimate for log as the mid-point of the bound and took the half-width of the bound as the error. This simple recipe worked well333The procedure is, of course, only an approximation to detailed model fitting of the available X-ray spectral data. Nevertheless it provides very useful indicative results. when applied to the hard source sample, but was of more limited value for soft sources, where the range of power-law models represents a poor match to the underlying (thermal) spectra.
The result of applying the above procedure to the hard sample is illustrated in Fig. 8(a), which shows the X-ray derived values versus the source broad-band hardness ratio, HR. Although the errors for individual sources are typically quite large ( in log , on average), there is a clear trend with ranging from to as HR varies from 0–1. Fig. 8(b) shows the comparison of the column density derived from the X-ray measurements with the total Galactic column density in the source direction, as inferred from the infrared dust measurements of COBE/DIRBE and IRAS/ISSA (Schlegel et al. 1998). From this plot it is evident that, for hardness ratio values HR 0.8, which represents 50% of the hard sample, the X-ray is very comparable to the total Galactic column density. In this regime, the X-ray source could be either embedded in a localised high density region (perhaps intrinsic to the X-ray source), located at a significant distance across the Galactic Plane or be an extragalactic interloper. We consider the latter possibility in section 6.2.
Finally, we note that the X-ray values derived for the hard source sample show a clear dependence on Galactic longitude and latitude, albeit with a large point-to-point scatter. Sources located within 2.5∘of the Galactic Centre have values typically a factor 2 higher than those found outside of this region, the average in the Galactic Centre direction being . Similarly, sources located within 1∘of the Galactic plane typically have four times the column density of sources which are 1∘– 2.5∘off the plane.

5 Near-Infrared Counterparts
The identification and characterisation of longer-wavelength counterparts represents a crucial step in determining the nature of Galactic X-ray sources. The ideal starting point for this would be a sub-arcsecond imaging survey in a set of wavebands not too strongly influenced by Galactic absorption, with commensurate high precision astrometry. At present a comprehensive dedicated image database of this quality is not available for the XMM-Newton survey fields. However, we have conducted a systematic investigation based on cross-correlations with two near-infrared surveys which are available, namely 2MASS and UKIDSS.
5.1 Cross-correlation with 2MASS
The Two Micron All Sky Survey (2MASS) (Cutri et al. 2003; Skrutskie et al. 2006) provides uniform coverage of the entire sky in three near-infrared (NIR) bands, namely in J (1.25), H (1.65) and Ks (2.17) on a scale of 2.0″(this is the pixel size of 2MASS images; the FWHM of the PSF was typically 2.5″-3.0″). At high latitude the nominal survey completeness is 15.8, 15.1 and 14.3, respectively. However, in the Galactic Plane the measured source counts turn down at limits one magnitude (or more) brighter, because of the effects of source confusion on the detection thresholds. The astrometric uncertainty is generally less than , although this may be compromised in very confused regions.
As a first step, we cross-correlated our X-ray source sample with the 2MASS catalogue and, for each X-ray source position, extracted the set of 2MASS sources within a radius of 20″. A total of 27485 2MASS sources were associated with the 2204 X-ray source positions via this process. Here we use the X-ray source position and position error quoted in the 2XMMi catalogue for the individual source observations (parameters: RA, DEC, poserr), where the position error includes a systematic error added in quadrature with the statistical error (the former was set to 0.35″ if the field astrometry was corrected by reference to the USNO B1.0 optical catalogue, or 1″otherwise). Fig.9 shows the distribution of X-ray position errors for the source sample; the range is from 0.37″to 3″, with an area-weighted average of 1.5″. In the event we selected only those X-ray sources with X-ray position errors 2″for the cross-correlation study, resulting in a reduced sample size of 2016 X-ray sources.
A preliminary investigation of the incidence of 2MASS sources at or near the X-ray positions demonstrated that, at least for the soft X-ray source sample, there was a significant excess over the number expected by chance, presumably reflecting the presence of a real counterpart in a substantial number of cases444In establishing the coincidence rate of 2MASS sources with the soft and hard X-ray source samples, we did not employ any discrimination based on the 2MASS quality flags. However, the flags were use to select sources with good photometry in the later investigation of the impact of interstellar reddening on the stellar colours.. The distribution of this excess population with respect to the X-ray source positions was studied by considering how the net number of sources contained within the soft-source error circles (over and above the background rate) varied as a function of the assumed X-ray error circle radius (Fig.10). On the basis of this empirical information, we set the X-ray error circle radius to be 2.5 times the X-ray position error quoted in the 2XMMi catalogue, at which point 90% of potential real counterparts will be contained within the error circle.

For the soft X-ray sources, the number of error circles containing a 2MASS source was 987 out of 1120 (), whereas for the spectrally hard sources the statistics were 393 out of 896 (). In most instances, there was only one 2MASS source within the X-ray error circle, but for the 85 X-ray sources for which this was not the case, we treated the brightest 2MASS source (in J band) as the potential counterpart. Figure 11 shows how the incidence rate of 2MASS stars within the X-ray error circles accumulates as a function of the 2MASS J magnitude for both the soft and hard source categories. The chance coincidence rate, calculated using the 2MASS catalogue information for the field regions within 8–20″of the X-ray source position, is also indicated. All three curves begin to flatten and eventually reach a plateau, around J , consistent with the fact that the spatial density of sources per unit magnitude in this set of Galactic fields peaks at J (i.e., at a level roughly a magnitude brighter than the completeness limit of the 2MASS survey at high latitude, as noted earlier). The plateau level for soft and hard distributions is as quoted above, whereas for the chance distribution it is .
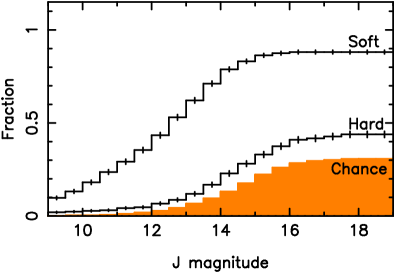
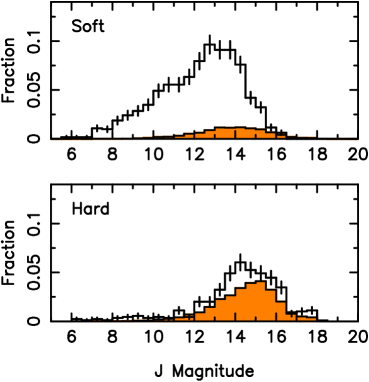
Figure 12 shows the derived magnitude distribution for the brightest 2MASS stars found to be positionally coincident with the X-ray source positions. The predicted contamination due to chance coincidences is also shown, where a correction has been incorporated for the fact that an error circle may not be “available” at faint magnitudes if a brighter star is already present. For the soft X-ray source sample, the magnitude distribution extends from J=7-16. Down to J=16, the underlying contamination due to field stars amounts to roughly 9% out of the 88% of error-circles which contain 2MASS stars down to this magnitude limit. In contrast, the magnitude distribution for the hard sample shows a much more modest excess of coincidences with respect to the predicted chance rate; for J 16, the coincidence rate is 38% of which 24%, i.e., roughly two-thirds, can be attributed to contamination by field stars.
The probability of finding a positionally coincident 2MASS source is clearly very different for the soft and hard X-ray source samples. We have investigated this in more detail by considering how this probability varies as a function of the broad-band hardness ratio, HR. Fig. 13 shows the result. The probability of finding a 2MASS star brighter than in the X-ray error circle (inclusive of chance hits) exhibits a step function behaviour, remaining at close to 90% for the spectrally soft sources with HR in the range -1 to -0.1, followed by a rapid transition to a level of about 50% for HR values near 0 followed by further decline to a level very near to the chance rate for the sources with the hardest spectra.

5.2 Cross-Correlation with UKIDSS
For our application, the 2MASS survey becomes incomplete below J . In contrast the United Kingdom Infrared Deep Sky Survey (UKIDSS, Lawrence et al. 2007) provides better spatial resolution (0.2″pixel scale with typically 1″seeing) and is significantly deeper. The nominal limiting magnitudes estimated for the UKIDSS survey are J=19.77, H=19.00 and K=18.05, with uncertainties of up to 0.2 magnitudes. As with 2MASS, the appropriate limits for the Galactic plane will be considerably brighter depending on the actual crowding within a given field (Lucas et al. 2008). The photometric data used in this analysis is taken from the UKIDSS Galactic Plane Survey (GPS) Data Release 4.
UKIDSS GPS J-band data were available for a total of 1117 X-ray sources drawn from our sample of X-ray sources with position errors less than 2″, with the coverage split roughly equally between the soft and hard samples (i.e., 596 soft and 577 hard). For this analysis we extracted a preliminary set of UKIDSS stars within a nominal of each X-ray position, leading to a preliminary set of 36974 stars down to J=20. Using the same X-ray error circle radii as for the 2MASS study, we repeated the analysis of the coincidence rates of UKIDSS stars within the X-ray error circles. As before, we make the assumption that the brightest star in the circle (in J band) is the most likely counterpart.
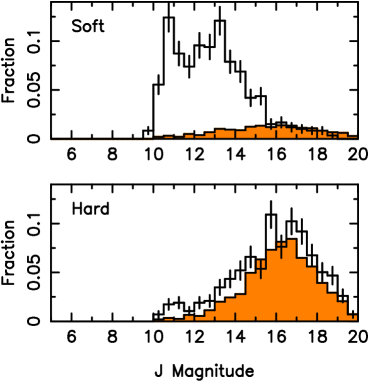
As we push down to a J magnitude of 20, the incidence rate of infrared stars in the X-ray error circles rises to 97% for the soft sources and 92% for the hard sources. Of course at these faint levels, given the stellar density and size of the error circles, the chance rate is commensurately high, namely 85%. Figure 14 shows the resulting magnitude distributions for the brightest UKIDSS star in the X-ray error circle.
For the soft sources, the magnitude distribution is truncated below J as a result of saturation effects in the UKIDSS images, with the apparent sub-peak near presumably attributable to the same effect. As was evident in the equivalent 2MASS distribution, there is a sharp cutoff between J=15-16. Despite the fact that the UKIDSS survey goes between 3-4 magnitudes deeper than 2MASS, the evidence is that very few real soft-source counterparts have J . For the soft sources, the coincidence rate with bright UKIDSS stars (J ) is 91% inclusive of a chance rate of 9%, values which are fully consistent with the equivalent 2MASS estimates.
For the hard sources, the coincidence rate with bright UKIDSS stars (J ) is 45%, which splits into a likely chance rate of 29% and an excess rate (i.e., potential real counterparts) of 16%. These percentages are again very comparable to those obtained from the 2MASS cross-correlation. There is also evidence that real counterparts are seen at fainter magnitudes, with the J=16-20 coincidence rate of 47% comprising a likely chance rate of 38% and an excess rate of 9%. It follows that of the hard source population may have counterparts visible, as the brightest star in the error circle, down to J=20. Of course, for every error circle for which this is the case, there are roughly 2.7 instances where the brightest star is just a chance positional coincidence of a field star. Clearly this statistic implies detailed follow-up of the hard-source population carries a large overhead.
5.3 Reddening of potential stellar counterparts
In order to investigated the colours of the NIR stars found inside the X-ray error circles, we have carried out a further selection aimed at removing those objects affected by known issues in relation to their photometry. The 2MASS catalogue includes four quality flags. For our purpose, we utilise the so-called the photometric QUALITY flag and select only those stars flagged as AAA (i.e., valid measurements with signal-to-noise ratio 10 in J, H and K). Similarly for the UKIDSS stars we required the error bit flag, ppErrbits 256, for each of the three near-IR bands and also (i.e., the removal of sources with non-stellar profiles). A total of 840 2MASS stars, representing the brightest object in the X-ray error circle, passed this selection step, with the equivalent number for UKIDSS being 444. A total of 130 stars were common to both lists and, in the event, we used only the 2MASS data for this subset of sources.
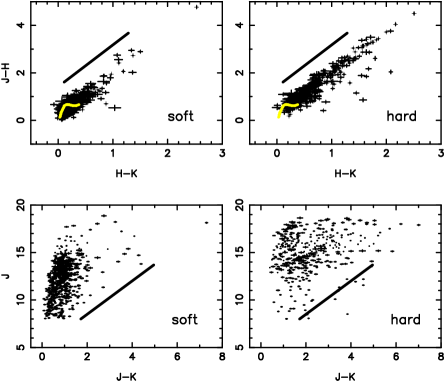

Figure 15 shows the H-K versus J-H two-colour diagram for the combined 2MASS/UKIDSS555We have not applied the photometric transformations detailed in Hodgkin et al. (2000) to convert the UKIDSS measurements to the 2MASS photometric scale, since the scatter in the plots far exceeds the magnitude of the corrections. sample of coincident stars, with the results for the soft and hard X-ray sources shown separately. The locus of main-sequence dwarf stars from F0V to M6V (Pickles 1998) and the reddening vector for a visual absorption are also defined. For the stars potentially associated with soft X-ray sources, there is a dense grouping in the region of the two-colour diagram encompassed by the locus of non-reddened main sequence dwarf stars, with a spread along the reddening direction largely encompassed by an of up to 20. In the case of the hard X-ray sources, the implied reddening is much more substantial for many of the stellar candidates, although the bulk of the population are still bounded by . Particularly for the hard band sample, there are a number of stars which lie off to the right of the main distribution (i.e., have very red H-K colours); these may be pre-main sequence (T Tauri) stars exhibiting an infrared excess (cf. Koenig et al. 2008).
Figure 15 also shows the variation of the J magnitude versus the J-K colour, with the impact of a visual absorption again indicated. The absolute magnitude, , for main sequence stars of type F0V to M0V ranges from 2.43–5.72 (Covey et al. 2007), i.e., a for unreddened stars at a fixed distance. If we compare this with the spread of apparent in the colour-magnitude diagram for the bulk of the stars associated with the soft X-ray sources, then the implied scatter in distance is roughly a factor of 5. Of course, the presence of significant numbers of dMe stars of spectral class later than M0 would compromise this argument. The stars found in the hard X-ray source error circles are significantly fainter and redder than the population associated with the soft X-ray sources. However, as noted earlier, a substantial fraction of the stars linked to the hard X-ray sources will be chance coincidences with field stars and to first order the scatter in the both the H-K versus J-H two-colour diagram and in the J-K versus J colour-magnitude diagram for the hard sources must reflect the underlying properties of the field star distribution.
For those stars linked to hard X-ray sources, we have estimated the visual absorption by projecting the star’s position in the two colour diagram onto the reddening vector and determining the offset relative to an origin at J-H=0.61, H-K=0.11 (the colours of an unreddened GV star). In Fig. 16, the resulting estimate of is plotted versus the X-ray column density derived in §4.4. Compared to the standard conversion, (Predehl & Schmitt 1995), most of the points in the diagram lie at values significantly greater than that implied by the determination. This is to be expected if many of the associated NIR objects are, in fact, foreground stars, albeit sufficiently distant to be subject to significant reddening. One way of picking out potentially true counterparts might be to require the derived and estimates to be comparable; unfortunately the large uncertainties implicit in the estimation of both parameters mitigates against this as a practical scheme.
6 Discussion
6.1 Nature of the Soft X-ray Source Population
In the soft band, the nominal sensitivity limit of our survey is around 2 pn ct/ks corresponding to an unabsorbed flux, (0.5-2 keV). This is roughly 5 times deeper than the ROSAT survey reported by Morley et al. (2001), which in turn was a factor 5 deeper than the Einstein GPS (Hertz & Grindlay 1984; Hertz & Grindlay 1988) and the ROSAT GPS (Motch et al. 1991; Motch et al. 1997). By way of comparison, the stellar survey carried out recently under the auspices of the Extended Chandra Multiwavelength Project (Covey et al. 2008) reaches similar, or somewhat deeper, limits to those reported here. These surveys and many other studies have established that the Galactic source population in the soft X-ray band largely comprises of late-type stars with active coronae. More specifically the ROSAT all-sky survey clearly demonstrated that main-sequence stars from early-F to late-M dominate the source statistics and that stars younger than Gyr are typically more luminous in X-rays than older populations; this is a consequence of the reducing efficiency with which the corona is heated by the dynamo mechanism as the rate of stellar rotation declines with age (see Güdel 2004 and references therein). At high galactic latitude, as the flux limit is lowered, the surveyed volume will eventually extend beyond the scale height of the young star population, thereby altering the balance between relatively old and relatively young stars (e.g., Micela et al. 2007). Although this is not a consideration which applies directly to a narrow Galactic plane survey, line-of-sight absorption will suppress the surveyed volume most severely for higher sources, presumably giving rise to a similar bias.
From the cross-correlation of our soft X-ray source sample with the 2MASS catalogue, we concluded that 88% of the error circles contain stars with J 16, with only 9% of this figure attributable to chance coincidences. Furthermore, since our error circles were scaled so as to contain 90% of the true counterparts, it follows that active stellar coronae must account for almost our entire sample of soft X-ray sources. When the search for counterparts was extended some 4 magnitudes fainter through the cross-correlation with the UKIDSS catalogue, the evidence for a cut-off at J 16 was quite stark666If we compare the corresponding X-ray and infrared flux limits, and J = 16, through the relation loglog + 0.4 J + 6.30, we obtain log. We note that ROSAT sources correlating with stellar counterparts extracted from either the Simbad or Sloan databases also show a cutoff in their X-ray to infrared flux ratio at or near this limit (Agüeros et al. 2009).. This prompts the question of why the stellar identifications are restricted to bright magnitudes?
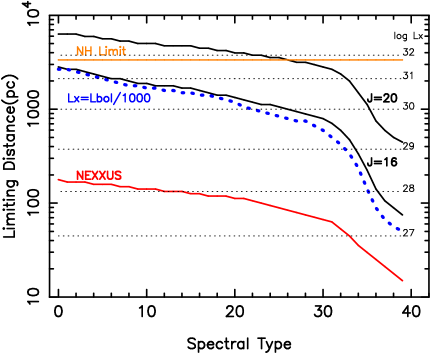
In Fig. 17 we explore the distances out to which main sequence stars of different spectral class may be detected in both the NIR and our XMM-Newton survey. In the NIR, the constraint J sets a distance limit which varies from 2.7 kpc for early F stars down to pc for late M stars. In contrast if we assume stellar X-ray luminosities typical of normal solar-type stars, as represented by the NEXXUS survey (Schmitt & Liefke 2004), then the X-ray survey horizon is an order of magnitude closer. Of course, as the level of coronal activity increases, so does the surveyed volume in the X-ray band. As is clear from Fig. 17, if the X-ray horizon is to match the J=16 boundary, the X-ray luminosity will need to have increased to the point at which stellar-coronal emission is known to saturate, namely at (Güdel 2004 and references therein). This, almost certainly, explains the origin of J 16 cut-off alluded to earlier.
It is true that previous X-ray surveys have identified some coronal sources emitting above the nominal saturation limit, one explanation being that these are systems caught whilst flaring (e.g., Fleming et al. 1995; Morley et al. 2001). Fleming et al. (1995) estimate that 25% of solar-like stars and 50% of dMe stars were detected in the Einstein GPS, whilst flaring, so such sources could represent a not insignificant fraction of the population in our current sample. However, on the basis of the above evidence it would seem that even allowing for stellar flaring, the saturation limit is applicable to the vast majority of our soft band detections. Similar arguments and constraints apply in the case of tidally interacting close binaries, such as RSCVn systems, which maintain fast rotation throughout their main-sequence lifetime possibly into their later evolution (Güdel 2004) and which are amongst the most luminous coronal emitters, with in some cases exceeding (e.g., Makarov 2003).
Figure 17 also shows an additional X-ray constraint at about 3 kpc, which is the distance at which the line-of-sight column density exceeds (albeit based on a very simplistic absorption model as detailed in the figure caption). At this value of the soft X-ray absorption is such as to move a source from the soft to the hard category (assuming a powerlaw spectrum with ). The implication is that there is a “spectral” horizon for the soft X-ray source sample at about 3 kpc, which corresponds to a soft-band X-ray luminosity of somewhat less than . On the basis of the saturation limit for coronal emission, it would seem that, at least amongst single stars, only F stars are likely to approach the horizon. Conversely, one might conjecture that relatively distant F stars are likely to be predominant as one approaches the HR=0 boundary.
Finally, we note that the soft source population could also include some accretion-powered stellar systems, in particular CVs containing only weakly magnetized white dwarfs. Such sources comprise of the accreting white dwarf population (e.g., Warner 1995), have relatively soft thermal components in their spectra and soft X-ray luminosities typically in the range (e.g., Verbunt et al. 1997). Presumably non-magnetic CVs might be detected out to the horizon and given the low-mass nature of the secondaries be rather faint in the near-infrared. However, given the above statistics, this class of object can, at best, represent only a small fraction of the soft source population.
6.2 Nature of the Hard X-ray Source Population
In the hard X-ray band, if we again take the nominal sensitivity limit to be 2 pn ct/ks, then the corresponding unabsorbed flux limit is (2–10 keV). This translates to a luminosity of for a source at a distance d in kpc. In the 2–10 keV band, our XMM-Newton survey is roughly an order of magnitude deeper than the ASCA GPS (Sugizaki et al. 2001) but shallower by about the same factor with respect to the Chandra deep pointing in the Galactic Plane reported by Ebisawa et al. (2005).
The incidence of NIR counterparts brighter than J=16 within the X-ray error circles shows a sharp downward step around HR (Fig. 13), indicative of the fact that the underlying source populations differ markedly between the hard and soft bands. On the basis of the 2MASS and UKIDSS cross-correlation analyses, it appears that true counterparts may be present, as the brightest star in the X-ray error circle, in roughly 25% of cases, down to a limiting magnitude of J=20, set against a chance rate which is 2.7 times this value. If the cut is set at a brighter limit, at say J 16, then true counterparts may be present in roughly 15% of cases, set against a chance rate of somewhat less than twice this value, This rather poor “success rate” for an X-ray survey with source locations (or more specifically 90% error circle radii) of better than 5″ radius is, of course, evidence for the relative faintness in the NIR (and optical) of the bulk of the true counterparts. For the hard-band sample, the average inferred from the X-ray spectral analysis is 1022 cm-2, implying and , so it is not surprising that the NIR objects linked to the hard sources are typically very much fainter than the NIR counterparts of the soft sources, for which the impact of line-of-sight absorption is much less severe.
In broad terms, the various classes of hard X-ray emitting source split into systems containing either a high-mass or low-mass star (see below). For the stellar-light component, the difference in the absolute magnitude will be at least (e.g., comparing for main-sequence stars earlier than B8 with that for dwarfs later than K0; Kraus & Hillenbrand 2007), implying a difference in log for high-mass and low-mass systems (at a given distance emitting at the same ) of at least a factor of 2. Even when the total systemic emission is considered, any additional contribution to the light from accretion disks, hotspots, etc., generally fails to bridge this gap (e.g., as in CVs; Ak et al. 2007). It follows that there will be a strong bias towards high-mass systems within the subset of sources with bright NIR counterparts. Of course, for relatively high luminosity systems () detectable in the hard band out to a few kpc and beyond, the impact of interstellar absorption at J will also be factor tending to suppress the “identification” rate777Although the impact of interstellar absorption will be reduced at K, the commensurately higher stellar densities mitigates against any clear advantage in focusing on the longer wavelength band for the current application..
Although our knowledge of the hard X-ray source population of the Galaxy at intermediate to faint fluxes is very incomplete, due to the difficulty in identifying large samples of objects drawn from hard X-ray catalogues, we do know at least in qualitative terms which classes of source may be present in significant numbers. The largest single contribution is likely to come from CVs containing an accreting magnetic white dwarf (polars or intermediate polars) in which there is substantial hard emission characterised by thermal temperatures of kT 10 keV (e.g., Ezuka & Ishida 1999). This class of source which may account for the very high density of X-ray sources observed in the Galactic Centre (e.g., Muno et al. 2003) and also for a substantial fraction of the hard unresolved X-ray emission, known as the Galactic Ridge, observed both near the Galactic Centre and also along the inner quadrant of the Galactic Plane (e.g., Sazonov et al. 2006; Revnivtsev et al. 2006). LMXB and HMXB systems emitting at relatively low may also be present in the survey. For example, Pfahl et al. (2002) have suggested that neutron stars accreting from the winds of main-sequence stellar companions might be plentiful in the Galaxy. A similar idea was suggested by Willems & Kolb (2003) involving pre-low-mass X-ray binaries. However, on the basis of a population synthesis model, Liu & Li (2006) conclude that neutron star LMXB transients in relative quiescence, LMXB with white dwarf donors and rotation-powered pulsars may provide an alternative explanation of the high density of faint X-ray sources seen in the Galactic Centre. Our survey which encompasses star-forming regions both in the Galactic Centre region and in inner spiral arms of the Galaxy, may also contain new examples of the highly embedded Supergiant Fast X-ray Transients (SFXTs) recently discovered by Integral (e.g., Sguera et al. 2006) and of Be-star X-ray binaries, including Cas analogs (e.g., Motch et al. 2007).
Relatively hard X-ray emission can also be produced in stellar sources without reliance on accretion power. Shocks produced in the unstable winds of massive Wolf-Rayet (WR) and O-supergiant stars can generate emission above 2 keV. This hard emission can be greatly enhance in WR/OB binaries, systems which appear to be relatively common in the Galactic Centre (Mauerhan et al. 2009; Mauerhan et al. 2010). Coronal emission in close, tidally interacting, binaries such as RSCVn-type systems and related classes of object (BY Dra-type and Algol-type binaries) may also reach temperatures extending into the hard X-ray regime (Swank et al. 1981; Agrawal et al. 1981). Similarly, in specific locations such as the vicinities of dense molecular clouds and star-forming regions, protostars and T-Tauri stars may also be prominent as hard X-ray sources, by virtue of their enhanced high temperature coronal emission, particularly during flaring episodes (e.g., Stelzer et al. 2000; Tsujimoto et al. 2002). Of course, it remains to be demonstrated whether any new types of Galactic X-ray source are present within current hard X-ray Galactic surveys; for example, isolated neutron stars and/or blackholes accreting directly from the interstellar medium (Agol & Kamionkowski 2002).
An illustration of the likely makeup of hard-band selected samples is provided by the recent study of Motch et al. (2010) who carried out an optical follow-up campaign on a sample of sources selected from the XMM-Newton Galactic plane survey of Hands et al. (2004). Out of 25 hard sources in the follow-up sample, there were tentative identifications with four HMXBs and and with one likely Wolf-Rayet colliding-wind binary system. A number of the HMXBs had particularly interesting properties, for example the group included a very absorbed likely hyper-luminous star in a system bearing similarity to Carina, a new/Be star binary belonging to the growing class of -Cas analogs and a possible supergiant X-ray binary of the type recently discovered by Integral. The inferred X-ray luminosities for these massive star systems was . There were also probable identifications of 3 CVs with relatively faint optical counterparts (including a previously undiscovered magnetic system displaying strong X-ray variability) and somewhat more tentative identifications of 2 LMXBs. The detection of several potential active coronal emitters above 2 keV also underlines the possibility that active RSCVn binaries might contribute significantly to hard-band selected samples. Unfortunately, the identification of limited samples of object does not translate to detail constraints on the space density, scale height and luminosity function of the known classes of object and whilst our knowledge remains very sketchy, we are unable to give firm answers to many important astrophysical questions.
One important unanswered question is what fraction of the hard-band sources might be extragalactic interlopers seen through the high absorption column of the Galactic plane? Since we require the X-ray sources in our sample to be pointlike (see §3), this presumably mitigates against the presence of a significant number of clusters of galaxies, leaving active galactic nuclei (AGN) as the dominant extragalactic contaminant. From the investigation of the column densities in §4.4, it is clear that AGN would generally have HR 0.8. In an analysis of the 2–10 keV log N - log S relation measured in the Galactic plane based on the combination of ASCA, Chandra and XMM-Newton observations, Hands et al. (2004) demonstrate that at the flux levels encompassed in our current survey, AGN might contribute as much as 50% of the hard source population, with an even higher fraction likely at fainter levels (Ebisawa et al. 2005). Interestingly this rather closely matches the fraction of hard sources with HR 0.8. However, we stress that these estimates are very sensitive to the factor assumed for the hard-band transmission through the Galactic plane and will vary significantly across our survey region; for example, Hands et al. (2004) assume a transmission factor of 0.68 appropriate to (l,b)=(20,0). Further consideration of how the spatial density of the sources in the current survey varies as a function of flux and position, and the impact of AGN contamination, will be the subject of a subsequent paper (Paper III -Warwick et al. in preparation).
7 Conclusions
We have used the 2XMMi source lists pertaining to 116 XMM-Newton observations targeted at the inner quadrant of the Galactic Plane, to construct a sample of serendipitous Galactic X-ray sources. The main properties of the 2204 sources which comprise the sample are:
-
1.
The bulk of the sources have total count rates in the range 2-100 pn ct ks-1 (0.5-12 keV). In the soft (0.5-2 keV) band, 2 pn ct ks-1 corresponds to 10-15 erg s-1 cm-2 (0.5–2 keV), assuming an absorbed power-law spectrum with = 2.5 and = 1021 cm-2. The same count rate in the hard (2-12 keV) band equates to 10-14 erg s-1 cm-2 (2–10 keV), in this case assuming = 1.0 and = 31022 cm-2.
-
2.
Using a characterisation based on whether the majority of the counts were recorded below or above 2 keV, the sample splits rather cleanly into 1227 soft sources and 977 hard sources.
-
3.
Both the broad-band hardness ratio (HR) distribution and the Band Index () plots reflect a wide spread of underlying source spectra. For the soft sources, the X-ray spectra may be represented as either power-law continua with or as thermal spectra with kT keV with ranging from . For the hard sources, a significantly harder continuum form is likely, i.e., , with . The sources with HR0.8 have column densities commensurate with the total Galactic line-of-sight value.
-
4.
A high fraction (90%) of the soft sources have potential NIR (2MASS and/or UKIDSS) counterparts inside their error circles, consistent with the dominant soft X-ray source population being relatively nearby coronally-active stars. In contrast, the success rate in finding likely NIR counterparts to the hard X-ray sample is no more than down to J=20, set against a much higher chance coincidence rate. The make-up of the hard band population in terms likely contributors such as CVs, active binaries, relatively quiescent LMXBs/HMXB and other classes of object remains uncertain.
In future papers we will explore the average X-ray spectral properties of a subset of relatively bright sources drawn from our source sample (Paper II), the log N - log S curves for both the soft and hard source samples (Paper III) and the broad-band colours of likely counterparts to the X-ray sources (Paper IV).
Acknowledgments
This publication refers to data products from the Two Micron All Sky Survey, which is a joint project of the University of Massachusetts and the Infrared Processing and Analysis Center/California Institute of Technology, funded by the National Aeronautics and Space Administration and the National Science Foundation. In carrying out this research, use has been made of Aladin, the VizieR catalogue access tool and Simbad at CDS, Strasbourg, France.
References
- Agol & Kamionkowski (2002) Agol, E., Kamionkowski, M., 2002, MNRAS, 334, 553
- Agrawal et al. (1981) Agrawal, P. C., Riegler, G. R., White, N. E., 1981, MNRAS, 196, 73P.
- Agüeros et al. (2009) Agüeros, M. A., Anderson, S. F., Covey, K. R., Hawley, S. L., Margon, B., Newsom, E. R., Posselt, B., Silvestri, N. M., Szkody, P., Voges, W., 2009, ApJS, 181, 444
- Ak et al. (2007) Ak, T., Bilir, S., Ak, S., Retter, A., 2007, New Ast., 12, 446
- Covey et al. (2007) Covey, K. R., Ivezic, Z., Schlegel, D., Finkbeiner, D., Padmanabhan, N., Lupton, R. H., Agüeros, M. A., Bochanski, J. J., Hawley, S. L., West, A. A., Seth, A., Kimball, A., Gogarten, S. M., Claire, M., Haggard, D., Kaib, N., Schneider, D. P., Sesar, B., 2007, AJ, 134, 2398
- Covey et al. (2008) Covey, K. R., Agüeros, M. A., Green, P. J., Haggard, D., Barkhouse, W. A., Drake, J., Evans, N., Kashyap, V., Kim, D.-W., Mossman, A., Pease, D. O., Silverman, J. D., 2008, ApJS, 178, 339
- Cutri et al. (2003) Cutri, R. M., et al. 2003, Explanatory Supplement to the 2MASS All Sky Data Release and Extended Mission Products (Pasadena:IPAC/Caltech)
- Ebisawa et al. (2001) Ebisawa, K., Maeda, Y., Kaneda, H., & Yamauchi, S. 2001, Science, 293, 1633
- Ebisawa et al. (2005) Ebisawa, K., Tsujimoto, M., Paizis, A., Hamaguchi, K., Bamba, A., Cutri, R., Kaneda, H., Maeda, Y., Sato, G., Senda, A., Ueno, M., Yamauchi, S., Beckmann, V., Courvoisier, T.J.-L., Dubath, P. & Nishihara, E. 2005, ApJ, 635, 214
- Ezuka & Ishida (1999) Ezuka, H., Ishida, M., 1999, ApJS, 120, 277
- Feigelson & Montmerle (1999) Feigelson, E.D., Montmerle, T., 1999, ARAA, 37, 363
- Fiorucci & Munari (2003) Fiorucci, M., Munari, U., 2003, A&A, 401, 781
- Fleming et al. (1995) Fleming, T.A., Moendi S., Maccacaro T., Wolter A., 1995, ApJS, 99, 701
- Forman et al. (1978) Forman, W., Jones, C., Cominsky, L., et al., 1978, ApJS, 38, 357
- Grindlay et al. (2005) Grindlay, J. E., Hong, J., Zhao, P., Laycock, S., van den Berg, M., Koenig, X., Schlegel, E. M., Cohn, H. N., Lugger, P. M., Rogel, A. B., 2005, ApJ, 635, 920
- Güdel (2004) Güdel, M., 2004, Astron Astrophys Rev, 12, 71
- Haberl & Pietsch (2007) Haberl, F., Pietsch, W., 2007, A&A, 476, 317
- Hands et al. (2004) Hands A.D.P., Warwick R.S., Watson M.G., Helfand D.J., 2004, MNRAS, 351, 31
- Herent et al. (2006) Hérent, O., Motch, C., Guillout, P., 2006, in ESA Special Publication, Vol. 604, The X-ray Universe 2005, ed. A. Wilson, p.91
- Hertz & Grindlay (1984) Hertz, P., Grindlay, J. E. 1984, ApJ, 278, 137
- Hertz & Grindlay (1988) Hertz, P., Grindlay, J. E. 1988, AJ, 96, 233
- Hodgkin et al. (2000) Hodgkin, S. T., Irwin, M. J., Hewett, P. C., Warren, S. J., 2009, MNRAS, 394, 675
- Hong et al. (2004) Hong, J., Schlegel, E. M., Grindlay, J. E., 2004, ApJ, 614, 508
- Hong et al. (2005) Hong, J., van den Berg, M., Schlegel, E. M., Grindlay, J. E., Koenig, X., Laycock, S., Zhao, P., 2005, ApJ, 635, 907
- Hong et al. (2009) Hong, J., van den Berg, M., Grindlay, J. E., Laycock, S., 2009, ApJ, 706, 223
- Koenig et al. (2008) Koenig, X., Grindlay, J. E., van den Berg, M., Laycock, S., Zhao, P., Hong, J., Schlegel, E. M., 2008, ApJ, 685, 463
- Kraus & Hillenbrand (2007) Kraus, A.L., Hillenbrand, L.A., 2007, AJ, 134, 2340
- Lawrence et al. (2007) Lawrence A., Warren, S. J., Almaini, O., Edge, A. C., Hambly, N. C., Jameson, R .F., Lucas, P., Casali, M., Adamson, A., Dye, S., Emerson, J. P., Foucaud, S., Hewett, P., Hirst, P., Hodgkin, S. T., Irwin, M. J., Lodieu, N., McMahon, R. G., Simpson, C., Smail, I., Mortlock, D., Folger, M., 2007, MNRAS, 379, 1599
- Laycock et al. (2005) Laycock, S., Grindlay, J., van den Berg, M., Zhao, P., Hong, J., Koenig, X., Schlegel, E. M., Persson, S. E., 2005, ApJL, 634, 53
- Liu & Li (2006) Liu, X, -W., Li, X. -D., 2006, A&A, 449, 135
- Lucas et al. (2008) Lucas P. W., Hoare, M. G., Longmore, A., Schröder, A. C., Davis, C .J., Adamson, A., Bandyopadhyay, R. M., de Grijs, R. , Smith, M., Goslimg, A., Mitchison, S., Gaspar, A., Coe, M., Tamura, M., Parker, O., Irwin, M., Hambly, N., Bryant, J., Collins, R.S., Cross, N., Evans, D. W., Gonzalez-Solares, E., Hodgkin, S., Lewis, J., Read, M., Riello, M., Sutorius, E.T.W., Lawrence, A., Drew, J. E., Dye, S., Thompson, M. A., 2008, MNRAS, 391, 136
- Makarov (2003) Makarov, V. V., 2003, AJ, 126, 1996
- Mateos et al. (2008) Mateos, S., Warwick, R. S., Carrera, F. J., Stewart, G. C., Ebrero, J., Della Ceca, R., Caccianiga, A., Gilli, R., Page, M. J., Treister, E., Tedds, J. A., Watson, M. G., Lamer, G., Saxton, R. D., Brunner, H., Page, C. G., 2008, A&A, 492, 51
- Mateos et al. (2009) Mateos, S., Saxton, R. D., Read, A. M., Sembay, S., 2009, A&A, 496, 879
- Mauerhan et al. (2009) Mauerhan, J. C., Muno, M. P., Morris, M. R., Bauer, F. E., Nishiyama, S., Nagata, T., 2009, ApJ, 703, 30
- Mauerhan et al. (2010) Mauerhan, J. C., Muno, M. P., Morris, M. R., Stolovy, S. R., Cotera, A., 2010, ApJ, 713, 706
- Micela et al. (2007) Micela, G., Affer, L., Favata, F., Henry, J. P., Gioia, I., Mullis, C. R., Sanz Forcada, J., Sciortino, S., 2007, A&A, 461, 977
- Morley et al. (2001) Morley J.E, Briggs K.R., Pye J.P., Favata F., Micela G., Sciortino S., 2001, MNRAS, 326, 1161
- Motch et al. (1991) Motch, C., Belloni, T., Buckley, D., Gottwald, M., Hasinger, G., Pakull, M. W., Pietsch, W., Reinsch, K., Remillard, R. A., Schmitt, J.H.M.M., Trumpler, J., Zimmermann, H.-U., 1991, A&A, 246, L24
- Motch et al. (1997) Motch, C., Guillout, P., Haberl, F., Pakull, M., Pietsch, W., Reinsch, K., 1997, A&A, 318, 111
- Motch et al. (2007) Motch, C., Lopes de Oliveira, R., Negueruela, I., Haberl, F., Janot-Pacheco, E., 2007, ASP Conference Series, 361, 117
- Motch et al. (2010) Motch, C., Warwick, R., Cropper, M. S., Carrera, F., Guillout, P., Pineau, F. X., Pakull, M. W., Rosen, S., Schwope, A., Tedds, J., Webb, N., Negueruela, I., Watson, M. G., 2010, arXiv:0911.0381
- Muno et al. (2003) Muno, M. P., Baganoff, F. K., Bautz, M. W., Brandt, W. N., Broos, P. S., Feigelson, E. D., Garmire, G. P., Morris, M. R., Ricker, G. R., Townsley, L. K., 2003, ApJ, 589, 225
- Muno et al. (2004) Muno, M. P., Arabadjis, J.S., Baganoff, F. K., Bautz, M. W., Brandt, W. N., Broos, P. S., Feigelson, E. D., Garmire, G. P., Morris, M. R., Ricker, G. R., 2004, ApJ, 613, 1179
- Muno et al. (2006) Muno, M. P., Bauer, F. E., Bandyopadhyay, R. M., Wang, O. D., 2006, ApJSS, 165, 173
- Muno et al. (2009) Muno, M. P., Bauer, F. E., Baganoff, F. K., Bandyopadhyay, R. M., Bower, G. C., Brandt, W. N., Broos, P. S., Cotera, A., Eikenberry, S. S., Garmire, G. P., Hyman, S. D., Kassim, N. E., Lang, C. C., Lazio, T.J.W., Law, C., Mauerhan, J. C., Morris, M. R., Nagata, T., Nishiyama, S., Park, S., Ramìrez, S. V., Stolovy, S. R., Wijnands, R., Wang, Q. D., Wang, Z., Yusef-Zadeh, F., 2009, ApJSS, 181, 110
- Pfahl et al. (2002) Pfahl, E., Rappaport, S., Podsiadlowski, P., 2002, ApJ, 571L, 37
- Pickles (1998) Pickles, A. J., 1998, PASP, 110, 863
- Predehl & Schmitt (1995) Predehl, P., Schmitt, J.H.M.M., 1995, A&A, 293, 889
- Revnivtsev et al. (2006) Revnivtsev, M., Sazonov, S., Gilfanov, M., Churazov, E., Sunyaev, R., 2006, A&A, 452, 169
- Revnivtsev et al. (2009) Revnivtsev, M., Sazonov, S., Churazov, E., Forman, W., Vikhlinin, A., Sunyaev, R., 2009, Nature, 458, 1142
- Sazonov et al. (2006) Sazonov, S., Revnivtsev, M., Gilfanov, M., Churazov, E., Sunyaev, R., 2006, A&A, 450 117
- Schlegel et al. (1998) Schlegel, D. J., Finkbeiner, D. P., Davis, M., 1998, ApJ, 500, 525
- Schmitt & Liefke (2004) Schmitt, J.H.M.M., Liefke C., 2004, A&A, 417, 651
- Sguera et al. (2006) Sguera, V., Bazzano, A., Bird, A. J., Dean, A. J., Ubertini, P., Barlow, E. J., Bassani, L., Clark, D. J., Hill, A. B., Malizia, A., Molina, M., Stephen, J. B., 2006, ApJ, 646, 452
- Skrutskie et al. (2006) Skrutskie, M. F., Cutri, R. M., Stiening, R., Weinberg, M. D., Schneider, S., Carpenter, J. M., Beichman, C., Capps, R., Chester, T., Elias, J., Huchra, J., Liebert, J., Lonsdale, C., Monet, D. G., Price, S., Seitzer, P., Jarrett, T., Kirkpatrick, J. D., Gizis, J. E., Howard, E., Evans, T., Fowler, J., Fullmer, L., Hurt, R., Light, R., Kopan, E. L., Marsh, K. A., McCallon, H. L., Tam, R., Van Dyk, S., Wheelock, S., 2006, AJ, 131, 1163
- Stelzer et al. (2000) Stelzer, B., Neühauser, R., Hambaryan, V., 2000, A&A, 418, 687
- Strüder et al. (2001) Strüder, L., Briel, U., Dennerl, K., Hartmann, R., Kendziorra, E., Meidinger, N., Pfeffermann, E., Reppin, C., Aschenbach, B., Bornemann, W., Bräuninger, H., Burkert, W., Elender, M., Freyberg, M., Haberl, F., Hartner, G., Heuschmann, F., Hippmann, H., Kastelic, E., Kemmer, S., Kettenring, G., Kink, W., Krause, N., Müller, S., Oppitz, A., Pietsch, W., Popp, M., Predehl, P., Read, A., Stephan, K.H., Stötter, D., Trümper, J., Holl, P., Kemmer, J., Soltau, H., Stötter, R., Weber, U., Weichert, U., von Zanthier, C., Carathanassis, D., Lutz, G., Richter, R.H., Solc, P., Böttcher, H., Kuster, M., Staubert, R., Abbey, A., Holland, A., Turner, M., Balasini, M., Bignami, G.F., La Palombara, N., Villa, G., Buttler, W., Gianini, F., Lainé, R., Lumb, D., Dhez, P., 2001, A&A, 368, L18
- Sugizaki et al. (2001) Sugizaki, M., Mitsuda, K., Kaneda, H., Matsuzaki, K., Yamauchi, S., Koyama, K., 2001, ApJSS, 134, 77
- Swank et al. (1981) Swank, J.H., White, N.E., Holt, S.S., Becker, R.H., 1981, ApJ, 246, 208
- Tsujimoto et al. (2002) Tsujimoto, M., Koyama, K., Tsuboi, Y., Goto, M., Kobayashi, N., 2002, ApJ, 566, 974
- Turner et al. (2001) Turner, M. J. L., Abbey, A., Arnaud, M., Balasini, M., Barbera, M., Belsole, E., Bennie, P. J., Bernard, J. P., Bignami, G. F., Boer, M., Briel, U., Butler, I., Cara, C., Chabaud, C., Cole, R., Collura, A., Conte, M., Cros, A., Denby, M., Dhez, P., Di Coco, G., Dowson, J., Ferrando, P., Ghizzardi, S., Gianotti, F., Goodall, C. V., Gretton, L., Griffiths, R. G., Hainaut, O., Hochedez, J. F., Holland, A. D., Jourdain, E., Kendziorra, E., Lagostina, A., Laine, R., La Palombara, N., Lortholary, M., Lumb, D., Marty, P., Molendi, S., Pigot, C., Poindron, E., Pounds, K. A., Reeves, J. N., Reppin, C., Rothenflug, R., Salvetat, P., Sauvageot, J. L., Schmitt, D., Sembay, S., Short, A.D.T., Spragg, J., Stephen, J., Strüder, L., Tiengo, A., Trifoglio, M., Trümper, J., Vercellone, S., Vigroux, L., Villa, G., Ward, M. J., Whitehead, S., Zonca, E., 2001, A&A, 365, L27
- van den Berg et al. (2009) van den Berg, M., Hong, J., Grindlay, J.E., 2009, ApJ, 700, 1701
- Verbunt et al. (1997) Verbunt, F., Bunt, W.H., Ritter, H., Pfeffermann, E., 1997, A&A, 327, 602
- Voges et al. (1999) Voges, W., Aschenbach, B., Boller, Th., Bräuninger, H., Briel, U., Burkert, W., Dennerl, K., Englhauser, J., Gruber, R., Haberl, F., Hartner, G., Hasinger, G., Kürster, M., Pfeffermann, E., Pietsch, W., Predehl, P., Rosso, C., Schmitt, J. H. M. M., Trümper, J., Zimmermann, H. U., 1999, A&A, 349, 389
- Wang et al. (2002) Wang, Q. D., Gotthelf, E. V., & Lang, C. C., 2002, Nature, 415, 148
- Warner (1995) Warner, B., 1995, Cataclysmic Variable Stars (Cambridge: Cambridge Univ. Press)
- Warwick et al. (1981) Warwick, R. S., Marshall, N., Fraser, G. W., Watson, M. G., Lawrence, A., Page, C. G., Pounds, K. A., Ricketts, M. J., Sims, M. R., Smith, A., 1981, MNRAS, 197, 865
- Watson et al. (2009) Watson, M. G., Schröder, A. C., Fyfe, D., Page, C. G., Lamer, G., Mateos, S., Pye, J., Sakano, M., Rosen, S., Ballet, J., Barcons, X., Barret, D., Boller, T., Brunner, H., Brusa, M., Caccianiga, A., Carrera, F. J., Ceballos, M., Della Ceca, R., Denby, M., Denkinson, G., Dupuy, S., Farrell, S., Fraschetti, F., Freyberg, M. J., Guillout, P., Hambaryan, V., Maccacaro, T., Mathiesen, B., McMahon, R., Michel, L., Motch, C., Osborne, J. P., Page, M., Pakull, M. W., Pietsch, W., Saxton, R., Schwope, A., Severgnini, P., Simpson, M., Sironi, G., Stewart, G., Stewart, I. M., Stobbart, A.-M., Tedds, J., Warwick, R., Webb, N., West, R., Worrall, D., Yuan, W., 2009, A&A, 493, 339
- Wijnands et al. (2006) Wijnands, R., in’t Zand, J. J. M., Rupen, M., Maccarone, T., Homan, J., Cornelisse, R., Fender, R., Grindlay, J., van der Klis, M., Kuulkers, E., Markwardt, C. B., Miller-Jones, J.C.A., Wang, Q. D., 2006, A&A, 449, 1117
- Willems & Kolb (2003) Willems, B., Kolb, U., 2003, MNRAS, 343, 949