Study of the NWC electrons belt observed on DEMETER Satellite
Abstract
We analyzed observation data collected by the Instrument for the Detection of Particles (IDP) on board of DEMETER satellite during the period of total seventeen months in 2007 and 2008. In the meantime, the VLF transmitter located at NWC ground station was shutdown for seven months and working for total ten months. Our analysis for the first time revealed in details the transient properties of the space electrons induced by the man-made VLF wave emitted by the transmitter at NWC. First, we mapped the electron flux distribution and figured out the special range what the NWC belt covered. Then we investigated the NWC electron spectrograms in a wide range of McIlwain parameter (up to L3.0). Finally, we obtained the averaged energy spectrum of the NWC electrons within the drift loss-cone, and compared the difference during the observations between daytime and nighttime. Our results proved the fact that the VLF emissions from NWC transmitter created momentary electron enhancement with fluxes up to 3 orders of magnitude. These electrons are distributed in the region of in longitude and 1.6 1.9 of L shell. In addition, the VLF emission induced either enhancement or loss of electrons in higher magnetic shells up to L3, and the maximum loss was up to 60 of the original value. The energy spectra of these electrons revealed that the enhancement during the NWC daytime are more attenuated than those in the NWC nighttime and that the shape and the cutoff energy of the spectra are also quite different. We will present the results of our analysis, compare it with previous studies, and discuss the agreement of our results with the theory of wave-particle interaction.
Li et al \titlerunningheadSTUDY OF THE NWC ELECTRONS BELT OBSERVED ON DEMETER SATELLITE
1 Introduction
More than thirty years ago, it has been learned that the VLF wave emitted by transmitters on the ground stations can cause precipitation of electrons in the radiation belt, and the process obeys the theory of wave-particle interaction. Subsequently, there have been numerous experimental observations and theoretical interpretations on this subject. Bullough et al.(1976) studied the ELF/VLF radiation at the altitude of the Ariel satellite and revealed the phenomenon of wave-particle interaction in a geomagnetic conjugate region in the southern hemisphere(2 3). Kimura et al. (1983)found strong correlations between the 0.3-6.9keV electron fluxes observed by EXOS-B satellite and the 0.3-9kHz VLF wave emitted by transmitter at SIPLE ground station.
In the SEEP experiment conducted from May to September in 1982, by turning the transmitter at the NAA ground station on and off at the time scale of seconds, Imhof et al (1983) studied the instantaneous correlation between the VLF signal emitted from the ground station and the electron fluxes observed by the low-orbiting satellite. Inan et al. (1985) interpreted the observation of the SEEP experiment using the theory of particle-wave interaction. They proposed that the precipitation of particles was restricted by pitch angle distribution of those particles close to the loss cone.
During the same period, William et al. (1993) studied the VLF wave propagation in the D layer of the earth ionosphere, they proposed a multiple-mode three-dimensional model. Abel and Thorne (1998) proposed that in the inner radiation belt the electron flux reduction mainly induced by the VLF wave scattering, which cause the electrons fall into the loss cone. Their theoretical calculations indicated that the energy of wave-particle resonance decreases with higher L values. Furthermore, Richard et al.(2005) studied the mechanism of electron acceleration in the outer radiation belt. Their studies indicate that these electrons could be accelerated to MeV energy region by VLF wave with several kHz, and the electron fluxes in the observed region could rise to 3 orders of magnitude within one to two days.
The DEMETER satellite (Detection of Electro-Magnetic Emissions Transmitted from Earthquake Regions) launched by France in June 2004 is a low-orbiting electro-magnetic satellite with detectors onboard to measure space electric fields, magnetic fields and high energy particles and so on ( [Sauvaud et al.(2006)]; [Berthelier et al.(2006)]; [Parrot et al.(2006)]). These detectors provide us with the opportunity to further study the interactions between the man-made VLF wave and particles in the radiation belt.
By turning on and off the transmitter based on the NPM ground station, Inan, Graf et al studied the correlation between the ground VLF wave and the electron fluxes detected by on-board IDP (Instrument for Detecting Particles). The experiments were performed in ten different time scales ranging from second to minute, and they found correlations in 0.1 and 0.2 Hz ON/OFF frequency ( [Inan et al.(2007)]). However, subsequent experiments using the 0.1 Hz frequency (i.e. on for 5 sec and off for 5 sec, alternately ) indicated that the correlation rate is only 13.9 ( [Graf et al.(2009)]). Quite recently P. Wang et al.(2010) pointed out, the lower correlation rate may be caused by that IDP only can measure the electrons with big pitch angles.
Parrot, Sauvaud, Gamble, et al. studied the relation between the VLF emission from the transmitter at NWC ground station and the observation by IDP in relatively larger regions in space and longer time intervals. There were very strong ionosphere disturbance detected near the NWC ground station ( [Parrot et al.(2007)]). Moreover, due to the VLF wave emitted by the NWC transmitter, plenty electrons precipitate into the drift loss cone and drift eastward until into the SAA (South Atlantic Anomaly) to covered a region with L value between 1.4 1.7 during the local night period. The study also reported that the spectrum of local electrons has a wing-like structure ( [Sauvaud et al.(2008)]; [Gamble et al.(2008)]). There are also more relevant studies, for example, the numerical simulation for precipitation characteristics induced by five ground-based VLF transmitters ( [Kulkarni et al.(2008)]), the restriction of VLF wave in (18-25 kHz) in driving electron precipitation in inner radiation belt, as well as the effect of NAA station to electrons in outer radiation belt ( [Clilverd et al.(2008)]; [Clilverd et al.(2010)]).
Furthermore, recent studied have derived the theoretical models of the NWC VLF wave transmission in the ionosphere ( [Lehtinen and Inan(2009)]), and the different effect by ducted or non-ducted VLF wave propagation ( [Rodger et al.(2010)]). A report revealed the increasing of the MF component at the height of the DEMETER orbit over the VLF transmitters ( [Parrot et al.(2009)]). It is caused by the emissions of the global thunderstorm activity which are less attenuated when they cross the ionosphere above these locations.
We analyzed the IDP data during 2007 and 2008, when the NWC transmitter was turned off from June 2007 to February 2008 and turned on in the rest of the time. NWC transmitter has strong radiation power and the very narrow bandwidth of the VLF emission it provided us with the best opportunities in studying the mechanism of wave-particle interactions. In particular because the NWC station was kept either on or off for a long period, we have enough data to make a comprehensive study on the effect of man-made electron precipitation at high statistical significant level.
We analyzed the IDP data during 2007 and 2008, when the NWC transmitter was turned off from June 2007 to February 2008 and turned on in the rest of the time. NWC transmitter has strong radiation power and the very narrow bandwidth of the VLF emission it provided us with the best opportunities in studying the mechanism of wave-particle interactions. In particular because the NWC station was kept either on or off for a long period, we have enough data to make a comprehensive study on the effect of man-made electron precipitation at high statistical significant level.
For the first time, we analyzed the data observed by IDP during 7 months of NWC off and 10 months of NWC on. By using the (ON - OFF) method, we mapped the instantaneous electron belts, which are induced by the VLF wave emitted by NWC transmitter and are termed ”NWC electron belt”, or ”NWC belt” in brief. We also quantitatively studied the time-averaged characteristics of the NWC electron belts, for which we will present the distribution range along the longitude and magnetic shell of L parameter, the time-averaged energy spectrum of the precipitation electrons, the variation of the energy spectrum in different L shell intervals, and the diurnal variation of the electrons energy spectrum. The results of the analysis will be presented and discussed.
2 Statistical analysis of the NWC electron flux
The orbit of the DEMETER satellite is at the height of 670km (after 2006). It is a quasi-sun-synchronous orbit, and the orbital inclination is 98 . The satellite is three-axis-stabilized. During local daytime the satellite flies downward (from north to south) and the descending node is 10:30 at noon; during local nighttime it flies upward (from south to north) and the ascending node is 22:15 at midnight. The orbital period is 102.86 minutes. The repeated period of orbit location is around half of a month.
The NWC ground station locates in the northwest corner of Australia at (21.82 ∘S, 114.15 ∘E). Its geomagnetic coordinate is (31.96 ∘, 186.4 ∘).The NWC transmitter works on 19.8 kHz waveband with very narrow bandwidth of 300Hz, and the great emission power of 1MW.
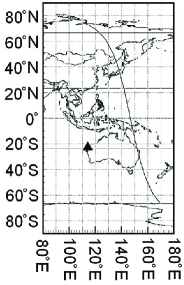
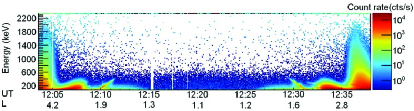
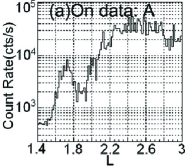
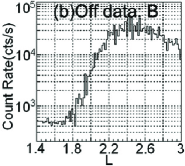
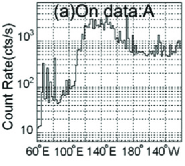
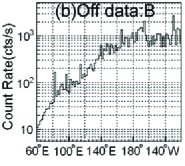
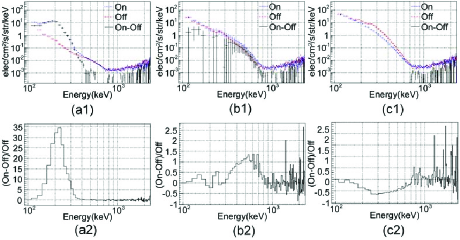
The IDP is placed on flank of the DEMETER satellite with field of view (FOV) of 32∘, which was pointing towards the west during the satellite upward flying at night and towards the east during the satellite downward flying at day time. So in the most case, only those electrons with big pitch angle close to 90 degree can be detected by IDP. Figure 1 shows the location of NWC station and a trajectory of a satellite orbit in east side. Figure 2 presents electron spectrogram detected by IDP along with this orbit. It should be noted that in Figure 2 there are two wing-like spectrum structures at lower energy band around L1.9 in the north and L1.6 in the south, which correspond to the precipitated electron belt induced by the NWC VLF wave. These will be the focus of this study.
We mapped the electron flux with the data in the entire year 2008. The flux was averaged in each of the 1∘by 1∘ pixels along the geographic latitude and longitude. The result was shown in Figure 3. The white boxes are the main regions of the VLF man-made electron belts corresponding to the ”wing” structure shown in Figure 1b). The black lines mark the value of the McIlwain parameter L at the height of the DEMETER satellite. Figure 3(a) shows the range of the VLF electrons ”wing” structure detected during the upward flying. Whereas during the downward flying, the VLF electron belts were detected to move toward east, extending all the way to the South Atlantic Anomaly (SAA) region in the southern hemisphere, as shown in Figure 3(b).
The two white boxed regions in Figure 3 (a) (upward data) correspond to the electrons belt near NWC position (SL: South Local) and the conjugation position of the NWC station (NL: North Local); whereas the three white regions in Figure 3 (b) (downward data) correspond to the SE (South East) region and NE (North East) region as well as the part of SE region extending into SAA region, which is belong to SE and marked separately.
Using upward orbit data, the same mapping have been made for each of individual month in 2007 and 2008. We find that the electrons precipitation belts in NL and SL region vanished from June 2007 to January 2008. So that the statistical analysis have been made for each of 24 months and both of upwards and downwards data respectively.
We select the longitude range of in (110∘, 170∘) for NL and SL regions (170∘, 260∘)for NE and SE regions, the L value in (1.6, 1.8) range, and the electron energy range of 20626.7keV for the analysis. The average count rate are calculated in each of (L, ) with unit size of (0.01, 1∘) and accumulated to get flux distributions within the selected region.
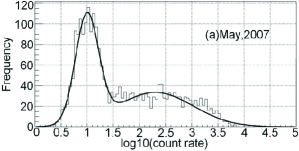
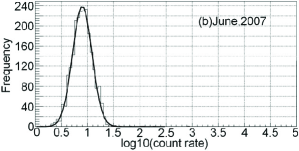
As examples, Figure 4 displays the result with the data in May and June 2007 respectively, which can be fit by (a)double Gaussian distribution, and (b) single Gaussian distribution in logarithm scale of averaged counting rate.
Compared with June, the distribution in May has one more component with very wide range of higher count rate, and the maximum value can be more than 1000 times of the average background value. Figure 5 shows the statistics result for each of 24 months in the two years. We can find that it has two components: a background component (mean1sigma1) with constant low count rate and a variable high count rate component (mean2sigma2).
This high count rate component was distributed in a wide range and more variable. It vanished from June 2007 to January 2008 which is consistent with the NWC off time, i.e. the time when there was no signal of the NWC transmission as mentioned in the paper by Zhang et al. (2009). So we can confirm that the high count rate component is contributed by the NWC transmission, because its appearance and disappearance clearly synchronize with the NWC on and off.
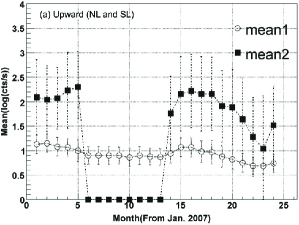
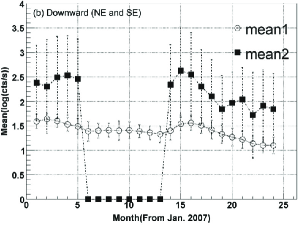
Based on the ON and OFF status shown in Figure 5, we selected ”ON data” and ”OFF data”, respectively. The ON data include the observations in ten months from March to May in 2007 and March to September in 2008, while the OFF data include the observations in seven months from July 2007 to January 2008. Since the Solar activity was keeping relatively quiet during 2007 and 2008, by subtracting the background ”OFF data” from the ”ON data”, (ON - OFF), we can smooth out short term random fluctuations. In addition, we can conduct detailed studies on the basic dynamic characteristics of the NWC electron belts using large data sets to get better statistical significance. Since the electron flux varies every month and NWC electrons are moving all the time, the obtained results reflect the average statistical characteristics. The results will be given in the following sections.
3 Spatial distribution of NWC electrons
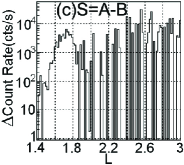
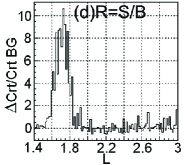
We selected the IDP data with electrons energy in 91678keV range, L value of (1.43) and geo-longitude value covering 180 degree. By (ON - OFF) method, the spatial distribution of NWC electrons have been investigated quantitatively. As an example, results for NL region are shown in Figure 6 and Figure 7. The average count rate of electrons were calculated for whole given geo-longitude range in each value of LL+L. The results for ON data (A), OFF data (B), signal (A-B), and the ratio of signal to background R (L) were respectively presented in Figure 6. Then The average count rate of electrons were calculated for whole given L range in each of geo-longitude interval , the results for different condition including R () were presented in Figure 7.
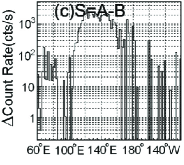
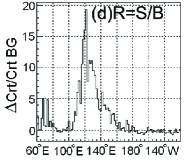
Using the same treatment, the analysis for the other three regions of (SL, NE , SE) were also carried out. The results of R (L) and R () for these regions are presented in Figure 8 and Figure 9.
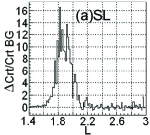
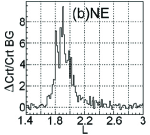
It is clearly shown that the distributions of NWC electrons have very complicated structures along the longitude and the magnetic shell. In SE region the effect from NWC VLF wave expands up to 300∘, which is deeply into SAA region due to the eastward drift of NWC electrons. With the high background electron flux in SAA, the NWC electrons still have S/B by factor of more than 12 times. The effect of expanding to the radiation belt along with magnetic shell up to L3 can also not to be ignored. These sufficiently indicate that the VLF emission of NWC transmitter powerfully influence the flux of the space electrons.
We define the range of drift lose cone for NWC electrons belts according to R (L) and R () distribution, and give the name as ”NWC electron belt”, or ”NWC belt” in brief, which are listed in Table 1.
| NL | SL | NE | SE | |
|---|---|---|---|---|
| L | 1.51.9 | 1.62.1 | 1.62.2 | 1.62.1 |
| L@ | 1.72 | 1.82 | 1.9 | 1.75 |
| 105E170E | 110E180E | 155E70W | 150E60W | |
| 120E | 117E | 125E | 160E | |
| NWC local time | 16:5022:30 | 16:5022:30 | 21:007:40AM | 21:007:40AM |
It’s worth mentioning that the data include both upward data (night for the satellite) and downward data (day for the satellite), so overlapping range exists along the longitude direction. The longitude ranges in Table 1 correspond to the local nighttime of the NWC station from 16:50 to 7:40am. Since the increasing of the NWC electron flux can only be obviously observed during the NWC night, the belts cover half the Earth with 180 degree along the longitude. The related ionosphere effect will be discussed in the subsequent section 4.2.
4 Energy spectrum of NWC electrons
We investigated the energy spectrum of NWC electrons and its variation in various situations. The spectra were accumulated by On, Off, and (On-Off) respectively. The selected region is basically according to Table 1.
4.1 Variation of energy spectrum along with L shell value
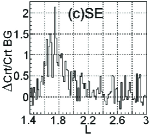
According to the results shown in Section 3, we noted that, at a certain altitude, the flux of NWC electrons varied with L value of the satellite passed. The same effect exists for energy spectrum. As an example, we presented the result for NL region in Figure 9. The differential energy spectrum in three narrow range of L shell are presented for ON, OFF, and (ON - OFF) status respectively. We firstly revealed that: (a). Within NWC belt (L: 1.6 1.65), flux of NWC electrons has a peak centered at 220keV with S/B of 35 times; (b) For higher L region of 1.9 1.95, the electron enhancement reduced and dominated in 300keV 1MeV, which reach to a maximum value of S/B about 1.3 times near 600keV; (c) For region in inner radiation belt L:2.05 2.1, a slot region is formed by the NWC electrons below 700keV, with S/B value reaching -60 near the peak of 300keV. In all three situations, no NWC particles exist with energy above 1MeV except the statistical fluctuation.
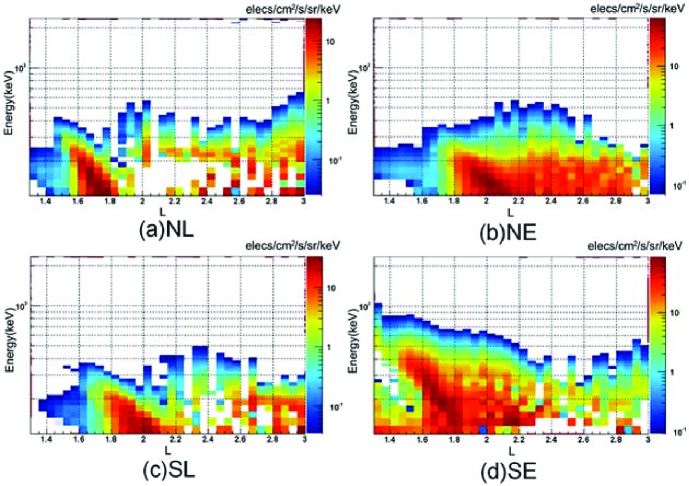
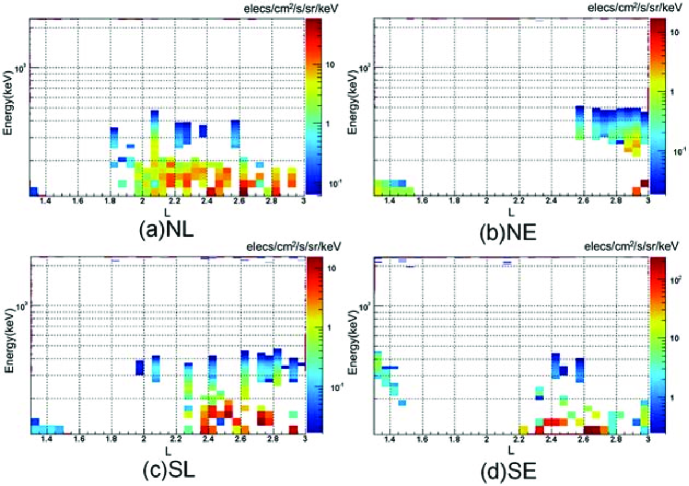
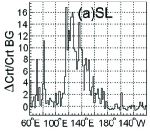
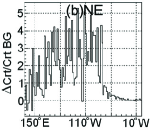
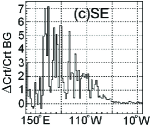
In order to accurately investigate the evolvement of NWC electrons energy spectrum along with L shell value, we performed further study of spectrogram for the L shell with value from 1.3 to 3 in step size of 0.05 for the four NWC electrons belts, which have the same longitude range with table 1. The obtained results of enhanced electron fluxes from ON-OFF value are shown in Figure 11 and that of lost electrons shown in Figure 12.
From Figure 11 and 12, we can
find the following characteristics
of NWC electrons energy spectrum:
1), In all 4 regions with electrons precipitation, the spectra
show obvious ”wing” structures in relative lower L shell range.
The main part of ”wing” structures correspond to NWC electrons
belts which have been defined in Table 1.
2), In Local regions, there are obvious slot effect caused by
electron loss in the energy range of 100 200keV. The
electron loss is most obvious in north region (NL) corresponding
to L shell value in 1.95 2.5. The spectrum shows irregular
structure in south
region (SL) corresponding to inner radiation belt with L ¿ 2.2.
3 In Eastward regions, there are no obvious slot effect of NWC
electrons. The enhancement in NE and SE region with energy ¡300keV
extend to L 2.5 and even to L 2.9 respectively. The
fluxes of lost electrons are rather lower, the distributions are
mainly in 300 400keV range and slightly different between
in SE and in NE.
Related to the physical mechanism, our understanding is that, the ”wing” structures should be most likely caused by local interactions between original 19.8 kHz of VLF wave and space electrons, which induce the electrons pitch angle scattering and precipitation into loss cones. The original VLF wave, most probably, come from NWC transmitter by direct ducted propagation. And more electrons covered wider L shell range in Eastward are the results from drift of precipitation electrons along with longitude and magnetic shell, as well as from more electron resource provided by SAA and inner radiation belt.
There are two more factors need to be mentioned here. First, our analysis uses a geographic longitude coordinates rather than the geomagnetic longitude coordinates. It may cause the difference between north and south, east and west, for example, the covered L range of ”wing” feature are more similar between NL and SE, as well between SL and NE. Another factor is the ”east-west” effect of electron fluxes caused by opposite pointing of IDP aperture during upward and downward of the orbit. The difference is usually equal to around 16 in mid-latitudes of northern hemisphere NL (0 28circ) (Li XQ et al., 2010). The effect for NWC belts in higher latitude can be roughly estimated from Figure 5. The differences of background fluxes between two regions could reach to two times or more. Similar effect for NWC electrons can also be seen in the figure.
4.2 Differential energy spectrum of NWC electrons and ”Day-Night” effect
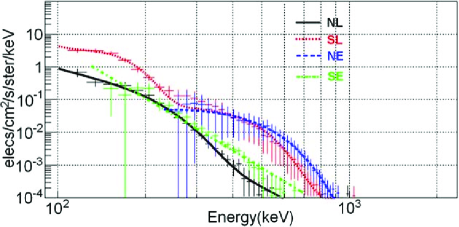
By (On-Off) method, we obtained total differential energy spectra of NWC electrons, which are accumulated from each of 4 regions defined in Table 1. Figure 13(a) presents the spectra related to NWC local night time using upward data for SL and NL region, and downward data for SE and NE region. Figure 13(b) is the spectra related to NWC local daytime using downward data for SL and NL region, and upward data for SE and NE region. For each spectrum, the average energy, the integrated energy density and the integrated flux density, as well as the differences of these physical parameters between NWC day time and night time have been derived and listed in Table 2 and Table 3, respectively.
| Area | Average Energy | Integrate influence | Integrated Flux |
|---|---|---|---|
| (keV) | () | () | |
| NL | 167.0 (11.1) | 3.59 (0.12) | 1344.1 (43.7) |
| SL | 169.8 (12.8) | 2.68 (0.10) | 986.8 (36.8) |
| NE | 176.1 (7.4) | 7.60 (0.16) | 2696.2 (54.4) |
| SE | 185.2 (8.5) | 7.54 (0.17) | 2543.5 (58.0) |
| Area | Average Energy | Integrate influence | Integrated Flux | Flux ratio |
|---|---|---|---|---|
| (keV) | () | () | (night/day) | |
| NL | 157.7 (39.7) | 0.096 (0.012) | 38.0 (4.8) | 35.4 |
| SL | 161.0 (31.7) | 0.601 (0.065) | 233.7 (20.8) | 4.2 |
| NE | 378.6 | 0.071 (0.032) | 11.7 (5.9) | 231.1 |
| SE | 203.8 (109.5) | 0.063 (0.016) | 19.4 (5.4) | 130.9 |
Here we give brief discussion about the result.
1), During NWC local night time, spectrum feature are different
between local and eastward region. The spectrum in SL and NL
region has almost the same feature, with the same peak below
200keV and the same cutoff energy 5 at 500keV. There is
enhancement of electrons flux in Eastward region and the cutoff
energy increase to 800keV. This phenomenon indicates the existence
of continuous process of the electron precipitation and being
accelerated during drift.
2), During NWC Local daytime, we still can see the NWC electrons,
but the fluxes of electrons are rather weak, and the spectrum
features are quite different with each other. The cutoff energy of
NL and SL region are increased to 600keV and 700keV respectively.
The energy spectrum takes on anti-symmetric structure, the flux in
SL region is strongest and NL is weakest. The spectra in eastward
region show more absorption of electrons on their way of drift, so
that only the Electrons with E 250keV in NE region can be
observed. As we know that the average energy of wave-particle
resonance is 170 keV for 19.8 kHz VLF wave, so it at least
implicates that the original 19.8 kHz of VLF wave almost can not
reach to NE region due to ionosphere absorption during daytime.
3), We find out that the integrated electrons fluxes in daytime
observation can be well fitted by a quadratic function versus the
angle distance of D, which are calculated from coordinate of
central position for each belt related to the coordinate of NWC
ground station. The result is presented in figure
14, and formula 1 where D
denotes the angle distance with unit of radian.
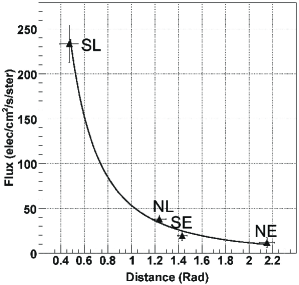
| (1) |
It provided the evidence that the wisp part of NWC electrons are induced by original 19.8 kHz of VLF emission which are directly propagated from NWC ground station, It play major contributions to NWC electrons during NWC night time, and the strong ionosphere absorption during NWC day time. This is consistent with what we discussed in the previous subsection.
5 Verification of wave-particle theory from the pitch angle distribution
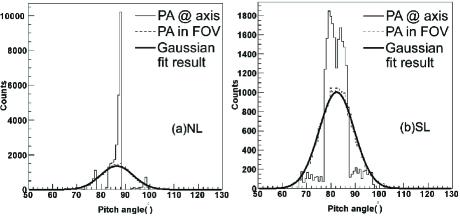
IDP has no ability to identify the pitch angle of incident particles. So, the direction between the axis of IDP aperture and the local magnetic field is taken as the pitch angle and recorded into the database. For each of four NWC electron belts, we make such kind of pitch angle distribution, as example, the results for NWC night time in NL and SL region are presented in Figure 14. The actual distribution has to be expanded by a normalized Gaussian function with 32∘ FOV, here we take 16∘ as 3, to obtain the pitch angle response function of the observational incident electrons. Analysis shows that the distributions are quite different in different belt regions, as well as between NWC day and NWC night. But in all of the results, measurable electron pitch angle are distributes mostly within 60 110∘.
In the inner radiation belt, based on resonant interaction after ignoring the energy diffusion the quasi-linear diffusion equation (Fokker-Planck equation) can be written as([Melrose et al.(1980)]):
| (2) |
Where f(,E,L) is density function in phase space, which depends on local pitch angle of , kinetic energy of E and Mc Ilwain parameter of L. is local pitch angle diffusion coefficient, which contains all information about wave-particle interaction. As for NWC electrons with a given value of L shell and kinetic energy of E, the value of local diffusion coefficient rely on the pitch angle distribution.
Local diffusion coefficient of resonant interaction between electrons and VLF wave can be written as [Summers et al.(2005)]:
| (3) |
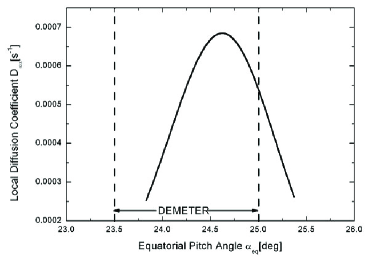
Where = v/c, B is Earth’s magnetic field; and are reduced parameter defined as ==/, =/; and are reduced variable with =/, =c, respectively. Assuming pitch angle diffusion is occurred only within equatorial plane and is valid for purely field-aligned wave propagation, we obtain equatorial pitch angle diffusion coefficient.
According to the DEMETER observation, to calculate equatorial pitch angle diffusion coefficient, parameters are chosen as follows: = 19.8kHz as frequency of maximum wave power, = 150Hz and wave amplitude b =10pT. Equatorial magnetic field is given by dipole model B = 3.11* 105/L3T and equatorial plasma density N0 = 880* (2/L)4cm-3 which is within the range given by ( [Angerami et al.(1964)]; [Inan et al.(1984)]).
From Figure 16, we can clearly find that electrons pitch angle is just within the FOV range or nearby of IDP, where electrons participate the interaction with VLF wave transmitted by NWC. As a result these electrons are observed by DEMETER after diffusion process. The reason for the appearance of ”NWC man-made radiation belt” thus is probably explained by pitch angle diffusion based on resonant interaction.
6 Summary and discussion
Based on DEMETER IDP observations at the altitude of 670 km, the characteristics of the electrons precipitation, induced by VLF wave emission from NWC station, have been firstly studied in detail and quantitatively. With the long term observation data related to NWC on and off, the background can be eliminated by (On-Off) method with high statistics. For the first time, the space distributions, the spectrogram via L shells, and the differential energy spectra of NWC electrons have been obtained.
The results based on NWC night data indicate that, at 670 km height, NWC VLF wave induced huge enhancement of electrons flux in broad space range including the belts with ”wing” structure. But it also causes the electrons flux reduction which happened in lower energy band and at some higher L regions. The electrons precipitation, whatever enhancement or reduction, all can be explained by pitch angle scattering of the electrons, which caused by wave-particle resonance interactions, and possibly by the electrons drift along the longitude. This phenomenon is a kind of dynamic balanced process of the electrons flux variations. It depends on which process is dominated for the electrons either enhanced locally from higher L shell or moving down to the lower L shell.
Used the data from both of NWC daytime and night time, respectively, for the first time, the energy spectra are analyzed for each of 4 belt regions. It has been shown that there are still electrons enhancements during NWC daytime. But the fluxes are rather weak comparing the results in NWC nighttime, even the electrons in lower energy band are all disappear in eastward region. It’s already well known that this is caused by VLF wave absorption of ionosphere at daytime. Interestingly, this effect presents more regularity between the electron flux and the distance of VLF wave propagations, which shown inverse-quadratic function relation (Fig. 14 and equation 1). This easily links with the fact that the VLF energy density attenuates by distance squared and then requires the linearity relation between the flux of the precipitated electrons and the energy density of the VLF wave. This analysis provides reference for studying the ionosphere transmission characteristics of VLF wave.
We may study more in further work.
Acknowledgements.
This work is based on observations with the electric field experiment ICE and the energetic particle experiment IDP embarked on DEMETER, which is operated by the Centre National d’Etudes Spatiales (CNES). The authors thank J. J. Berthelier, the PI of ICE, and J.A. Sauvaud, the PI of IDP for the use of the data. The authors would like to express their sincere thanks for Doctor Zhenxia Zhang’s help for this paper. This work was supported by National High-tech RD Program of China (863 Program) (2007AA12Z133).References
- [Abel et al.(1998)] Abel, B., and Thorne, R. M.: Electron scattering loss in earth’s inner magnetosphere-1. Dominant physical processes, J. Geophys. Res., 103, 2385-2396, 1998.
- [Angerami et al.(1964)] Angerami, J. J, and Thomas, J. O, Studies of planetary atmospheres, J. Geophys. Res.,69, 4537, 1964.
- [Berthelier et al.(2006)] Berthelier, J.J., et.al., ICE, the electric field experiment on DEMETER, Planetary and Space Science, 2006, 54: 456-471
- [Bullough et al.(1976)] Bullough, K., A. R. L. Tatnall and M. Denby, Man-made e.l.f./v.l.f. emissions and the radiation belts, Nature Vol. 260 April 1 1976.
- [Clilverd et al.(2008)] Clilverd, M. A., C. J. Rodger, R. Gamble, N. P. Meredith, M. Parrot, J.-J. Berthelier, and N. R. Thomson (2008), Ground-based transmitter signals observed from space: Ducted or nonducted?, J. Geophys. Res., 113, A04211, doi:10.1029/2007JA012602.
- [Clilverd et al.(2010)] Clilverd, M. A., C. J. Rodger, R. J. Gamble, T. Ulich, T. Raita, A. Seppälä, J. C. Green, N. R. Thomson, J. Sauvaud, and M. Parrot (2010), Ground-based estimates of outer radiation belt energetic electron precipitation fluxes into the atmosphere, J. Geophys. Res., 115, A12304, doi:10.1029/2010JA015638.
- [Gamble et al.(2008)] Gamble, Rory J., Craig J. Rodger, Mark A. Clilverd et al., Radiation belt electron precipitation 1 on by manmade VLF transmissions, INIST-CNRS, Cote INIST : 3144, 35400018393042.0200, 2008.
- [Graf et al.(2009)] Graf, K. L., U. S. Inan, et al., DEMETER observations of transmitter-induced precipitation of inner radiation belt electrons, J. Geophys. Res., 114, A07205, doi:10.1029/2008JA013949, 2009.
- [Imhof et al.(1983)] Imhof, W. L., J. B. Reagan, H. D. Voss, et al., Geophydical Research Letter, Direct Observation of Radiation Belt Electrons Precipitation by controlled injection of VLF Signals from a Ground-based Transmitter Vol/10, No.4, 361-364, 1983.
- [Horne et al.(2005)] Horne, Richard B., Richard M. Thorne, Yuri Y. Shprits, et al., Wave acceleration of electrons in the Van Allen radiation belts, Nature, Vol 437, doi: 10.1038/nature03939, 2005.
- [Inan et al.(1984)] Inan, U. S, Chang, H. C, and Helliwell R. A , Electron precipitation zones around major ground-based VLF signal sources, J. Geophys. Res., 89, 2891, 1984.
- [Inal et al.(1985)] Inan, U. S., H. C. Chang, et al., Precipitation of radiation belt electrons by man-made waves: a comparison between theory and measurement, J. GeoPhy. Res., 90, 359-369, 1985.
- [Inan et al.(2007)] Inan, U. S., M. Golkowski, et al., Subionospheric VLF observations of transmitter-induced precipitation of inner radiation belt electrons, GeoPhy. Res. Lett., 34, L02106, doi:10.1029/2006GL028494, 2007.
- [Kimura et al.(1983)] Kimura, I., Matsumoto H., Mukai T., et al., EXOS-B/SIPLE station VLF wave-particle interaction experiments: general description and wave-particle correlations, J. GeoPhys. Res., Vol. 88, No. A1, pp. 282-294, 1983.
- [Kulkarni et al.(2008)] Kulkarni, P., U. S. Inan, T. F. Bell, and J. Bortnik (2008), Precipitation signatures of ground-based VLF transmitters, J. Geophys. Res., 113, A07214, doi:10.1029/2007JA012569.
- [Lehtinen and Inan(2009)] Lehtinen, Nikolai G. and Umran S. Inan, Full-wave modeling of transionospheric propagation of VLF waves, Geophys. Res. Lett., 36, L03104, doi: 10.1029/2008GL036535, 2009.
- [Li et al.(2010)] Li, Xin-Qiao, Ma, Yu-Qian, et al., Observation of Particle on Space Electro-Magnetic Satellite during Wenchuan Earthquake, C.J. GeoPhy., DOI:10.3969/j.issn.0001-5733.2010.09
- [Melrose et al.(1980)] Melrose, D. B., Plasma Astrophysics, (New York: Gordon and Breach) 1980.
- [Parrot et al.(2006)] Parrot, M., et. al., The magnetic field experiment IMSC and its data processing onboard DEMETER: Scientific objectives, description and first results, Planetary and Space Science, 2006, 54 :441-455
- [Parrot et al.(2007)] Parrot, M., J. A. Sauvaud, et al., First in-situ observations of strong ionospheric perturbations generated by a powerful VLF ground-based transmitter, Geophys. Res. Lett., 34, L11111, doi:10.1029/2007GL029368, 2007.
- [Parrot et al.(2009)] Parrot, M., Inan U. S., Lehtinen N. G. and Pincon J. L., Penetration of lighting MF signals to the upper ionosphere over VLF ground-based transmitters, J. Geophys. Res., Vol. 114, A12318, doi: 10.1029/2009JA014598, 2009.
- [Rodger et al.(2010)] Rodger, C. J., B. R. Carson, S. A. Cummer, R. J. Gamble, M. A. Clilverd, J-A. Sauvaud, M. Parrot, J. C. Green, and J.-J. Berthelier, Contrasting the efficiency of radiation belt losses caused by ducted and non-ducted whistler mode waves from ground-based transmitters, J. Geophys. Res., 115, A12208, doi:10.1029/2010JA015880, 2010.
- [Sauvaud et al.(2006)] Sauvaud, J.A., Moreau, T., Maggiolo, R., et al., High-energy electron detection onboard DEMETER: The IDP spectrometer, descripsion and first results on the inner belt, Planetary and Space Science, 2006, 54:502-511
- [Sauvaud et al.(2008)] Sauvaud, J.-A., R. Maggiolo, et al., Radiation belt electron procipitation due to VLF transmitters : satellite observations, Geophys. Res. Lett., 35, L09101, doi:10.1029/2008GL033194, 2008.
- [Summers et al.(2005)] Summers, D, Quasi-linear diffusion coefficients for field-aligned electromagnetic waves with applications to the magnetosphere, J. Geophys. Res., 110, A08213, 2005.
- [Wang et al.(2011)] Wang, P. et. al., The remendiation of radiation belt electrons caused by ground base man-made VLF wave, Acta Physica Sinica, 2011, 60:23-28 (to be published)
- [Poulsen et al.(1993)] Poulsen, William L., Umran S. Inan and Timothy F. Bell, A multiple-mode threedimensional model of VLF propagation in the Earth-ionosphere waveguide in the presence of localized D region disturbances, J. GeoPhy. Res., 98, A2, 1705-1717, 1993.
- [Zhang et al.(2009)] Zhang, Xue-min, Shen, Xu-hui et al., VLF electric filed anomalies in ionosphere before Wenchuan M8 earthquake in Sichuan, C.J.R.S. 2009 24(6) 1-9.