A statistical model for the -ray variability of the Crab nebula
Abstract
A statistical scenario is proposed to explain the -ray variability and flares of the Crab nebula, which were observed recently by the Fermi/LAT. In this scenario electrons are accelerated in a series of knots, whose sizes follow a power-law distribution. These knots presumably move outwards from the pulsar and have a distribution in the Doppler boost factor. The maximal electron energy is assumed to be proportional to the size of the knot. Fluctuations at the highest energy end of the overall electron distribution will result in variable -ray emission via the synchrotron process in the MeV range. Since highly boosted larger knots are rarer than smaller knots, the model predicts that the variability of the synchrotron emission increases with the photon energy. We realize such a scenario with a Monte-Carlo simulation and find that the model can reproduce both the two -ray flares over a period of year and the monthly scale -ray flux fluctuations as observed by the Fermi/LAT. The observed -ray spectra in both the steady and flaring states are also well reproduced.
1 Introduction
The Crab pulsar wind nebula is powered by its central pulsar born from a supernova explosion in 1054. It is a very luminous source in almost all wavelengths, from radio to the very high energy (VHE) -ray bands. The broadband non-thermal emission spectrum is well modeled by a synchrotron-inverse Compton (IC) scenario (Atoyan & Aharonian, 1996; Meyer et al., 2010) with the transition from the synchrotron to IC component occurring at a few hundred MeV (Abdo et al., 2010b). The overall emission seems to be steady, so that the Crab nebula has been adopted as a standard candle in high energy astrophysics to calibrate observations from different instruments.
However, detailed images of the Crab nebula in optical and X-ray bands indicated dynamical structures at small scales. Observations by the Hubble Space Telescope revealed wisps and knots in the nebula, and resolved some substructures of the highly variable wisps (Hester et al., 1995). X-ray observations by ROSAT and Chandra uncovered a jet-torus structure of the inner nebula (Hester et al., 1995; Weisskopf et al., 2000), and the equatorial ring is found moving outwards with a speed of (Hester et al., 2002). At higher energies in the -ray band, detailed structures of the nebula generally can not be resolved. However, COMPTEL and EGRET observations indicated that the synchrotron radiation in MeV is variable on a timescale of yr (Much et al., 1995; de Jager et al., 1996).
In September 2010, AGILE collaboration reported a -ray flare above MeV from the direction of the Crab nebula, which lasted for about 3 days (ATel #2855; Tavani et al. 2011). The flux during the flare period is about times higher than the average one. This flare was soon confirmed by the Fermi/LAT collaboration (ATel #2861), and archive search of the Fermi/LAT data revealed another flare in February 2009 (Abdo et al., 2010a). There were many other simultaneous or follow-up measurements for the flare in September 2010 in X-ray, optical, infrared and radio bands. However, no significant flux enhancement was discovered. In the VHE -ray energies, ARGO-YBJ collaboration claimed the detection of a flux enhancement around TeV, with a possibly longer duration (ATel #2921). However, MAGIC and VERITAS observed the source with a shorter duration during the flare phase and did not reveal any enhancement in flux (ATel #2967, #2968).
It was proposed that the flares was due to synchrotron emission of ultra-relativistic electrons with energies up to PeV (Abdo et al., 2010a). Considering the fact that the rest frame synchrotron radiation in a magnetic field dominated acceleration regime can not exceed MeV due to the fast synchrotron cooling of high energy electrons (Blumenthal & Gould, 1970; Lyutikov, 2010), the observed GeV emission implies Doppler shift of the radiation region or other acceleration mechanisms instead of shock acceleration (Abdo et al., 2010a). Komissarov & Lyutikov (2010) proposed that the -ray variability (flare) originated from the “inner knot” of the Crab nebula (“knot 1” as defined in Hester et al. (1995)), with mildly Doppler-boosted emission. The instability of the termination shock may cause the variability as revealed by magnetohydrodynamic (MHD) simulations. Bednarek & Idec (2010) suggested that electrons are accelerated in a region behind the shock, and the variability was attributed to changes in the maximum energy of accelerated electrons, electron spectral index or the magnetic field.
In this Letter we employ a statistical approach to model the -ray variability of the nebula. Fermi/LAT observations have shown that the low-energy synchrotron component is variable on monthly time scale, while the high-energy IC component seems to be stable (Abdo et al., 2010a). Since the synchrotron -rays are produced by the highest energy electrons, these observations indicate that fluctuations at the high-energy end of the electron distribution might be responsible for the variability. It is natural to expect that events that can generate the highest energy electrons are rarer, and therefore would lead to the largest fluctuation. Therefore the variability and flares in the sub-GeV -rays can be simply due to the statistical fluctuation of the highest energy electrons achievable in the electron accelerators. Lower energy electrons do not suffer from significant fluctuations since many more accelerators can contribute to them simultaneously, which gives rise to a “steady-state” emission in both the lower energy synchrotron component and the higher energy IC component.
2 The Model and Results
We build a physically possible model to investigate the above picture in more details. We assume that electrons are accelerated in a series of knots with a power-law energy spectrum with the maximum electron energy being proportional to the size of the th knot111The maximum energy of electrons will reach a critical value when the synchrotron cooling is essential. The critical Larmor radius is estimated as pc, which just corresponds to the size of the emission region as indicated by the day-scale flare. Therefore we assume the largest size of the knots is , and for all other knots smaller than the scaling relation between and can well hold.. We further assume that the size of knots has a power-law distribution . Adding the contribution from all these knots together, noticing that the normalization of the synchrotron spectrum of the knots scales as , we get the total electron spectrum as
| (1) | |||||
where is the Heaviside step function, is the maximum energy of the largest knot. If , the above integral of the last step is approximately proportinal to given the maximum energy of the largest knot ; if the integral is nearly a constant determined by . Therefore the electron spectrum is a power law with power-law index and a cutoff determined by the largest knot.
The maximal energy of synchrotron emission in the magnetic field dominated acceleration regime is MeV (Blumenthal & Gould, 1970) (defined by equating the synchrotron cooling time scale to the gyro-period, the minimum of the acceleration time scale). For smaller accelerators, the maximum energy is also limited by the size of the accelerator. In order to account for the observations in the MeV range, we therefore further employ a mild Doppler boost factor. We assume a Gaussian distributed Lorentz factor of all the knots with a mean value and a standard deviation . Such a Lorentz factor is consistent with the upper limit of the typical velocity of the jet (Abdo et al., 2010a). We assume that the angle between the knot motion and the line-of-sight is randomly distributed. The Doppler factor (where is the velocity of the knot in unit of ) therefore is distributed within the range for a distribution of . Only knots with large enough size and large enough Doppler factor can contribute to high energy synchrotron radiation to account for the flares observed by the Fermi/LAT.
We realize such a picture by a Monte-Carlo simulation. We directly simulate the synchrotron spectrum in each knot instead of the electron spectrum. The synchrotron spectrum of each knot in its co-moving frame is adopted as , where , is the synchrotron spectral index. where is the power-law index of the overall electron distribution. The magnetic field in each knot is not explicitly used in the calculation. The magnetic field will affect the cooling break of the low energy synchrotron spectrum as well as the high energy cooling time scale. To keep the basic framework of the present study, we may expect the magnetic field not to vary significantly with respect to the knot size.
The energy loss of electrons in the knots can be important and needs to be considered. For instantaneous injection of accelerated electrons, the probability of observing electrons at a given energy is proportional to the corresponding synchrotron cooling time . For low energy electrons with cooling time longer than the age of the Crab nebula yr, these electrons will survive and accumulate. Therefore we can construct a probability function , describing the effect of cooling on the electron spectrum. The cooling time of electrons producing synchrotron photon with energy is yr. For an average magnetic field mG, a mildly Doppler factor , electrons producing photons with an energy eV have a cooling time comparable to . The observed spectrum of Crab nebula has a break near eV (see below Fig. 1).
In this work we mainly focus on the high energy part of the spectra, e.g., from X-ray to -ray band, then . Assuming that the accelerated electrons have a spectrum index , the electron spectrum index in the synchrotron cooling dominated regime is then . Here we adopt which corresponds to , as required by fitting the radio-optical data (Meyer et al., 2010). The maximum value of is taken as MeV in the co-moving frame (corresponding to the largest knot). This value is derived according to a fit to the average Fermi/LAT spectrum of the synchrotron component (Abdo et al., 2010b), given the Lorentz factor distribution. The power-law index of the size distribution is adopted as . Adding all the contribution from the knots together we can get a total synchrotron spectrum , which can reproduce the observed optical-MeV band data of the Crab nebula (Fig. 1). Note that these parameters, i.e., , , and are not uniquely determined. What we adopt in this work is an illustration of the model. Once the data from optical to -ray band are reproduced, the discussion below is basically unchanged if a different set of parameters is taken.
For each knot we randomly generate an angle and a Lorentz factor based on the assumed Gaussian distribution, and calculate the Doppler factor . Then the frequency of synchrotron emission from each knot is shifted from to , and the flux is enhanced to . The contribution from all the knots are summed up to obtain the total emission spectrum.
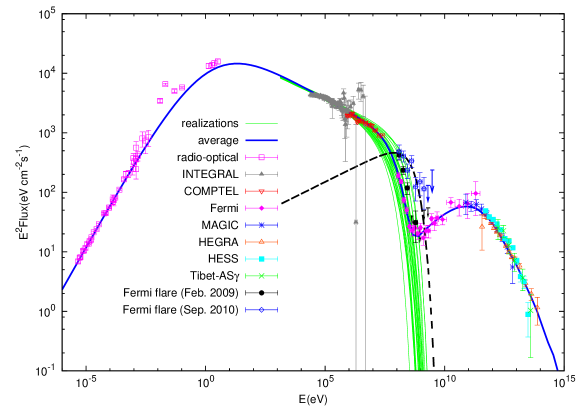
A series of simulated synchrotron spectra are shown in Fig. 1, which are compared with the observational data of the Crab nebula. Note that for the INTEGRAL data we adopt a flux normalization factor in order to be consistent with the extrapolation of COMPTEL data. In Meyer et al. (2010) a factor was adopted to match the XMM-Newton data. The difference of flux normalization may be due to discrepancies in calibration of different detectors. The fact that the INTEGRAL data may contain emission from the Crab pulsar may also contribute to the difference. For comparison we show the fitting results to the broad band data with the blue thick line, with a broken power-law electron spectrum. This result is similar to the model invoking two population electrons as introduced in Atoyan & Aharonian (1996) and Meyer et al. (2010). It is shown that the simulated synchrotron spectra have very small fluctuations in the X-ray energy band, but fluctuate significantly at higher energies ( MeV). The average of the simulated -ray flux would be consistent with the long term Fermi/LAT and COMPTEL data. The fluctuations can be responsible for the observed variabilities and flares.
The very large flare at September 2010 that is not well reproduced by these simulations can be regarded as an event with very small probability. Such an event may be due to a large knot with specific parameters different from what used in the model. The black-dashed line in Fig. 1 shows a possible reproduction of the large flare, produced by a knot with maximum size, Doppler factor , cutoff energy of synchrotron radiation in its comoving system MeV and an additional normalization factor of the flux. Detailed modeling of the knot formation and its evolution is expected to better address this issue.
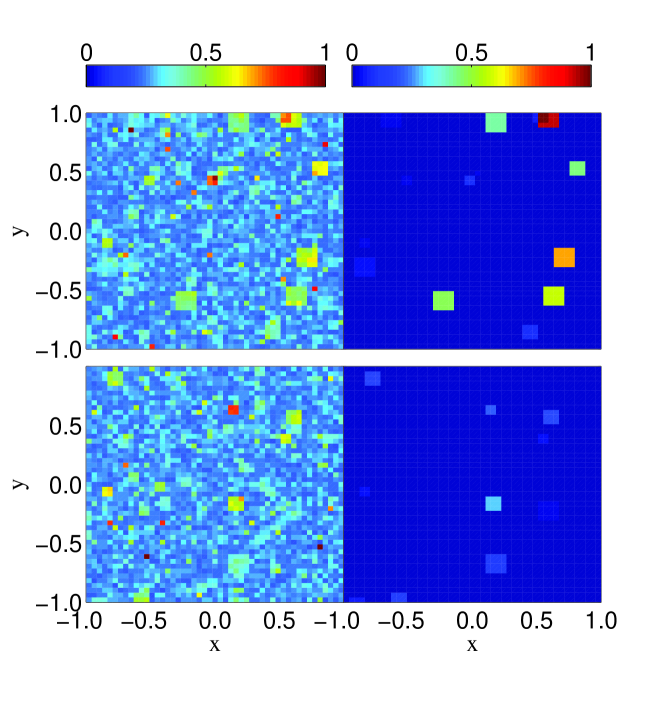
We pick out two realizations and show the synchrotron sky-maps at 10 keV (left) and 100 MeV (right) in Fig. 2, respectively. To generate a sky-map, we designate an plane with pixels. We randomly assign a position for each knot in the plane, with the largest knot having a size of pixels. We then sum up contributions of all the knots located in each pixel and obtain the sky-map. It is shown that in the X-ray band (left panels) the skymaps are relatively smooth with some hot spots due to several large knots. These hot spots may correspond to the Chandra and Hubble knots of the Crab nebula (ATel #2882, #2903). The total flux of X-ray emission, however, is statistically steady from time to time. The width of the total X-ray flux distribution at keV is estimated to be of the order , which is consistent with the upper limit of obtained by Swift/BAT (ATel #2858). The MeV -ray sky-map could differ significantly from each other. In some cases, one or several large knots would dominate the total flux. The predicted energy-dependent spatial scales due to fluctuations may not be ready to test with the available high energy telescopes, but higher angular resolution observations in the future will help.
According to our model, the IC component should not show significant variability except in the high energy regime ( TeV), depending on the maximal electron energies. For example, for a magnetic field mG, the maximal Lorentz factor of electron can be as high as . Therefore only the IC photons with energies higher than several hundred TeV would have relatively large fluctuations. This conclusion is different from that of Bednarek & Idec (2010), who suggested that the IC -ray spectra also vary significantly at multi-TeV energies.
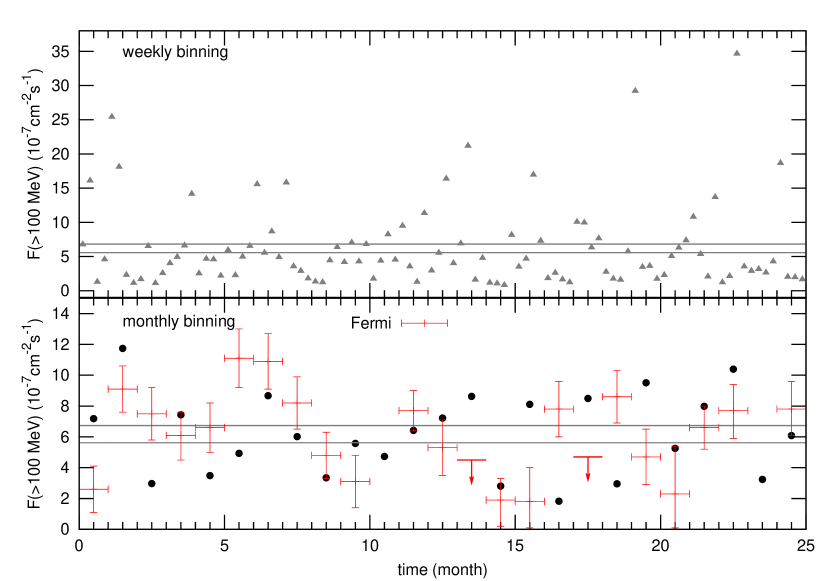
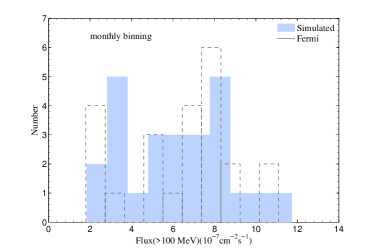
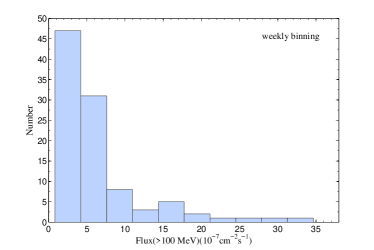
To investigate fluctuations of emission in detail, we show in Fig. 3 the light curves of the simulated synchrotron fluxes in the MeV energy band. Each bin of the light curves represents an independent realization, and the length of the time bin is proportional to the number of knots. We normalize the time scale so that over a year there is an enhancement in flux by at least a factor of 5-6, which may be responsible for a flare, and plot the weekly and monthly bin lightcurves in the upper and lower panels of Fig. 3, respectively. For comparison we also plot the Fermi/LAT observed monthly light curve (Abdo et al., 2010a) in the lower panel of Fig. 3. It can be seen that the predicted fluctuation level of the simulated results is very similar to that observed by Fermi/LAT. In order to show this more clearly, we plot the histogram of the monthly bin flux distribution for the simulated results along with that of Fermi/LAT observation in the left panel of Fig. 4. These two distributions are indeed similar. In the right panel of Fig. 4 the histogram of flux distribution for weekly bin is also plotted. A concentration toward low-flux is evident, which is distinct from a symmetric distribution around the average value. This is because in the short time scale limit, the distribution of the gamma-ray fluxes is determined by the distributions of the knots (power-law) and the Doppler factors. Only the knots with both large enough sizes and high enough Doppler factors can produce large gamma-ray fluxes. Therefore the probability to give large fluxes is very small, and the flux distribution concentrates towards low-flux values. In the limit of long time scale, the distribution should be Gaussian as a result of central limit theorem. Such a prediction can be tested by a detailed analysis of the Fermi/LAT data.
3 Conclusion and discussion
In summary, we propose a statistical picture to explain the observed -ray variability and flares of the Crab nebula, using the fluctuations of the highest end of the electron spectra. The electrons are thought to be accelerated in a series of knots, with a size distribution and a distribution of the Doppler factor. The maximal energy of the electrons in the co-moving frame is assumed to be proportional to the size of the knots. Thus the rare knots with large sizes and high Doppler boosts may generate electrons up to PeV, and hence, be responsible for the observed -rays flares at Fermi/LAT. On the other hand, the low energy electrons are generated by many smaller knots. The average effect smooths the fluctuation, so that the low energy synchrotron component and the IC component do not change significantly. This scenario can naturally explain both the variability in the MeV-GeV band, and the relatively steady emission in lower (optical, X-ray) and higher (TeV) energies. The expected variability of the monthly bin fluxes above 100 MeV are well consistent with that observed by Fermi/LAT. The two large -ray flares can also be naturally accounted for without additional assumptions.
In the simulation, we do not consider the detailed structure (e.g. jet, torus) of the nebula. The knots are assumed to have a uniform and isotropic distribution. Considering a more realistic morphology of the nebula would not affect our conclusion noticeably, as long as the distributions of the knot sizes and Doppler factors are similar to those introduced here. In more general terms, these knots may be interpreted as individual electron acceleration events distributed throughout the nebula. We point out that at low energies contributions from large amount of knots are equivalent with previous studies that electrons are accelerated continuously inside the whole nebula. Although the model does not discuss the absolute time scales of flares and -ray fluctuations from the first principle, they may be related to timescales of developing MHD instabilities at different spatial scales.
References
- Abdo et al. (2010a) Abdo, A. A., Ackermann, M., Ajello, M., et al. 2010a, ArXiv e-prints:1011.3855. Science Express, 6 January 2011, DOI:10.1126/science.1199705
- Abdo et al. (2010b) Abdo, A. A., Ackermann, M., Ajello, M., et al. 2010b, ApJ, 708, 1254
- Aharonian et al. (2004) Aharonian, F., Akhperjanian, A., Beilicke, M., et al. 2004, ApJ, 614, 897
- Aharonian et al. (2006) Aharonian, F., Akhperjanian, A. G., Bazer-Bachi, A. R., et al. 2006, A&A, 457, 899
- Albert et al. (2008) Albert, J., Aliu, E., Anderhub, H., et al. 2008, ApJ, 674, 1037
- Amenomori et al. (2009) Amenomori, M., Bi, X. J., Chen, D., et al. 2009, ApJ, 692, 61
- Atoyan & Aharonian (1996) Atoyan, A. M. & Aharonian, F. A. 1996, MNRAS, 278, 525
- Bednarek & Idec (2010) Bednarek, W. & Idec, W. 2010, ArXiv e-prints:1011.4176
- Blumenthal & Gould (1970) Blumenthal, G. R. & Gould, R. J. 1970, Reviews of Modern Physics, 42, 237
- de Jager et al. (1996) de Jager, O. C., Harding, A. K., Michelson, P. F., et al. 1996, ApJ, 457, 253
- Hester et al. (2002) Hester, J. J., Mori, K., Burrows, D., et al. 2002, ApJ, 577, L49
- Hester et al. (1995) Hester, J. J., Scowen, P. A., Sankrit, R., et al. 1995, ApJ, 448, 240
- Jourdain & Roques (2009) Jourdain, E. & Roques, J. P. 2009, ApJ, 704, 17
- Komissarov & Lyutikov (2010) Komissarov, S. S. & Lyutikov, M. 2010, ArXiv e-prints:1011.1800
- Kuiper et al. (2001) Kuiper, L., Hermsen, W., Cusumano, G., et al. 2001, A&A, 378, 918
- Lyutikov (2010) Lyutikov, M. 2010, MNRAS, 405, 1809
- Macías-Pérez et al. (2010) Macías-Pérez, J. F., Mayet, F., Aumont, J., & Désert, F. 2010, ApJ, 711, 417
- Meyer et al. (2010) Meyer, M., Horns, D., & Zechlin, H. 2010, A&A, 523, A2
- Much et al. (1995) Much, R., Bennett, K., Buccheri, R., et al. 1995, A&A, 299, 435
- Tavani et al. (2011) Tavani, M., Bulgarelli, A., Vittorini, V., et al. 2011, Science Express, 6 January 2011, DOI:10.1126/science.1200083
- Weisskopf et al. (2000) Weisskopf, M. C., Hester, J. J., Tennant, A. F., et al. 2000, ApJ, 536, L81