An extended XMM-Newton observation of the Seyfert galaxy NGC 4051. I. Evidence for a shocked outflow
Abstract
An extended XMM-Newton observation of the Seyfert 1 galaxy NGC 4051 has revealed a rich absorption line spectrum indicating the presence of a photoionised outflow with a wide range of velocities and ionisation parameter. At low continuum fluxes an emission line spectrum is well defined with both narrow and broad emission components of several abundant metal ions. The absorption line velocity structure and a broad correlation of velocity with ionisation parameter are consistent with an outflow scenario where a highly ionised, high velocity wind, perhaps launched during intermittent super-Eddington accretion, runs into the interstellar medium or previous ejecta, losing much of its kinetic energy in the resultant strong shock. We explore the possibility that a quasi-constant soft X-ray component may be evidence of this post-shock cooling. This revised view of AGN outflows is consistent with multiple minor Eddington accretion episodes creating a momentum-driven feedback linking black hole and host galaxy growth.
keywords:
galaxies: active – galaxies: Seyfert: general – galaxies: individual: NGC 4051 – X-ray: galaxies1 Introduction
NGC 4051 is a bright, narrow line Seyfert 1 galaxy in the Ursa Major cluster, lying at a Tully-Fisher distance of 15.2 Mpc (Russell 2003), with a heliocentric velocity of 753 km s-1 (Verheijen 2001). The rapid and large amplitude variability (Lawrence et al. 1985,1987) was strong early evidence that the powerful X-radiation found to be a common property of Seyfert galaxies by Ariel 5 (Cooke et al. 1976, Elvis et al. 1978) and Uhuru (Tananbaum et al. 1978) observations resulted from accretion onto a central supermassive black hole. Subsequent monitoring with RXTE revealed a different aspect of NGC 4051, where it occasionally lapses into extended periods of low and quasi-constant X-ray emission (Lamer et al. 2003). More recently, high resolution X-ray spectra provided by Chandra and XMM-Newton have shown that NGC 4051 also exhibits a strong ionised outflow.
An early Chandra HETG observation resolved two X-ray absorption line systems, with outflowing velocities of photoionised gas of 600 and 2300 km s-1, while contemporaneous HST spectra of CIV, NV and SiIV found several absorption systems with velocities from 30 km s-1 to 650 km s-1 (Collinge et al.2001). Of particular interest in the context of the present analysis, where we find a clear correlation of velocity and ionisation parameter, the higher velocity X-ray component had no counterpart in the UV spectra. The Chandra data also showed an unresolved Fe K emission line at 6.41 keV (FWHM 2800 km s-1).
Observations of NGC 4051 with XMM-Newton in 2001 and 2002 coincided with periods of relatively high and low X-ray flux, offering an opportunity to further explore the complexity of its X-ray spectrum. Pounds et al. (2004), hereafter Po04, found the hard X-ray band to be dominated by reflection from cold matter, which could also explain a non-varying, narrow Fe K fluorescent line. A soft X-ray narrow emission line spectrum evident at low continuum fluxes, with observed wavelengths consistent with the NGC 4051 rest frame, indicated an extended ionised emission region, while a dominant absorption line spectrum in the high flux RGS observation of 2001 showed an ionised outflow with a line of sight velocity of 500 km s-1. An Fe K absorption line in the EPIC spectrum indicated the presence of a more highly ionised outflow component with a velocity some 10 or 30 times higher, depending on the ionisation state being FeXXVI or FeXXV.
Most recently, Steenbrugge et al. (2009) have reported the analysis of Chandra LETG observations in 2001 and 2003, finding evidence for a more complex ionised outflow, with low ionisation components (log0.1 and log0.5-0.9) outflowing at v200-330 km s-1, a more highly ionised component of log2 at v600 km s-1 and a high ionisation component (log3) at v4600 km s-1. Those authors find no evidence for recombination in 3 of the 4 ionisation components up to 20 ks after a sudden, factor-of-5 drop in X-ray flux, indicating their location at a radial distance cm for the higher velocity gas and cm for the lowest velocity absorption in OV. We note that these minimum radii conflict with those from a similar time variability analysis of Krongold et al. (2007), and have the incidental bonus of removing the conceptual problem in Krongold et al. where the local escape velocity exceeded the measured outflow value.
Evidence for much higher velocity X-ray outflows (Chartas et al. 2002, Pounds et al. 2003, 2006; Reeves et al. 2003, Cappi 2006, Tombesi et al. 2010) has been confined to the very highly ionised matter (log3.5–4) most readily detected in the Fe K band. The high velocities and high column densities in these Fe K band observations are thought to offer the best prospect that such energetic flows represent a significant feedback mechanism to constrain the continued growth of a black hole and star formation in the host galaxy, although to date only in the case of the bright QSO PG1211+143 has the requisite wide angle flow and large covering factor been directly observed (Pounds and Reeves 2009). In the case of NGC 4051 in contrast, Krongold et al. (2007) concluded that the low velocity gas has a small covering factor and hence involves a relatively insignificant mass and energy rate. While Steenbrugge et al. (2009) do not confirm the high density and small radial distance of the ionised outflow, they also derive a low mass and energy rate from the soft X-ray spectrum of NGC 4051.
In this paper we report an analysis of a new XMM-Newton study of NGC 4051 with substantially greater sensitivity than hitherto, finding a rich absorption line spectrum revealing a velocity-structured outflow covering a wide range in velocity and ionisation parameter. We re-examine the suggestion in Po04 that both high and low velocity absorption lines arise at different stages of a mass-conserved outflow. Our new assessment considers the new data in the context of a high velocity, highly ionised wind being slowed by interaction with the interstellar medium, losing much of its mechanical energy in the resulting shock, while retaining momentum to push low ionisation gas out into the host galaxy (King 2010). We note that the same ideas would apply to an outflow colliding with earlier, slower moving ejecta.
The wider importance of such shocked outflows, perhaps launched during an Eddington accretion episode (King and Pounds 2003), lies in the possibility that the accumulated thrust from multiple episodes - rather than the outflow energy - would eventually drive gas from the bulge, thereby limiting further star formation and black hole growth. Such a momentum-driven feedback mechanism has been shown by King (2003,2005) to reproduce the observed correlation of black hole and galaxy masses (e.g. Ferrarese and Merritt 2000, Gebhardt et al. 2000, Haring and Rix 2004)).
2 Observations and data analysis
NGC 4051 was observed by XMM-Newton on 15 orbits between 2009 May 3 and June 15. Here we use mainly the soft X-ray data from the Reflection Grating Spectrometer/RGS (den Herder et al. 2001), while also checking for evidence of a more highly ionised outflow in the EPIC pn (Strüder et al.2001) and MOS (Turner et al. 2001) spectra. Excluding high background data near the end of each orbit the net exposures available for spectral fitting were typically 40 ks per orbit, yielding an overall exposure of 600 ks (pn) and 1.2 Ms (combined MOS and RGS), factors of 6 and 12 higher than in the XMM-Newton observations of 2001 and 2002. In the present paper we use spectra integrated over whole orbits, and note the mean orbit flux levels cover a similar range to the ‘bright’ and ‘faint’ observations of 2001 and 2002. Full details on the timing, flux levels and X-ray light curves for each revolution are included in an accompanying paper on the ‘Rapid X-ray variability of NGC 4051’ by Vaughan et al. (2010).
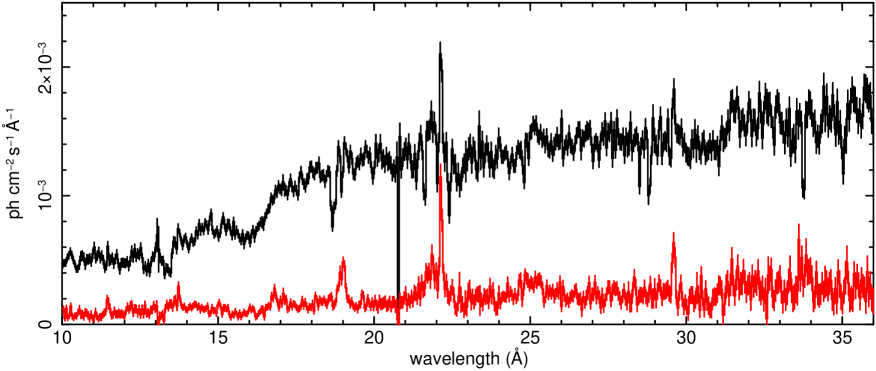
Figure 1 contrasts the RGS spectrum at representative high (revs 1727-1730) and low (revs 1725,36,39) flux levels during the 2009 observation. The distinction found previously (Po04) is again evident, with a dominant absorption line spectrum seen against the stronger continuum when bright, and an emission line spectrum emerging more clearly when the continuum is faint. The most obvious absorption lines are associated with H- and He-like ions of C, N, O and Ne, and multiple velocity components are seen for several resonance transitions. The emission spectrum is also better defined than in any earlier observation of NGC 4051, benefiting from the long exposures of the 2009 observation.
Reference to figure 1 also shows a broad trough in the RGS spectrum between 15.5-16.8 Å, present in both high and low flux data, which we attribute to a UTA from Fe-L absorption in low ionisation matter. Inclusion of this UTA casts doubt on the reality of a relativistic emission line of OVIII Lyman-, previously reported for NGC 4051 by Ogle et al. (2004) and Steenbrugge et al. (2009).
In analysing the 2001 XMM-Newton absorption spectrum of NGC 4051, Po04 first subtracted line emission determined in the low flux spectrum of 2002. However, in the 2009 XMM-Newton data the low flux spectrum still shows residual absorption. We therefore adopted a different approach, by first modelling the emission spectrum in the low flux data and retaining the measured emission parameters in fitting the high flux absorption spectrum.
A representative ‘highflux’ spectrum was obtained by integrating RGS 1 and RGS 2 data from the 4 orbital revolutions 1727-1730, while broad resonance emission lines and radiative recombination continua (RRC) were determined from a representative ‘lowflux’ spectrum (revs 1725, 1736 and 1739). The ‘highflux’ continuum was first modelled by a power law (3.5), with broad emission features added as observed in the low flux spectrum. Individual absorption lines were then fitted with negative Gaussians, with wavelength, line width and amplitude as free parameters.
We discuss the emission line spectrum of NGC 4051 in more detail in a separate paper (Pounds and Vaughan 2011; hereafter Paper II). For the present purposes, in order to quantify the absorption line spectrum in the highflux state, we simply represent the broad line emission component of each principal resonance line with a positive Gaussian, with parameters determined in the corresponding lowflux spectrum.
3 A complex absorption line spectrum
3.1 OVIII Lyman-
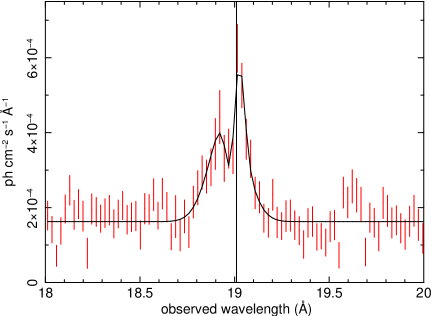
Figure 2 (top panel) illustrates the lowflux spectrum in the region of the OVIII Lyman- line (rest wavelength 18.97Å). A broad emission line is clearly resolved, with substantial absorption near the line core. Fitting a positive Gaussian to the broad emission component finds a rest wavelength of 18.96 0.02 Å, 1 line width of 90 9 mÅ and amplitude of photons cm-2 s-1 Å-1. The median wavelength indicates a velocity blueshift of 750200 km s-1 while, allowing for the RGS 1 resolution (=28 mÅ at 19Å), the line width corresponds to 3100400 km s-1 FWHM, if interpreted purely as velocity broadening.
Figure 2 (lower panel) shows the same spectral region near the OVIII Lyman- line, with a complex of absorption lines superimposed on the continuum plus broad line emission. A sweep across the 18–20 Å waveband with a negative Gaussian of width initially set to the RGS resolution, found 3 strong and 3 weaker absorptions lines, located at wavelengths labelled (a) - (f) in the figure. However, it is apparent that the absorption structure is only approximately matched by Gaussian lines, with the broad opacity between 18.5-18.8 Å suggesting a spread of velocities.
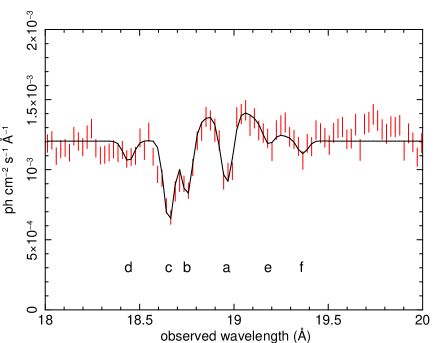
Identifying the absorption components (a) - (d) with OVIII Lyman- yields line-of-sight velocities of -78070 km s-1, -410085 km s-1, -560060 km s-1 and -9000300 km s-1. We note that the probable blend of component (c) with the OVII 1s-3p line (rest wavelength 18.63 Å) renders the parameters of that component uncertain. However, velocity components a, b and c are all independently supported by their detection in OVIII Lyman- (Table 2).
The weaker absorption lines labelled (e) and (f) in figure 2 are most likely due inner shell transitions in OVI (rest wavelengths 19.18 Å and 19.34 Å; Holczer et al. 2009), and we note a further possible satellite line in OV (19.97 Å), all 3 low ionisation lines yielding a low outflow velocity.
In summary, we find evidence for 3, or possibly 4 blue-shifted velocities in OVIII Lyman-, with a clear separation between the component at 780 km s-1 and components at 4100 and 5600 km s-1.
3.2 OVII 1s-2p triplet
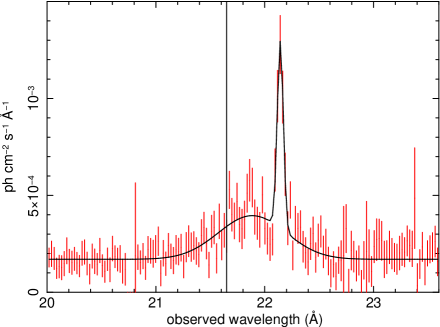
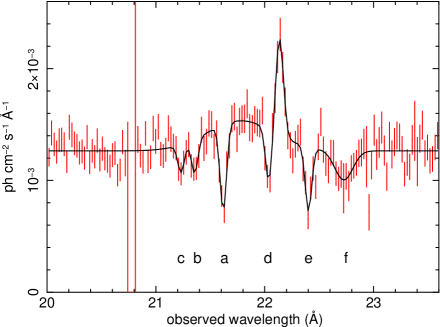
The lowflux spectrum in the region of the OVII 1s-2p triplet also shows a strong and broad emission feature (figure 3, top panel), together with a narrow emission line readily identified with the forbidden transition (rest wavelength 22.101 Å). Fitting a Gaussian to the narrow line yields a wavelength (adjusted for the redshift of NGC 4051) of 22.092 0.003 Å, line width =28 3 mÅ and amplitude photons cm-2 s-1 Å-1. We find the OVII forbidden line to be marginally blue-shifted, with a velocity of -12540 km s-1, and to be unresolved by RGS1, the 1 upper limit corresponding to a velocity width of 250 km s-1 FWHM.
A single Gaussian fit to the broad emission from the OVII 1s-2p triplet finds a rest wavelength of 21.80.1 Å, line width =30535 mÅ and amplitude photons cm-2 s-1 Å-1. The intrinsic width, corresponding to a velocity width of 9500 km s-1 (FWHM), is clearly much larger than that found for OVIII Lyman-. However, a more detailed analysis of the emission spectrum in Paper II finds broad emission components for both the OVII resonance (21.602Å) and intercombination (21.807 Å) lines, with component line widths comparable to that found here for OVIII Lyman-. For the present purposes of quantifying the highflux absorption spectrum we retain the single emission profile, shown added to the best-fit continuum in figure 3 (lower panel).
Six absorption lines are detected in the region of the OVII triplet, all but that near 22.75 Å being of width consistent with the RGS resolution. Those labelled (a), (b), (c) are identified as blue-shifted components of the OVII 1s-2p resonance line, the individual blue shifts yielding line-of-sight outflow velocities of -44060 km s-1, -4080140 km s-1, and -5810120 km s-1, respectively. While these values are consistent with the 3 stronger components seen in OVIII Lyman-, the high velocity absorption is much weaker in OVII. We note the strong low velocity component in OVII is probably a blend of core absorption in the broad emission line (confirmed as self absorption in Paper II) and absorption in the highflux continuum.
Deep absorption lines are also identified with inner shell transitions in OVI (d), OV (e) and OIV (f), confirming the presence of substantial low ionisation gas in the outflow from NGC 4051. The deduced velocities for these low ionisation lines are comparable to the lowest velocity component in OVII. Detailed values are listed in Table 2, apart from line (f), where a probable blend of OIV lines at 22.74 Å and 22.77 Å (Holczer et al. 2009) makes a velocity measurement uncertain.
3.3 NVI 1s-2p and CVI Lyman-
Given the complexity of the emission and absorption in the region of the OVII triplet, it is interesting to examine the RGS data for other He-like ions. That for CV unfortunately lies beyond the range of the RGS, while the spectrum in the vicinity of the NeIX triplet is complicated by the presence of strong Fe-L lines. That makes NVI the best candidate for direct comparison with OVII.
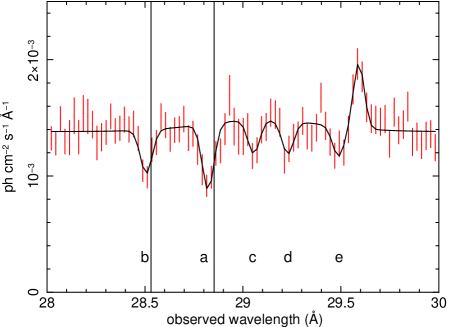
Figure 4 shows the highflux data in the region of the NVI triplet. As for OVII, a broad emission line has been added to the power law continuum as a baseline. The forbidden line (rest wavelength 29.534 Å) is again unresolved and marginally blue-shifted.
The strongest absorption lines, labelled (a) and (b), are readily identified with the low velocity outflow component seen in the 1s-2p resonance line of NVI (rest wavelength 28.787 Å) and CVI Lyman- (rest wavelength 28.466 Å), respectively. The deduced velocities of -32550 km s-1 and -26040 km s-1, the lowest found in the analysis so far, extend the observed link of velocity with ionisation energy.
We note that any higher velocity component of NVI, corresponding to that observed near 4000 km s-1 in OVIII and OVII, would be blended with the absorption in CVI. Possible interpretations of the absorption lines (c), (d), (e) include lower ionisation stages of N, but the identifications and rest wavelengths are not sufficiently secure to derive useful flow velocities.
3.4 Lyman- of CVI, NVII and NeX
Outflow velocities found in OVIII Lyman- at 5600 and 9000 km s-1 are considerably higher than any previously reported from NGC 4051. However, the statistical significance of the highest component in OVIII is marginal, underlining the need to look for evidence of a similar velocity structure in other H-like resonance transitions available within the RGS waveband. Those are of CVI, NVII and NeX. In modelling the highflux absorption spectrum, a shallow emission line of width =90 mÅ is added to the best-fit highflux continuum in each case.
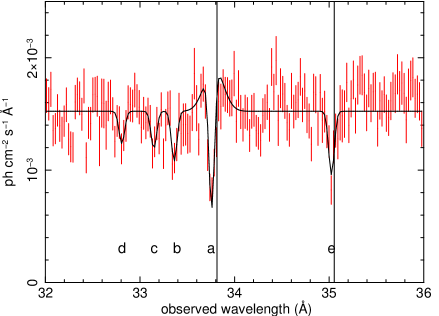
Figure 5 (top panel) shows the RGS spectrum in the waveband 32 - 36 Å, which covers the region of CVI Lyman-, and the 1s-3p transition of CV. The same 4 velocity components detected in OVIII Lyman- may be seen as absorption lines (a), (b), (c) and (d) in CVI Lyman- (rest wavelength 33.74 Å), with values here of -49035 km s-1, -400070 km s-1, -590090 km s-1, and -8920180 km s-1. Identifying the absorption line (e) with a low outflow velocity in CV 1s-3p (rest wavelength 34.97 Å), of -25060 km s-1, further extends the trend where the lowest outflow velocities have the greatest opacity in the lowest ionisation stages.
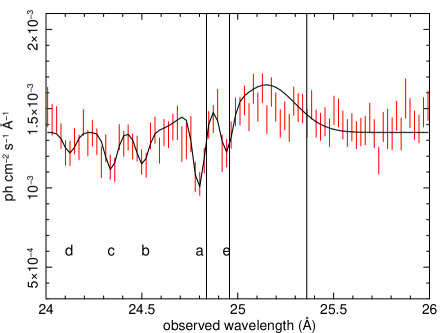
Figure 5 (mid panel) shows absorption lines in the spectral band encompassing the NVII Lyman- line (rest wavelength 24.781 Å), and the 1s-3p resonance line of NVI (24.90 Å). A Gaussian sweep finds 5 absorption lines. Those labelled (a), (b), (c) and (d), yield outflow velocities of -49550 km s-1, -400080 km s-1, -5920135 km s-1, and -8600120 km s-1, consistent with values seen in OVIII and CVI. For NVII Lyman-, the deduced velocities are . Component (e) corresponds to an outflow at -32550 km s-1 if correctly attributed to NVI. The positive Gaussian at 25.3 Å is an approximate match to the strong RRC of CVI.
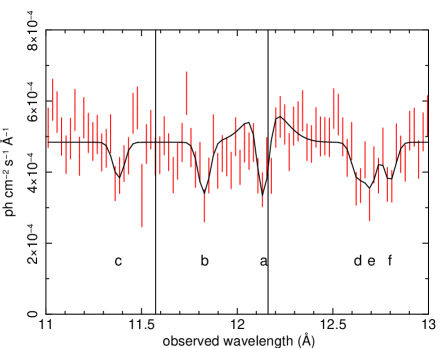
The final Lyman- line accessible in the RGS waveband is that of NeX, having the highest ionisation potential and shortest wavelength (rest wavelength 12.13 Å). Figure 5 (lower panel) shows the highflux absorption spectrum. Although the RGS suffers from decreasing sensitivity in this short wavelength region, several absorption lines are seen. Line (a) lies just shortward of NeX Lyman- (rest wavelength 12.13 Å), and is most probably due to a low velocity component of -620150 km s-1. If also attributed to NeX, line (b) corresponds to a much higher outflow component at -8230130 km s-1, while intermediate velocity components at 4000 and 6000 km s-1 are not detected in NeX. We suggest the most likely identification of line (c) is with NeIX 1s-3p (rest wavelength 11.55 Å), at a velocity of -5000350 km s-1 It is interesting that for NeX only the highest and lowest velocity components of those seen in OVIII, NVII and CVI are detected, a further indication of the trend of increasing outflow velocity with ionisation energy of the parent ion.
Absorption lines (d), (e) and (f) are probably identified with FeXX or FeXIX, but the uncertain individual transitions makes their present value as a velocity indicator not very useful.
In summary, the velocity structure is similar in all 4 Lyman- lines visible in the RGS spectrum, all showing velocity components up to 8000–9000 km s-1, in addition to a well-separated low velocity component. The highest velocity of 8500 km s-1 is notably strongest in the highest energy Ne ion, extending the trend of velocity being correlated with ionisation parameter at least in the high velocity gas. We note, in contrast, that the low velocity absorption is seen in all resonance lines across the RGS spectrum.
In Section 6 we suggest that this difference, also reflected in XSTAR modelling, is due to a separate origin of a component of the low velocity absorption arising from self absorption in a limb-brightened shell, rather than in the direct AGN continuum.
3.5 A velocity- and ionisation-structured outflow
Table 2 brings together all the outflow velocities assigned to a significant absorption component where the parent ion can be reliably identified. Also listed in Table 2 is the ionisation parameter at which each ion stage would have a maximum concentration in a photoionised gas illuminated by the AGN continuum flux (Kallman et al. 1996). Several conclusions can be drawn from the data in Table 2, which are also shown graphically in figure 8.
First, several discrete outflow velocities are indicated, each across a range of different ions, with a clear distinction between a ‘low velocity’ group (250-800 km s-1) and a higher velocity group, with components at 4000, 6000 and 8500 km s-1. Second, there is a strong correlation of velocity with ionisation parameter, absorption in the lower velocity components being strongest in the lower ionisation lines, and the higher velocity components being noticeably stronger for the higher ionisation lines. Moreover, only the lowest velocity flow is evident in the lowest ionisation gas.
To ascertain whether the trend of increasing outflow velocity with ionisation parameter continues to still higher values, we look for evidence of absorption lines in the EPIC data, covering the K-shell energies of the heavier abundant elements Mg, Si, S. Ar and Fe.
4 Absorption lines in the EPIC data
4.1 Intermediate mass ions of Mg to Ar
Examination of the EPIC spectra reveals several absorption lines, detected in both pn and MOS data, lying close to K-band resonance transitions in Mg, Si, S, Ar and Fe.
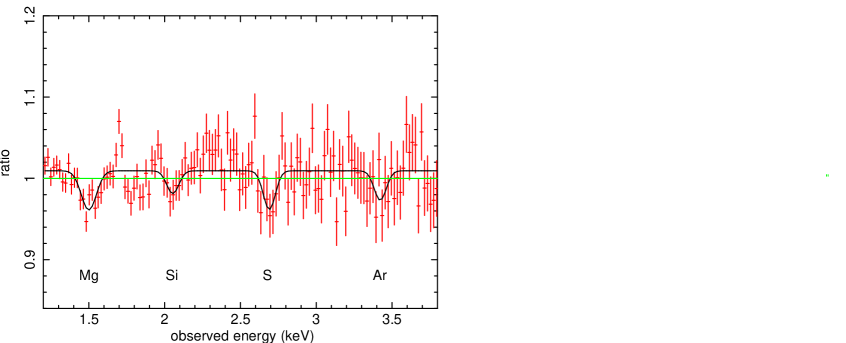
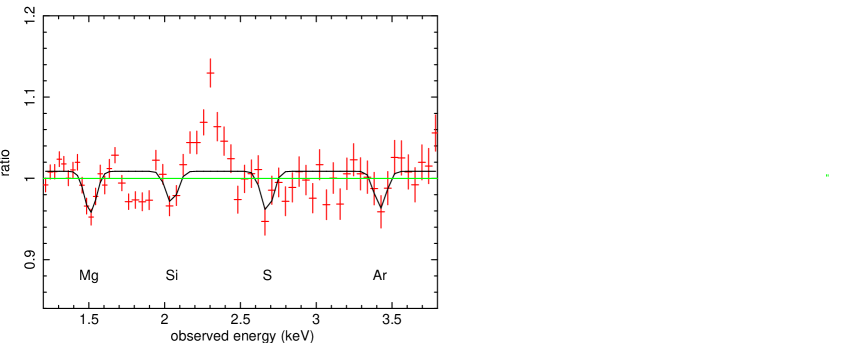
Figure 6 shows a section of the highflux (revs1727-30) pn and MOS spectra in the energy range from 1-4 keV. Although the plotted ratio of data to a simple power law continuum fit are rather noisy (with deviations near 1.8 keV and 2.3 KeV that are probably due to imperfect modelling of the Si K and Au M edges in the instrument response function), a consistent set of absorption lines is seen for the 4 abundant elements with K-shell resonance transitions in this energy range.
Identifying the features, observed in both pn and MOS data near 1.50, 2.05, 2.68 and 3.42 keV, with Lyman- absorption lines of Mg, Si, S and Ar, respectively, and taking a weighted mean of Gaussian fits to the MOS and pn data, yields outflow velocities of -71001500 km s-1, -71002000 km s-1, -77001600 km s-1 and -97001800 km s-1 km s-1. Within the substantially larger uncertainties these values are consistent with the higher velocity components in the RGS data, extending their detection over a still wider range of ionisation parameter.
The EPIC velocities are added to those from the RGS analysis in Table 2.
4.2 The Fe K region
Narrow absorption lines are also seen in the Fe K region of the EPIC spectra. Correct modelling of the continuum is especially important in the neighbourhood of the Fe K lines as spectral curvature below 6.4 keV will have an associated Fe-K absorption edge if attributed to reflection or partial covering. Cold reflection was shown in Po04 to dominate the hard lowflux spectrum of NGC 4051 in 2002, a conclusion consistent with the 2009 observation. It seems a reasonable assumption that a similar underlying component will contribute to the spectral curvature - and the Fe K emission line - in the present highflux data.
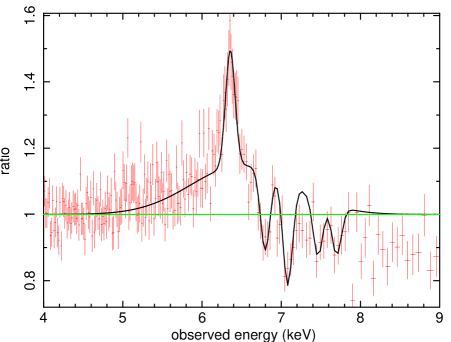
Figure 7 shows a ratio plot of the EPIC pn highflux data to a continuum fitted at 2-10 keV with a power law, plus cold reflection fixed at the value (R1) determined from the lowflux data. Gaussian fitting finds the Fe K emission line can be modelled with narrow and broad components, with 4 possible absorption lines detected to higher energy. Details of Gaussian fits to the Fe K spectral structure are listed in Table 1. Of particular interest here are the absorption lines, where alternative conclusions can be drawn regarding outflow velocities, depending on the line identifications. Though not unambiguous, an appealing interpretation is where 2 velocity groups are found, with the lower value aligning with the higher velocities seen in the RGS data. A still higher velocity, close to the value v0.1c which may be a signature of high velocity winds (Tombesi et al. 2010), is also implied, though this depends on the significance of the 2 weaker absorption features observed at 7.5 and 7.7 keV. We return to the likelihood of such a high velocity wind for NGC 4051 in Section 6.2.
| line | energy (keV) | width (eV) | ident | velocity (km s-1 |
|---|---|---|---|---|
| 1 | 6.380.01 | 60 (f) | Fe-K | - |
| 2 | 6.40.1 | 38063 | Fe-K | - |
| 3 | 6.810.02 | 60 (f) | FeXXV | -4900750 |
| 4 | 7.100.01 | 60 (f) | FeXXVI | -5800450 |
| 5 | 7.490.03 | 60 (f) | FeXXV | -315002000 |
| 6 | 7.720.03 | 60 (f) | FeXXVI | -295002000 |
Summarising the EPIC absorption line data, we again emphasise that the deduced outflow velocities depend on the correct identification of less well resolved absorption features (than for the RGS spectra). Identifying the absorption features in Mg, Si, S and Ar with the relevant Lyman- line is the most conservative, in the sense of yielding the lowest velocities, showing the intermediate velocity outflow seen in the RGS spectra extends to a still higher ionisation parameter, log3. Interpreting the Fe K absorption is more ambiguous and we retain both the intermediate and high velocity values in Table 2.
| Line i.d | rest wavelength(energy) | v1 | v2 | v3 | v4 | v5 | log |
|---|---|---|---|---|---|---|---|
| CV 1s-3p | 34.97 | 25060 | - | - | - | - | 0 |
| CVI Ly | 33.74 | 49035 | 400070 | 590090 | 8920180 | - | 0.8 |
| NVI 1s-2p | 28.79 | 32540 | - | - | - | - | 0.45 |
| CVI Ly | 28.47 | 26040 | - | - | - | - | 0.8 |
| NVI 1s-3p | 24.90 | 32550 | - | - | - | - | 0.45 |
| NVII Ly | 24.78 | 49550 | 400080 | 5920135 | 8600120 | - | 1.1 |
| OV 1s-2p | 22.37 | 31060 | - | - | - | - | -0.25 |
| OVI 1s-2p | 22.01 | 44075 | - | - | - | - | 0.2 |
| OVII 1s-2p | 21.60 | 44060 | 4080140 | 5810120 | - | - | 0.9 |
| OVI 1s-2p | 19.34 | 850200 | - | - | - | - | 0.2 |
| OVI 1s-2p | 19.18 | 660200 | - | - | - | - | 0.2 |
| OVIII Ly | 18.97 | 78070 | 410085 | 560060 | 9000300 | - | 1.55 |
| OVIII Ly | 16.01 | 500130 | 3700130 | 6300160 | - | - | 1.55 |
| NeIX 1s-3p | 11.55 | - | - | 5000350 | - | - | 1.4 |
| NeX Ly | 12.13 | 620150 | - | - | 8230130 | - | 2.0 |
| MgXII Ly | (1.47) | - | - | - | 71001500 | - | 2.25 |
| SiXIV Ly | (2.00) | - | - | - | 71002000 | - | 2.65 |
| SXVI Ly | (2.62) | - | - | - | 77001600 | - | 2.9 |
| ArXVIII Ly | (3.32) | - | - | - | 97001800 | - | 3.2 |
| FeXXV 1s-2p | (6.70) | - | - | 4900750 | - | 315002000 | 3.3 |
| FeXXVI Ly | (6.96) | - | - | 5800450 | - | 295002000 | 3.9 |
5 Modelling with XSTAR
To further quantify the photoionised absorption in the complex outflow in NGC 4051 we have modelled the highflux RGS spectrum with XSTAR. We again fitted the continuum with a power law, adding a negative Gaussian line to represent the broad UTA evident in figure 1 near 16 Å. As in the Gaussian fitting, broad emission features (line plus RRC) were added to the continuum.
A sequence of photoionised absorbers represented by grid 18 from the XSTAR library (Kallman et al. 1996) was then added to model the absorption line spectrum. Grid 18 includes a turbulent velocity of 100 km s-1, with an ionising power law spectrum similar to that observed for NGC 4051 irradiating a gas taken initially to be of solar abundance. The ionisation parameter, column density and velocity (output as a modified redshift) are the primary free parameters of each absorber.
We began by modelling the RGS 1 data over the waveband 17-24 Å, dominated by absorption lines of OIV, V, VI, VII and VIII and allowing a fit largely independent of relative abundances. A visually acceptable fit was obtained with 2 photoionised components expressing the low and intermediate velocities. The fit was then extended to 36 Å, to include the resonance lines of NVII,NVI and CVI, and with both RGS1 and RGS2 data, and finally over the full waveband 10-36 Å, covering the higher energy K-shell resonance transitions of Ne, and a potential complex of Fe-L lines. For the full band fits the abundances were allowed to vary, although tied for the same element across the separate ionised components.
Five photoionised absorbers were required to obtain a satisfactory spectral fit over the whole waveband, with a statistical improvement from /d.o.f. = 6788/4204 to /d.o.f. = 5543/4180. The abundances of the most important elements (relative to oxygen=1) were C: 0.530.16, N:2.40.5, Ne: 2.62.0 and Fe:1.300.26.
The parameters of this multi-absorber fit are listed in Table 3 in the order in which they were added. Components 1 and 2 evidently represent the high velocity continuum absorption observed most strongly in OVIII and higher level ions.
Component 3 represents the low velocity and lower ion stage continuum absorption, as well as the low velocity self-absorption in the broad line emission (figure 10). Component 4 reflects the existence of low velocity absorption across a wide range of ionisation parameter. We interpret that in a more detailed study of the broad line emission (Paper II) where the emission and strong self-absorption arise from a limb-brightened shell, the velocities being limited by the high-inclination to the line of sight (figure 10).
Component 5 is intriguing in indicating a small redshift. We suggest that the red-shifted absorption, which importantly can also be seen in the data, arises from the decellerating outflow on the far side of the AGN, the low ionisation parameter being consistent with an origin in the higher density gas accumulating ahead of the contact discontinuity (see Discussion).
Components 1-4 are added in figure 8 to a plot of outflow velocities obtained from the Gaussian line fitting, where each ion is located at the ionisation parameter where it would have maximum abundance. We have not included the uncertainties on each XSTAR component as the fit should be considered as representative of a continuous velocity and ionisation distribution. Nevertheless, as discussed in Section 6, we believe the near linear progression from components 1 to 3 is an important demonstration of a mass conserved outflow.
A 5th asterisk in figure 8 represents the putative pre-shock high velocity flow, with velocity v0.1c and ionisation parameter, adjusted to the current sub-Eddington luminosity, of log3.7.
| Comp | log | NH | velocity (km s-1 | |
|---|---|---|---|---|
| 1 | 2.970.06 | 1.40.2 | -588060 | 484 |
| 2 | 2.520.07 | 1.850.4 | -385060 | 178 |
| 3 | 1.430.22 | 1.10.5 | -53090 | 394 |
| 4 | 2.770.15 | 2.91.4 | -40050 | 64 |
| 5 | 0.320.24 | 1.00.2 | +12060 | 123 |
6 Discussion
A striking feature of the absorption spectrum in NGC 4051 is the very wide range of velocities and ion stages observed. A second feature is the correlation of velocity and ionisation parameter in the continuum absorption.
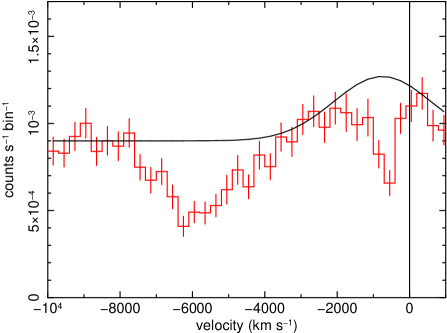
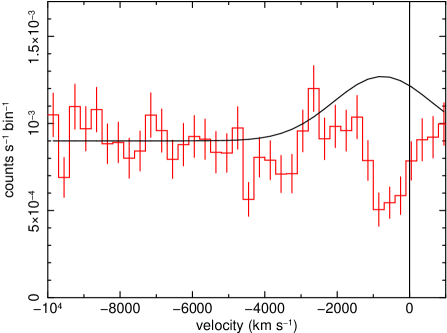
Figure 9 visualises that correlation, with contrasting velocity profiles of the opacity in OVIII and OVII, for the high flux revs 1722 and 1724. The upper plot, centred at the rest wavelength of OVIII Lyman-, shows the onset of absorption at 7500 km s-1, with the opacity increasing to 6000–5000 km s-1, whereafter it decreases again to disappear at 3500 km s-1, re-emerging strongly below 1500 km s-1. The corresponding velocity profile in the OVII 1s-2p resonance line shows only weak high velocity opacity at 4500–3000 km s-1. In contrast the low velocity absorption is notably stronger in the lower energy ion
Figure 8 brings together the velocity data from Gaussian fitting to the RGS and EPIC absorption spectra, plotting each well-defined velocity against the optimum ionisation parameter for the parent ion. The strongest absorption components at each velocity generally lie to the right hand - higher ionisation - side of the plot, consistent with a broad correlation of velocity and ionisation parameter, while the highest velocities are only detected in the higher energy parent ions, and the low velocity group are seen most strongly - or only - in low ionisation matter.
The correlation of velocity and ionisation parameter is further illustrated by the results from XSTAR modelling of the highflux absorption spectrum, represented by asterisks in figure 8, with components 1, 2 and 3 following a clear linear trend in velocity and ionisation parameter . Figure 8 also indicates that part of the low velocity absorption does not follow the general trend with ionisation, with XSTAR component 4 supporting the evidence from Gaussian fitting that low velocity absorption exists at all ionisation stages covered by the RGS data. Figure 10 shows schematically how separate absorption spectra are associated with the direct continuum and with self absorption in the post shcck gas. More detailed consideration of a low velocity absorption structure, visible across all ion stages in the RGS data (and represented by components 3, 4 and 5 in the XSTAR modelling), is deferred to Paper II where it is interpreted as self-absorption in a limb-brightened shell.
Meanwhile, an overview of figure 8 suggests 3 broad velocity regimes in the outflow in line-of-sight to NGC 4051, including the higher velocity component in the Fe K absorption. On this overview, the individual velocity components picked out by Gaussian fitting at 4000 km s-1, 6000 km s-1 and 8500 km s-1, but appearing more like a broad trough in the strongest absorption, in OVIII Lyman- (figure 9), may represent density variations within a continuous flow. Further evidence for such density variations, which might represent a residual shell-structure linked to the intermittent nature of the initial fast wind, can be seen in velocity profiles taken at different flux levels for different ions.
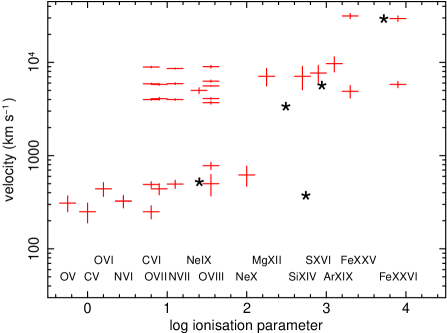
In the remainder of this paper we refer to the low (1000 km s-1), intermediate (3000-9000 km s-1) and high velocity (30000 km s-1) regions indicated in figure 8 and explore the possibility that they represent different stages in a shocked outflow. The implications of such an interpretation are doubly significant. The concept of a slowing and cooling/recombining ionised outflow is in contrast to most current ideas for the radial acceleration of AGN winds, while efficient post-shock cooling would mean that the mechanical energy in a fast outflow may not be the primary mechanism for AGN feedback.
6.1 Outflows and feedback in AGN
Comparison with previous observations of NGC 4051 by XMM-Newton and Chandra suggest that the low velocity absorption is persistent, while that at higher velocities is probably variable, at least on a timescale of years. The caveat on variability is that most of the earlier observations were of lower sensitivity, while the relatively long 2001 XMM-Newton observation does - on a re-examination - show evidence of blue shifted absorption corresponding to an outflow in the range 4000-6000 km s-1. The new XMM-Newton spectra are most closely approached by the Chandra LETG spectra reported by Steenbrugge (2009), who find outflow velocities of 200, 600 and 4600 km s-1, modelled by 4 ionised absorbers with ionisation parameters ranging from log0–3.
In discussing the 2001 RGS spectrum of NGC 4051 Po04 noted that, with the simple assumption of conservation of mass in a radial outflow, an extended region of slow moving, low ionisation gas might be a continuation of the high velocity, high ionisation flow seen in absorption in the Fe K band. On this picture much of the mechanical energy in the initial outflow would have been lost before reaching the lower ionisation stage, and Po04 speculated that this might be due to internal shocks occurring in the high velocity gas.
We now take up that idea again but in the context of a shock interaction with slower moving matter, either the local ISM or previous ejecta. To justify that approach we note that the broad correlation of velocity and ionisation state in the absorption spectra for NGC 4051 is a clear signature of a cooling, decellerating and recombining outflow.
The mass rate in a radial outflow of velocity v, and particle density n at radius r is , where b is the fractional collimation angle and is the proton mass. Mass conservation in the flow requires the product n.r2.v to be constant. As n.r2 = Lion/, if the ionising radiation is unchanged (or changes very little), for example over a distance small compared with r, then conservation of mass in a radial outflow yields a linear correlation of velocity and ionisation parameter. We would expect that to be the case in a post-shock cooling shell. The important implication of a decellerating radial outflow is that the mechanical energy in the flow would be substantially reduced as the flow is slowed.
King (2010) has recently examined a relevant scenario, where a highly ionised, high velocity wind drives into the interstellar medium, losing much of its energy by efficient cooling of the shocked gas. Such a scenario would have major implications for studies of AGN feedback based on X-ray absorption spectra. Until now, X-ray observations have been used in attempts to show that fast, ionised outflows can provide the link between the growth of a SMBH and its host galaxy, by the integrated mechanical energy in the fast flow (eg Pounds and Reeves 2009). However, as recently pointed out (eg King 2010), if such an energetic wind persists while the black hole doubles its mass (the Salpeter time), the coupling of wind energy to galactic baryons may have to be inefficient to allow massive bulges to grow to the values observed, effective feedback instead being enabled by the total momentum of the flow, an alternative that has been shown to yield the observed M - relationship for nearby active galaxies (King 2003, 2005).
In the following section the new XMM-Newton observations of NGC 4051 are examined in the context of a shocked wind, where the intermediate velocity/intermediate ionisation outflow corresponds to the immediate post-shock gas and the low velocity/low ionisation absorption to matter building up ahead of the contact discontinuity.
6.2 Comparing the NGC 4051 data with a shocked wind model
In the King (2010) shocked wind model a high velocity ionised outflow collides with the ISM of the host galaxy, resulting in a strong shock. The gas density increases by a factor at the shock front, and the velocity drops by the same factor. Beyond this (reverse, adiabatic) shock, the flow is further compressed in a relatively thin, cooling region, while the velocity slows to low values. Strong Compton cooling by the AGN radiation implies a fairly rapid transition between the immediate post-shock regime and the much slower and compressed state near the contact discontinuity. Beyond the contact discontinuity a further low velocity, low ionisation component will build up as the interstellar medium is swept up by an outer (forward) shock.
Comparison of that scenario with the new NGC 4051 data assumes an intermittent highly ionised wind, with typical values of v0.1c and log4 (Tombesi et al. 2010), has collided with the ISM or previous slower moving ejecta, with the density increase rendering the immediate post-shock gas, v0.025c (7500 km s-1), visible as resonance absorption at log3.
The shocked wind cools and slows after passing through the inner shock, yielding the broad absorption trough seen in the velocity plot for OVIII Lyman- line (figure 9). We speculate that the observed gap between the intermediate and low velocity absorbing material arises from the falling column density of OVIII, re-emerging at low velocities as the column density builds up ahead of the contact discontinuity.
It is interesting to consider how the observations of NGC 4051 may be used to estimate the parameters of an earlier, perhaps intermittent, Eddington episode whose effects we may now be observing. While direct evidence for a high velocity wind is marginal in the 2009 data, as it was in the 2001 XMM-Newton observation, Tombesi et al. report the detection of an outflow at 0.13c in the 2002 observation. Taken together, those reports indicate the present fast outflow in NGC 4051 is intermittent, and we note that with the unusually high column density required to detect a blue-shifted Fe K absorption line in a low redshift source such as NGC 4051, radial expansion would rapidly render a transient outflow undetectable with EPIC.
In what follows, we explore the effects of such an intermittent fast outflow as it interacts with the ISM or slower moving ejecta, as an explanation of the velocity- and ionisation-structured outflow phases observed in the present observation of NGC 4051.
6.3 The intermediate ionisation/intermediate velocity gas
We identify the immediate post-shock outflow in NGC 4051 with the onset of substantial opacity at a velocity v cm s-1 (figure 9, top panel). XSTAR modelling (Table 3) finds an ionisation parameter log3 and column density of NH cm-2 to represent this flow phase. Both velocity and ionisation parameter are consistent with the factor 4 change from the putative 0.1c wind expected across a strong shock.
The incident ionising luminosity of erg s-1, for an average-flux EPIC spectrum (rev 1729), together with the fitted ionisation parameter and measured velocity, give nr2v s-1 for the post-shock flow. Assuming an angular collimation b=0.3, the post-shock flow mass rate is then gm s-1 (0.06 yr-1). Interestingly, that rate is close to the Eddington accretion rate for NGC 4051 assuming an accretion efficiency of 0.1.
The corresponding momentum rate of the intermediate velocity gas is then (cgs), with mechanical energy (0.5) of erg s-1. That mechanical energy rate is 0.3 of the Eddington luminosity for a black hole mass of (Denney et al. 2009), a factor 30 less than the value v/c.LEdd predicted by a simple continuum driving model (King and Pounds 2003), roughly consistent with the expected velocity-linked loss at the strong shock.
As the post-shock gas cools we can identify second and third XSTAR components on the velocity/ionisation plot (figure 8), with v3850 km s-1 and log2.55, and v550 km s-1 and log1.56, following reasonably closely the expectation of a linear correlation of velocity and ionisation parameter in a post-shock flow.
The detection of several strong RRC and broad resonance line emission is indicative of a strongly recombining stage in the flow, and the observed OVII RRC flux of photons cm-2s-1 provides a measure of the intermediate velocity flow. A temperature of 5 eV, from the width of the RRC, implies a recombination rate for OVIII of cm3 s-1 (Verner and Ferland 1996). With that value and assuming 30 percent of recombinations from the majority OVIII ion direct to the ground state, we deduce an emission measure from the OVII RRC flux of order cm-3, for a Tully-Fisher distance of 15.2 Mpc. We note, in passing, that this could be a minimum measure as any much higher temperature RRC component would be difficult to resolve.
Importantly, the particle density in the intermediate flow region is constrained by evidence of a narrowing of the broad emission component in OVIII in rev 1739, indicating a change in the ionisation state following a 3-4 day interval of unusually low continuum flux level. This is discussed in more detail in PaperII. In the following estimates of the flow properties we assume a recombination timescale for OVIII of 4 days, corresponding to a particle density ncm-3 for the intermediate velocity flow.
The OVII RRC emission measure then corresponds to an emitting volume of cm3 and - taking the column density of component 2 in the XSTAR modelling as a measure of the intermediate velocity absorber - gives a radial thickness of order r cm.
At a mid-phase velocity of 4000 km s-1, the shocked gas would traverse this cooling region in a time t s. That would suggest the intermediate velocity absorption could exist in the absence of a fast outflow for a similar timescale, while the considerably shorter recombination timescale could explain structure in the intermediate velocity flow, in turn perhaps reflecting the intermittent nature of the fast wind.
From the above estimates of particle density, shell thickness and emission volume (acknowledging that these are only a crude measure across a likely strong radial gradient), we find a shell radius r cm, for b=0.3.
We now compare the above parameters of the intermediate velocity/ionisation post-shock gas with values for the low ionisation/low velocity gas accumulating ahead of the contact discontinuity, to provide an order-of-magnitude estimate of the duration and history of the putative Eddington accretion episode in NGC 4051.

6.4 Constraining the low ionisation/low velocity gas
We take component 3 from the XSTAR photoionisation modelling to represent the low ionisation/low velocity gas accumulating ahead of the contact discontinuity (CD) and seen in continuum absorption in the highflux spectrum. That component has an ionisation parameter of log1.43, absorbing column density of cm-2, and outflow velocity of 530 km s-1. With a mean ionising luminosity (l keV) of erg s-1, we obtain n.r2 for the low velocity/low ionisation flow gas. With the particle density scaling from the velocity difference - and reflected in the lower ionisation parameter, we assume ncm-3, giving a radial depth of the pre-CD shell r cm-2.
The higher assumed density of the pre-CD shell would appear to conflict with the persistence of the low velocity absorption, particular in a higher level line such as OVIII Lyman-. However, as we report in Paper II, self-absorption of the broad emission line can fully account for the low velocity opacity when the continuum is weak.
As the radius of this low ionisation shell must exceed the estimated thickness of the intermediate flow region, we note that light travel time delays would further limit variability in the low velocity opacity, consistent with the lower limit of r cm obtained by Steenbrugge et al. (2009) from a lack of variability in the low velocity component in the Chandra absorption spectrum. We assume r cm below.
With that geometry the mass of accumulated low ionisation gas, seen in absorption, is gm (0.3). Comparison with the mass rate in the post shock flow indicates an accumulation time of 6 years. For a velocity of 530 km s-1, the mechanical energy in this component of the low velocity gas is then ergs, indicating that 99.5% of the mechanical energy has been lost in the post-shock cooling.
While the total flow momentum will be conserved through the shock, we expect a major fraction of the initial ram pressure is converted to gas pressure at the contact discontinuity. Integrating the immediate post-shock outflow momentum over 6 years totals (cgs). In comparison the accumulated ram pressure in the post-shock, low ionisation gas is (cgs), indicating 63% of the immediate post-shock momentum has been translated into pressure ahead of the contact discontinuity.
6.5 Evidence for radiation from the shocked gas
If the shocked outflow scenario does apply to NGC 4051 the question arises as to whether there is direct evidence for radiation from the post-shock cooling?
The high temperatures in the shock require strong cooling which is likely to be dominated by Compton scattering of the AGN’s radiation field. King (2010) finds that this typically will have a Compton temperature K, compared with the much higher adiabatic shock temperature of K.
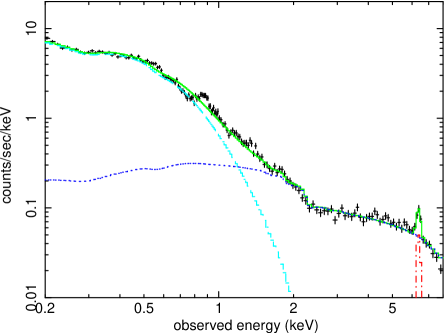
In assessing whether there is any direct evidence of such cooling radiation, we recall that Uttley et al. (2003) identified a quasi-constant soft X-ray component, modelled as a 3 power law, in a Chandra TOO observation made during a 6-week low flux state of NGC 4051. The overall X-ray spectrum in the present low flux rev1739 data is very similar to the Chandra observation, and also to that during the XMM-Newton observation in 2002 which followed a 20-day low flux period. Furthermore, regular monitoring with Swift during the present XMM-Newton campaign indicated that rev1739 also followed a low flux state lasting for several days. We therefore take the rev1739 spectrum of NGC 4051 to be typical of a possible base level spectrum.
Figure 11 shows the pn data from rev1739 fitted with two continuum components. Above the sharp spectral break at 1-2 keV the spectrum is parameterised by a hard power law (0.8), while the steep soft X-ray component can be modelled by either a much softer power law (3.5), or a Comptonised spectrum (as shown in the figure) with kT0.3 keV and optical depth 0.3. A strong Gaussian emission line (equivalent width 25030 eV) at 6.380.01 keV is consistent with Fe K fluorescence from the hard spectral component being reflection dominated, as reported in Po04.
The short-term flux variability seen throughout the rest of the 2009 XMM-Newton observation of NGC 4051 is notably absent in rev 1739 (Vaughan et al. 2010), supporting the view that the soft X-ray component in figure 11 does indeed comprise a quasi-constant low flux emission, with the lack of variability indicating its origin in an extended region. The post-shock cooling shell could fit that description and it is notable that the present RGS spectra show that absorption is limited to self-absorption in the broad emission lines at the lowest continuum fluxes. The luminosity in the Compton component of figure 11 (0.2 keV) is erg s-1, comparable to the mechanical energy lost in traversing the post-shock region.
We have suggested that the broad emission lines and recombination continua (RRC) observed in the RGS spectrum arise from additional 2-body cooling of the post-shock outflow. Fitting in XSPEC finds fluxes of photons cm-1 s-1 and photons cm-1 s-1, respectively, for the broad emission lines of OVII and OVIII Lyman-. Addition of the corresponding broad emission lines of Ne, N and C yields a total soft X-ray flux of photons cm-1 s-1, and a luminosity erg s-1. Strong RRC of O, N and C and emission from Fe-L lines increase the total observed recombination cooling to erg s-1, making a significant addition to the cooling in the later stages of the post-shock flow.
We conclude that identifying a quasi-constant soft continuum and soft X-ray emission features in NGC 4051 with the cooling of the shock outflow is reasonable on energetic grounds.
6.6 Relating NGC 4051 to other AGN with powerful ionised winds
Evidence has been growing for ultra-fast winds of highly ionised matter in a number of AGN, carrying mechanical energy up to 10 of Lbol ( Pounds and Reeves 2009). The direct determination of a large-angle flow in the QSO PG1211+143 was important in confirming that the v0.13c wind was energetically significant in terms of AGN feedback. Indirect support for such fast outflows to be typically of wide angle has recently been obtained in a survey of bright AGN by Tombesi et al. (2010), who find some 30% of their sample show evidence for an ionised wind of v0.1c. As noted above, the potential importance of such powerful winds lies in providing a feedback mechanism linking the growth (and termination of growth) of supermassive black holes in AGN with that of their host galaxy. This remains true if the impact is actually delivered by a momentum-driven thrust, as would be the case if the initial ionised wind lost much of its mechanical energy in shocks before reaching the star-forming region. The analysis outlined above suggests that may be the case for the bright, nearby Seyfert galaxy NGC 4051.
The question of how a highly ionised gas is accelerated to such high velocities is clearly important. Continuum driving for AGN accreting at a super-Eddington rate was proposed by King and Pounds (2003), and appears readily applicable to PG1211+143. However, in the case of many of the Tombesi et al. sample, including NGC 4051, current mass estimates suggest they are accreting more typically at only 10-20 % of LEdd.
If the Tombesi et al. findings are confirmed, with highly ionised outflows at v0.1c being relatively common in bright nearby galaxies, then perhaps Eddington or mildly super-Eddington accretion is also more common than generally believed. A case for AGN black hole masses being over-estimated has recently been argued by King (2010a). Furthermore, if the ejection of fast outflows is intermittent, as suggested here for NGC 4051, then only where such a wind is current or was launched very recently will it retain a line-of-sight column close to the theoretical value for continuum driving of NH cm-2.
6.7 Is the forbidden line emission dominated by swept up ISM?
Strong and narrow emission lines in the RGS data, of similar strength in both low and high flux spectra, arise from the ‘forbidden’ transitions in the 1s-2p triplets of He-like NVI, OVII and NeIX. In each case we find the line is at best only marginally resolved, with the strongest OVII line indicating a FWHM250 km s-1. When adjusted for the known redshift of NGC 4051 the OVII forbidden line also has a very low outflow velocity of -12540 km s-1. We note that the velocity width is consistent with the [OIII] line width in the NLR, of 210-330 km s-1 FWHM (De Robertis and Osterbrock 1984).
In P04 constraints on the low ionisation/low velocity gas were obtained from the OVII emission line flux by noting that the 2002 November XMM-Newton observation took place some 20 days after the source entered an extended low flux state, while the emission line strength of the OVII forbidden line was essentially the same as when NGC 4051 was much brighter in 2001 May. This was taken to indicate a recombination time s, and a plasma density ncm-3. We now note the forbidden line fluxes in the 2009 RGS data are consistent with those measured 7 years earlier. If that is a real measure of lack of variability it would indicate a still lower density ncm-3, or a physical extent of the forbidden line emission region larger than the present estimate for a post shock region of radius 0.3 pc.
The question then arises, does a substantial fraction of the forbidden line emission come from the slower moving swept-up ISM ahead of the outer shock? This possibility is raised by noting that the resonance absorption line of OVII, identified in the context of a shocked wind with matter ahead at the contact discontinuity, has a lowest velocity component of 44060 km s-1, well separated from that of the observed OVII forbidden line. Absorption in OV and - less unambiguously - in OIV also have lower velocities and lie well to the low ionisation side of the linear correlation with velocity that fits the main outflow stages in figure 8.
Estimating the baryon mass of the swept-up ISM from the present data depends both on the assumed density and also - quite strongly - on the relevant ionisation parameter. While the optimum ionisation parameter for OVII is log0.9, the very low velocity would associate it more with absorption from OIV-VI and log0, where OVII would represent only 3 % of total oxygen.
With the measured OVII forbidden line flux of photons cm-1 s-1, a distance to NGC 4051 of 15.2 Mpc, 3% of oxygen in the form of OVII, and a recombination rate at kT 3 eV of cm3 s-1 (Verner and Ferland 1996) we find an emission measure of cm-3.
For a particle density ncm-3 that emission measure would correspond to a total swept-up mass of 7500 . Assuming an ISM density close to the virial equilibrium value (i.e. the isothermal sphere value for = 88 km in NGC 4051), the swept up mass within r cm, for a gas fraction of 0.15, would be gm ( . The implication is that previous Eddington episodes in NGC 4051 have substantially reduced the gas density in the inner core of the galaxy.
7 Summary
Extended new XMM-Newton observations of the Seyfert 1 galaxy NGC 4051 have shown a rich X-ray absorption line spectrum from 16 K-shell ions from C to Fe. The increased sensitivity and energy span of these observations reveal a velocity-structured outflow ranging over at least two orders of magnitude in velocity and ionisation parameter. We find a strong correlation of velocity and ionisation parameter, with both parameters being structured in at least 3 regimes.
We assess the observations in terms of a mass-conserved outflow, where a highly ionised, high velocity wind is slowed on impact with the local interstellar medium or slower moving ejecta, resulting in a strong shock. While most of the initial mechanical energy is lost in the shock, the total outflow momentum is maintained.
On this picture, we associate the intermediate velocity components, observed at 3000-7500 km s-1 and with the highest opacity at intermediate ionisation parameters, with the rapidly cooling shell (or shells) of post-shock gas, while a well-separated continuum component at 400-700 km s-1, in a lower ionisation state, is attributed to the gas accumulating ahead of the contact discontinuity. We speculate that a still lower velocity component may be in the ISM swept up by the forward shock.
Compton cooling of the shocked gas by the AGN radiation field is predicted to produce a soft continuum emission containing much of lost outflow kinetic energy and we propose that part of this might be observed as a residual, quasi-constant soft X-ray component (3.5) in the lowest flux spectra of NGC 4051.
The broad line emission and strong RRC observed from several of the most abundant ions in the RGS spectrum provide additional cooling as the post-shock flow recombines. Self-absorption arising in the higher line-of-sight column density around the circumference of a thin shell of post-shock gas could explain the persistence of low velocity absorption, across a wide range of ions, even when the continuum is faint.
If a non-varying OVII forbidden line is a measure of the swept-up ISM ahead of the forward shock, the estimated mass of 7500 represents only 4% of that for a virial gas density, suggesting that previous Eddington episodes in NGC 4051 have substantially reduced the gas density in the central regions of the galaxy.
Acknowledgements
The results reported here are based on observations obtained with XMM-Newton, an ESA science mission with instruments and contributions directly funded by ESA Member States and the USA (NASA). The authors wish to thank Andrew King for many stimulating discussions, the anonymous referee for helpful suggestions in improving the structure of the paper, and the SOC and SSC teams for organising the XMM-Newton observations and initial data reduction.
References
- [1] Arnaud K.A. 1996, ASP Conf. Series, 101, 17
- [2] Cappi M. 2006, Astron. Nachr., 327, 1012
- [3] Chartas G., Brandt W.N., Gallagher S.C., Garmire G.P. 2002, ApJ, 569, 179
- [4] Collinge M.J. et al. 2001, ApJ, 557, 2
- [5] Cooke B.A., Elvis M., Ward M.J., Fosbury R.A., Penston M.V., Maccacaro T. 1978, MNRAS, 177, 121
- [6] den Herder J.W. et al. 2001, A&A, 365, L7
- [7] Denney K.D et al. 2009, ApJ, 702, 1353
- [8] De Robertis M.M., Osterbrock D.E. 1984, ApJ, 286, 171
- [9] Elvis M., Maccacaro T., Wilson A.S., Ward M.J., Penston M.V., Fosbury R.A., Perola G.C. 1978, MNRAS,
- [10] Elvis M., Lockman F.J., Wilkes B.J. 1989, AJ, 97, 777
- [11] Ferrarese L., Merritt D. 2000, ApJ, 539, L9
- [12] Gebhardt K., et al. 2000, ApJ, 539, L13
- [13] Haring N., Rix H-W. 2004, ApJ, 604, L89
- [14] Holczer T, et al. (2009), arXiv:0910.2402v1
- [15] Kallman T., Liedahl D., Osterheld A., Goldstein W., Kahn S. 1996, ApJ, 465, 994
- [16] King A.R. 2003, ApJ, 596, L27
- [17] King A.R. 2005, ApJ, 635, L121
- [18] King A.R., Pounds K.A. 2003, MNRAS, 345, 657
- [19] King A.R., 2010, MNRAS, 402, 1516
- [20] King A.R,, 2010a, MNRAS, 408, 95
- [21] Krongold Y., Nicastro F., Elvis M., Brickhouse N., Binette L., Mathur S., Jimenez-Bailon E. 2007, ApJ, 659, 1022
- [22] Lamer G., McHardy I.M., Uttley P., Jahoda K. 2003, MNRAS, 338, 323
- [23] Lawrence A., Pounds K.A., Watson M.G., Elvis M. 1985, MNRAS, 217, 685
- [24] Lawrence A., Watson M.G., Pounds K.A., Elvis M. 1987, Nature, 325, 694
- [25] Ogle P.M., Mason K.O., Page M.J., Salvi N.J., Cordova F.A., McHardy I.M., Priedhorsky W.C. 2004, ApJ, 606, 151
- [26] Pounds K.A, Reeves J.N., King A.R, Page K.L, O’Brien P.T., Turner M.J.L. 2003, MNRAS, 345, 705
- [27] Pounds K.A., Reeves J.N., Page K.L., O’Brien P.T. 2004, ApJ, 616, 696 (Po04)
- [28] Pounds K.A., Page K.L. 2006, MNRAS, 372, 1275
- [29] Pounds K.A., Reeves J.N. 2009, MNRAS, 397, 249
- [30] Pounds K.A., Vaughan S. 2011, in preparation (Paper II)
- [31] Reeves J.N., O’Brien P., Ward M.J. 2003, ApJ, 593, L65
- [32] Russell D.G. 2003, astro-ph/0310284
- [33] Steenbrugge K.C, Fenovcik M., Kaastra J.S., Costantini E., Verbunt F. 2009, A&A, 496, 107
- [34] Strüder L.et al. 2001, A&A, 365, L18
- [35] Tananbaum H., Peters G., Forman W., Giacconi R., Jones C., Avni Y. 1978, ApJ, 223, 74
- [36] Tombesi F., Cappi M., Reeves J.N., Palumbo G.G.C., Yaqoob T., Braito V., Dadina M. 2010, A&A, 521, 57
- [37] Turner M.J.L. et al. 2001, A&A, 365, L27
- [38] Uttley P., Fruscione A., McHardy I., Lamer G. 2003, ApJ, 595, 656
- [39] Vaughan S., Uttley P., Pounds K.A., Nandra K., Strohmeyer T.E. 2010, submitted to MNRAS
- [40] Verheijen M.A.W. 2001, ApJ, 563, 694
- [41] Verner D.A., Ferland G.J. 1996, ApJS, 103, 467