Suzaku observes weak flares from IGR J173913021 (catalog )
representing a common low-activity state in this SFXT
Abstract
We present an analysis of a 37-ks observation of the supergiant fast X-ray transient (SFXT) IGR J173913021 (catalog ) (XTE J1739302) gathered with Suzaku. The source evolved from quiescence to a low-activity level culminating in three weak flares lasting 3 ks each in which the peak luminosity is only a factor of 5 times that of the pre-flare luminosity. The minimum observed luminosity was erg s-1(/2.7 kpc)2 in the 0.5–10 keV range. The weak flares are accompanied by significant changes in the spectral parameters including a column density ( cm-2) that is 2–9 times the absorption measured during quiescence. Accretion of obscuring clumps of stellar wind material can explain both the small flares and the increase in . Placing this observation in the context of the recent Swift monitoring campaign, we find that weak-flaring episodes, or at least epochs of enhanced activity just above the quiescent level but well below the moderately bright or high-luminosity outbursts, represent more than 605% of all observations in the 0.5–10 keV energy range making this the most common state in the emission behavior of IGR J173913021 (catalog ).
1 Introduction
Supergiant Fast X-ray Transients (SFXTs: Smith et al., 2004; Sguera et al., 2005, 2006; Negueruela et al., 2006b) form a new subclass within the group of high-mass X-ray binaries (HMXBs). Previously, HMXBs were catalogued (e.g. Liu et al., 2000, and references therein) into one of either two groups: the transient sources with B-emission line stellar companions (BeXBs); or the persistent, but variable, HMXBs with supergiant O or B-type companions (SGXBs). The SFXTs share properties from both groups: like BeXBs, they are characterized by outbursts of short (hours) to long (days) duration whereby the peak intensity is several orders of magnitude greater than during quiescence; and like SGXBs, they are systems in which a compact object (usually a neutron star) is paired with a supergiant OB star. Their study is therefore important because SFXTs could represent an evolutionary link between BeXBs and SGXBs (e.g. Negueruela et al., 2008; Chaty, 2010; Bodaghee et al., 2010; Liu et al., 2010).
XTE J1739302 (catalog ) (Smith et al., 1998) was the first hard X-ray transient to display behavior that was identified as characteristic of the class of SFXTs (Negueruela et al., 2006b). It was listed as AX J1739.13020 (catalog ) in the ASCA catalog of X-ray sources in the Galactic Center region (Sakano et al., 2002). Five years after its discovery, INTEGRAL detected a transient source named IGR J173913021 (catalog ) which, because of the positional coincidence and similar emission behavior, was shown to be the hard -ray (18–50 keV) counterpart to the RXTE source (Sunyaev et al., 2003; Smith et al., 2003). A refined X-ray position was obtained with Chandra (Smith et al., 2006), which led to the identification of USNO-B1.0 0596-0585865 (catalog ) ( 2MASS J173911553020380 (catalog )), a supergiant star of spectral type O8 Iab located 2.7 kpc away, as the optical/IR counterpart (Negueruela et al., 2006a; Chaty et al., 2008; Rahoui et al., 2008).
This source has been detected numerous times in outburst and in quiescence thanks to monitoring campaigns with INTEGRAL (Lutovinov et al., 2005; Sguera et al., 2005; Türler et al., 2007; Blay et al., 2008; Chenevez et al., 2008; Romano et al., 2009b; Ducci et al., 2010) and with Swift (Romano et al., 2008a, b; Sidoli et al., 2008, 2009a, 2009b; Romano et al., 2009a, 2010). Most of the outbursts are short (0.5 h) and weak (10 cps in 20–40 keV as seen with INTEGRAL), while a few flares last longer than an hour (sometimes days as seen in the 0.5–10 keV band with Swift) and are rather intense (60 cps or 400 mCrab with INTEGRAL) (Blay et al., 2008). The photoelectric absorption is variable from outburst to outburst (Smith et al., 2006), reaching up to cm-2 during the rising portion of certain flaring episodes (Sidoli et al., 2009a, b). The dynamic range between quiescence and peak outburst is (in’t Zand, 2005). Based on multiple observations of IGR J173913021 (catalog ) gathered over the course of a year with Swift, Romano et al. (2009a) showed that bright outbursts account for only 3–5% of the entire observation set, while the source spends 395% of the time in an inactive state near quiescence. Quiescence, i.e., a flux in the 0.5–10 keV range below the Swift detection limit of erg cm-2 s-1 for a 1 ks exposure, is a very rare state (Romano et al., 2009a).
What triggers the outbursts is still an open question. Several mechanisms have been proposed to explain the peculiar X-ray emission behavior of SFXTs. The outbursts could be due to one or a combination of the following effects: the intermittent accretion of clumpy wind material by a compact object in a larger orbital radius than in classical SGXBs; passage of the compact object in an eccentric orbit through anisotropic winds emanating from some supergiant stars; and the dynamics of wind accretion onto highly-magnetized neutron stars including gating effects, photo-ionization, transient disks, and Rayleigh-Taylor instabilities (e.g. in’t Zand, 2005; Walter & Zurita Heras, 2007; Sidoli et al., 2007; Negueruela et al., 2008; Bozzo et al., 2008; Ducci et al., 2009, and references therein).
While the identity of the stellar companion is known, the nature of the compact object has yet to be conclusively determined. The spectral properties of IGR J173913021 (catalog ), i.e. its hard power-law shape and possible spectral cutoff around 13 keV (Sidoli et al., 2009a), suggest a neutron star primary. However, coherent pulsations or cyclotron absorption lines that would firmly establish the presence of a neutron star have not been detected thus far (Smith et al., 1998; Sguera et al., 2005; Blay et al., 2008). Recently, the orbital period of the system was shown to be 51.47(2) d with hard X-ray outbursts (20 keV) and quiescent epochs coexisting at periastron suggesting clumpy, anisotropic winds (Drave et al., 2010).
In February, 2008, Suzaku observed IGR J173913021 (catalog ) for 37 ks of effective exposure time. The data from this observation are described in Section 2. Results from timing and spectral analyses are reported in Sections 3 and 4, respectively. We discuss our findings and present our conclusions in Sections 5–6.
2 Observations
| state | absorbed flux (0.5–10 keV) | example time | reference |
| (erg cm-2 s-1) | (MJD) | ||
| quiescence | 54518.495–54518.920 | this work, see also Bozzo et al. (2010) | |
| low | 54518.920–54519.396 | this work, see also Sidoli et al. (2008); Romano et al. (2009a, 2010); Bozzo et al. (2010) | |
| medium | 54635 | Romano et al. (2009a, 2010) | |
| high | 54692 | Romano et al. (2009a, 2010) |
The Suzaku space telescope features two co-aligned instruments working in tandem to observe the hard X-ray sky (0.2–600 keV): the X-ray Imaging Spectrometer (XIS: Koyama et al., 2007) and the Hard X-ray Detector (HXD: Takahashi et al., 2007). Currently, XIS consists of two front-illuminated CCD cameras (XIS0 and XIS3), and one that is back-illuminated (XIS1).
Observation ID 402066010 (PI: J.A. Tomsick) targeted IGR J173913021 (catalog ) on February 22–23, 2008 (MJD 54518.495–54519.396), for 72.271 ks. After removing bad events during data reduction (see below), and observation gaps due to the occultation of the satellite by the Earth, the net exposure time that remained was 36.546 ks. The XIS-nominal pointing mode was used with the quarter-window option in order to gain a higher time resolution.
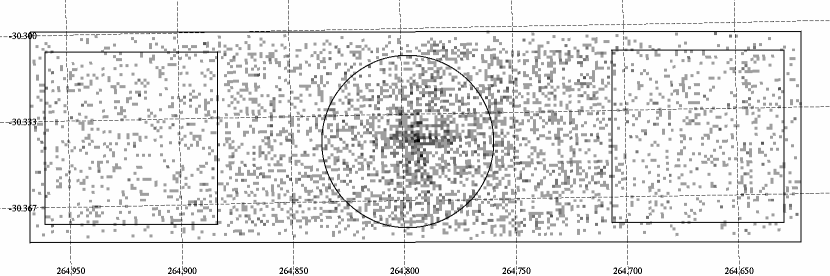
Data reduction employed v.6.9 of the HEAsoft software package following the procedures described in the Suzaku ABC Guide v.2. The task xispi converted the unfiltered XIS event files to pulse-invariant channels, which were then input into xisrepro to return cleaned event files. We extracted the source spectrum from each XIS detector using a circular region of 120′′-radius centered on the position given by Chandra (see Fig. 1). The background was extracted from a pair of 240′′-wide squares positioned on a source-free region of the detector. Based on these source and background extraction regions, we generated response matrices with xisrmfgen and xissimarfgen.
To improve photon statistics, we merged the source spectral files for the front-illuminated CCDs (XIS0 and XIS3), and we did the same for the background. Each bin in the XIS spectra contained a minimum of 150 counts. Source and background light curves were generated in 0.5–10 keV (XIS) with a time resolution of 2 s. Timing data from the 3 XIS detectors were combined into single light curves for the source and for the background.
A tuned (v.2.0) background file and the common GTI were used during spectral extraction of HXD-PIN. Dead-time corrections were performed with hxddtcor. The cosmic X-ray background was modeled using the flat-field response file from January 29, 2008, and its contribution was accounted for in the PIN background spectrum. Since IGR J173913021 (catalog ) was very weak during this observation, PIN recorded few high-energy photons. Furthermore, IGR J173913021 (catalog ) is located close to the Galactic Center so diffuse emission from the Galactic Ridge can influence the high-energy spectrum of IGR J173913021 (catalog ) (Yuasa et al., 2008). Applying the best-fitting parameters for the ridge emission from Valinia & Marshall (1998) to the PIN spectrum, we find that the ridge contributes over 50% of the PIN photon counts. Hence, the statistics being insufficient for timing and spectral analyses, observations with PIN are not discussed any further.
3 Timing Analysis
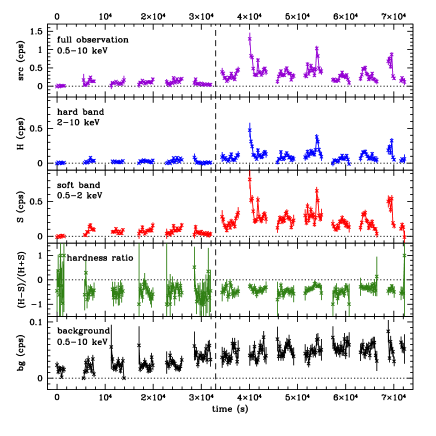
Figure 2 presents the light curve of IGR J173913021 (catalog ) in the 0.5–10 keV band from XIS. In this energy range, the average source count rate (combining XIS 0, 1, and 3) for the entire observation is 0.2510.005 cps. The best-fitting model to the (absorbed) spectrum of the time-averaged Suzaku observation (see Sect. 4) yields a coefficient of erg cm-2 ct-1 which we can use to convert instrumental count rates to units of erg cm-2 s-1. Thus, the average flux is erg cm-2 s-1.
Based on Fig. 2, we can identify two distinct emission states from IGR J173913021 (catalog ) in this observation. During the initial 33 ks, IGR J173913021 (catalog ) is in a quiescent state in which the average source count rate is 0.1000.009 cps ( erg cm-2 s-1). As with previous observations of IGR J173913021 (catalog ) when it was at or near quiescence (Sidoli et al., 2008; Romano et al., 2009a, 2010; Bozzo et al., 2010), our Suzaku observation shows that even in this state, IGR J173913021 (catalog ) varies on time scales of a few hundred seconds.
Around 33 ks after the start of the observation (corresponding to MJD 54518.92), the source enters a low state in which the mean count rate of 0.3580.008 cps ( erg cm-2 s-1) is a factor 3–4 that of the flux in the quiescent state that preceded it. The observations prior to and after MJD 54518.92 are henceforth referred to in this analysis as “quiescent” and “low” states, respectively (see Table 1). In addition, three flares lasting 2 ks each are revealed in the light curve at , 54, and 70 ks. The peak flux of 1.30.2 cps ( erg cm-2 s-1) is an order of magnitude larger than the flux during the quiescent state, but the maxima are still much lower than the typical high-state outbursts expected and seen in such objects. We note that the peaks are nearly equidistant in time being separated by intervals of approximately 15 ks.
The light curve was divided into two pieces corresponding to a soft (S) band between 0.5 and 2 keV, and a hard band (H) with energies between 2 and 10 keV. The hardness ratio can then be defined as (HS)/(H+S) where a negative value indicates a soft spectrum, and where a positive value denotes a hard spectrum. Figure 2 displays no obvious correlation between the hardness ratio and the source intensity. Binning the light curve into longer time segments, and plotting the hardness ratio versus the source intensity shows only a marginal correlation (but within the errors) between the two parameters at large intensities.
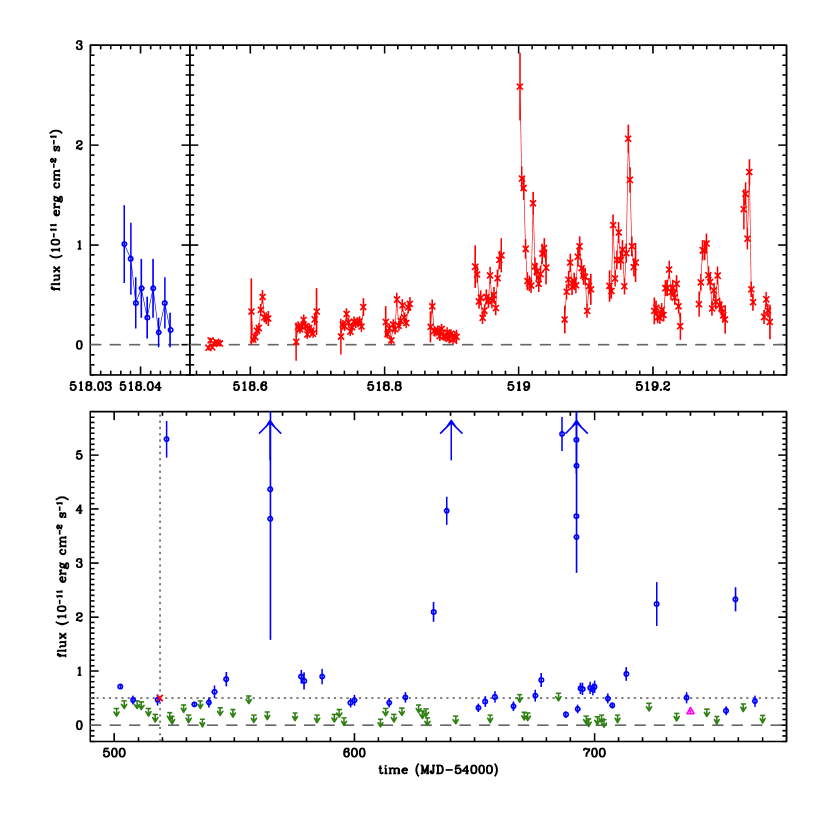
As part of a monitoring campaign focusing on SFXTs, Swift targeted IGR J173913021 (catalog ) at various times throughout 2008 (Romano et al., 2009a). In particular, there is a 900-s long XRT pointing (Obs. ID: 00030987012) several hours prior to our Suzaku observation. The 0.5–10 keV Swift-XRT detections and 3 upper limits are shown along with the average count rate recorded by XIS in Fig. 3. The instrumental conversion coefficient for XRT is erg cm-2 ct-1 (Romano et al., 2009a).
4 Spectral Analysis
The time-averaged spectrum of IGR J173913021 (catalog ) gathered in the 0.5–10 keV range by XIS is presented in Fig. 4. We fit an absorbed power law, employing the abundances of Wilms et al. (2000) and the photo-ionization cross sections of Balucinska-Church & McCammon (1992), to the XIS spectra which yields 1.40.1 and (3.60.4) cm-2 (errors are provided at the 90% confidence level). These are compatible with the values derived by Sidoli et al. (2008) for out-of-outburst epochs in a similar energy range with Swift-XRT, with an average luminosity that is slightly higher at erg s-1 compared with erg s-1 for Sidoli et al. (2008). Both studies assume a source distance of 2.7 kpc (Rahoui et al., 2008). The model fits the data well ( for 66 degrees of freedom: dof).
Residuals remain at low energies (1 keV) which could hint at the presence of soft excess emission. We know that this source exhibits a soft excess since this emission was detected with XMM-Newton (Bozzo et al., 2010). To account for this feature, we added a blackbody whose temperature was fixed to the best-fitting value from XMM-Newton ( keV). This reduces the to 0.55 for 65 dof (-test probability of 5), and cm-2, but the photon index is poorly constrained ().
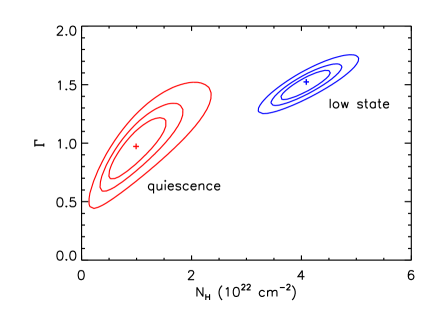
We split the spectra into two segments corresponding to the quiescent and low states described in Sect. 3 (i.e. before and after MJD 54518.92). Table 2, which lists the spectral parameters of IGR J173913021 (catalog ) for each epoch, shows that there is a clear distinction in column density, photon index, and luminosity. The is at least twice as high in the low state ( cm-2) as it is in the quiescent phase ( cm-2). The source spectrum is softer () during the low state compared to the quiescent state (). The unabsorbed 0.5–10 keV luminosity rises from 1.3 when the source is quiescent to 7.4 erg s-1 when it is in the low state.
Figure 5 illustrates the incompatibility (at 99% confidence) in the absorbing column from quiescence to the low state. It is clear from this figure that the column density is the main parameter that evolves from quiescent to low states. Indeed, for a constant , the ranges from 1 to cm-2 between quiescent and low states, respectively. This is different from what was seen by Bozzo et al. (2010) who found that the column density remained steady (within the statistical errors) during the low state while the varied by around 50%.
To test whether we overestimated the column density during the low state by not considering a soft excess, we included a blackbody component in the spectral fits to quiescent and low states, and we fixed its temperature to the optimal value from Bozzo et al. (2010) (1.2 keV). The absorbing columns remain inconsistent (at the 90% confidence level) between quiescence ( cm-2) and the low state ( cm-2). When the blackbody is fixed to the lower temperature of 0.13 keV provided by Bozzo et al. (2010), the column densities are compatible within the large error bars between the quiescent ( cm-2) and low states ( cm-2), but in this case, the resulting blackbody radius is 100 km which is much larger than the expected size of the compact accretor.
For ease of comparison with previous studies, we fit the source spectrum with models used for this source by other authors (Sidoli et al., 2008; Romano et al., 2009a; Bozzo et al., 2010). An absorbed blackbody provides a better fit than the absorbed power law ( for 66 dof). The parameters from this model agree with those describing the blackbody-modeled spectrum of IGR J173913021 (catalog ) when it was in the low state as seen with Swift (Sidoli et al., 2008; Romano et al., 2009a). The results of this model fit to the various states (i.e. time-averaged observation, quiescence, and low state) are listed in Table 2. Once again, statistically significant differences emerge for the column density (as well as for the radius of the blackbody emission region) for spectra collected in quiescence ( cm-2) and during the low state ( cm-2).
In the low state, a power law with a partial-covering absorber and an additional component to account for Galactic absorption (fixed to cm-2 from Kalberla et al. (2005)) yields cm-2 with a covering fraction of and (dof ). In other words, during the low state that we observed, a large percentage of the X-ray emission is shielded by an absorber whose is higher than the expected interstellar value. We could not constrain the value of the partially-absorbing column in the quiescent state.

| model | parameter | time-averaged | quiescence | low state |
|---|---|---|---|---|
| PL | ||||
| 5.5 | 1.5 | 8.5 | ||
| 4.8 | 1.3 | 7.4 | ||
| /dof | 0.82/66 | 0.68/8 | 0.73/54 | |
| CP | ||||
| 4.0 | 1.3 | 5.7 | ||
| 3.5 | 1.1 | 4.9 | ||
| /dof | 0.57/65 | 0.64/7 | 0.44/53 | |
| BB | ||||
| 3.4 | 1.2 | 5.1 | ||
| 3.0 | 1.0 | 4.4 | ||
| /dof | 0.71/66 | 0.73/8 | 0.51/54 |
| model | parameter | LCR | MCR | HCR |
|---|---|---|---|---|
| count rate range (cps) | 0.1 | 0.1–0.3 | 0.3 | |
| average count rate (cps) | 0.05 | 0.19 | 0.45 | |
| exposure time (ks) | 22 | 11 | 4 | |
| PL | ||||
| /dof | 1.2/11 | 0.83/34 | 0.50/38 | |
| CP | ||||
| (fixed) | (fixed) | (fixed) | ||
| /dof | 1.2/10 | 0.71/34 | 0.27/38 | |
| BB | ||||
| /dof | 1.6/10 | 0.72/34 | 0.72/34 |
A cutoff power law model gives a good fit to the time-averaged spectrum (dof ). The power law index is with a cutoff at keV, and the column density is cm-2. These are consistent with the parameters listed in Bozzo et al. (2010). The index and cutoff energy are compatible between the quiescent (, keV) and low (, keV) states. In this case, the upper limit to the column density during quiescence ( cm-2) lies within the 90% confidence interval of in the low state ( cm-2).
The spectra were also fit with the Mewe-Kaastra-Liedahl (MEKAL) model employing a dual absorber: one that affects the system’s soft X-ray emission from hot diffuse gas in the supergiant star’s wind (sg); and another that impacts the high-energy power-law emission from the compact accretor (x). The gas temperature was set to 0.15 keV (Bozzo et al., 2010). In the quiescent state, we obtain cm-2 and cm-2 for fixed to the optimal value of 1.0 from the absorbed power law fit to the quiescent spectrum (dof ). For the spectrum from the low state, cm-2 and cm-2 for (dof ). This suggests that not only is there material around the binary system absorbing X-rays, there is additional matter located near the compact object.
We sought to determine how the spectral parameters varied with the source intensity. So we created spectra from time intervals in which the count rates (CR) were 0.1 cps (“low CR” or LCR), between 0.1 and 0.3 cps (“medium CR” or MCR), and 0.3 cps (“high CR” or HCR). Then, each rate-resolved spectrum was fit with an absorbed power law, an absorbed cutoff power law with fixed to our best-fitting value (3 keV), and an absorbed blackbody model. Table 3 lists the results of the spectral fits. Regardless of the spectral model, the is significantly smaller during the LCR epochs. The MCR and HCR epochs have spectra that are consistent, and both are statistically incompatible with the spectrum from LCR epochs.
5 Discussion
5.1 Weak Flares and Low Activity
Our analysis of a Suzaku observation of IGR J173913021 (catalog ) revealed the source evolving from quiescence to a low-activity state. Yet even at this low-flux level, the emission from IGR J173913021 (catalog ) is characterized by variability on time scales of hundreds to thousands of seconds indicating an accretion that is continuous and dynamic. The average luminosity of IGR J173913021 (catalog ) during the entire Suzaku observation is erg s-1 (unabsorbed) and erg s-1 (absorbed) in the 0.5–10 keV range, and assuming a source distance of 2.7 kpc (Rahoui et al., 2008).
During the quiescent state, which consists of the first 33 ks of the observation, the luminosity in the 0.5–10 keV band is only erg s-1 as observed, and erg s-1 when corrected for absorption. This is equivalent to the lowest luminosity detected by ASCA (Sakano et al., 2002). In our flux-limited spectrum (LCR), the unabsorbed luminosity is erg s-1, i.e., twice the minimum values measured with XMM-Newton (Bozzo et al., 2010) and Swift (Romano et al., 2010).
Concluding our observation is a 39-ks epoch of enhanced activity including three flares lasting 1–3 ks each where the peak luminosities are only a factor of 5 greater than the quiescent baseline emission that preceded it. Clearly, these flares are significantly weaker than the typical high-luminosity outbursts of SFXTs in which the dynamic range is a few orders of magnitude. These small spikes are reminiscent of the short, low-intensity flares seen in this source by Bozzo et al. (2010) with XMM-Newton.
Separated by regular intervals of approximately 15 ks, the flares appear to be quasi-periodic. This timescale is well short of the established orbital period of 51 days (Drave et al., 2010), and it is probably too long for a pulsation period if the compact object is, indeed, a neutron star. Ducci et al. (2010) detected quasi-periodic outbursts of similar frequency from this source in INTEGRAL observations, but for longer flares (between 5 and 10 ks) of much higher intensity ( erg s-1). They ascribe the quasi-periodic flaring to the formation and dissipation of an unstable accretion disk which is the mechanism favored by Smith et al. (2006) to explain bright outbursts in this source. The pulsation period of the suspected neutron star has never been measured, despite numerous observations in and out of outburst. If the pulse period of the suspected NS in this system were known, then a change in the sign of the period derivative could indicate a dissipation and reformation of a disk (Taam et al., 1988). This 15-ks frequency could possibly correspond to a periodicity but we would require further observations to confirm or reject this possibility.
5.2 Spectral Evolution
The evolution of the emission from quiescence to the low state is accompanied by changes in the X-ray spectral parameters. The is higher and the spectral slope is steeper during the low state than during quiescence. Similarly, the high count-rate resolved spectrum showed larger and photon index than the low count-rate resolved spectrum. The main parameter that evolves is the column density. This is different from the weak flares seen by Bozzo et al. (2010) who found that as the average count rate of the spectrum increased, became smaller (i.e. flatter, harder spectra, and more positive hardness ratios) while the did not change significantly.
Differences in the spectral properties of the flares caught by Suzaku and the ones seen with XMM-Newton could be due to unequal geometric configurations of the accretion stream between the observations. The capture by the NS of a clump of wind material will lead to an increase in the mass-accretion rate which both instruments detect as a spike in the X-ray luminosity. A partial-covering model fit to the X-ray spectra from the weak flares observed by Bozzo et al. (2010) suggests that up to 40% of the X-ray emission is not absorbed by the clump itself, but rather by the interstellar medium. The same model fit to our low-state spectrum reveals an absorber that shields a much larger fraction of the X-ray source (less than 13% of the emission is unblocked).
On the other hand, if prior to being accreted, the captured material crosses the line of sight between the observer and the NS, the flare will be accompanied by an increase in the column density, which is precisely what we observe (see also Rampy et al., 2009). The expected interstellar value along the line of sight is (1.2–1.3) cm-2 (Dickey & Lockman, 1990; Kalberla et al., 2005), consistent with what we measured during quiescence. This represents an upper limit in the direction of the source since it results from the integration of absorbing material through the entire Galaxy, while IGR J173913021 (catalog ) is located only 3 kpc away. The from a power law fit to the spectrum of IGR J173913021 (catalog ) during its low state is 2–4 times the interstellar value and 2–9 times the quiescent value. This suggests that the source is not strongly absorbed (intrinsically) during this observation except when the NS accretes a clump passing along our line of sight. Material in a clump located near the NS will be photo-ionized so the true column density is expected to be higher than our measured value which assumes cold neutral gas. Our largest column density remains an order of magnitude below the maximum measured for this source, cm-2 (Smith et al., 2006), although their result relied on a spectrum from RXTE that did not extend below 2.5 keV.
If the origin of the hard X-ray emission is a blackbody, then this radius expands from m during quiescence to m when the source is in the low state, in agreement with Romano et al. (2009a) who showed the blackbody radius growing with intensity. It is tempting to associate this small blackbody-emitting region with the polar caps of a magnetized accreting neutron star (: Hickox et al., 2004). However, Bozzo et al. (2010) caution that models describing spherically-symmetric accretion onto magnetized neutron stars predict an inverse relation between the size of the hot spot and the square root of the X-ray luminosity, at least for systems with an average erg s-1 (White et al., 1983, and references therein).
5.3 The Ubiquity of Low Activity
Our Suzaku observation of IGR J173913021 (catalog ), when placed in the context of the long-term monitoring campaign of this source by Swift-XRT (Romano et al., 2009a), shows that the average flux that we recorded is consistent with many of the XRT detections at a low flux level ( erg cm-2 s-1), and is on par with a few of the 3 upper limits to the count rates of non-detections as measured by XRT (Fig. 3).
Weak flares that are just above quiescence, and whose peak fluxes are at the level of the faint detections in the Swift monitoring data, compels us to propose four states in the emission behavior of IGR J173913021 (catalog ): the extremely low but variable emission of quiescence (average erg cm-2 s-1 in 0.5–10 keV); a low-activity state that potentially includes weak flares such as those seen here and in Bozzo et al. (2010) ( erg cm-2 s-1); a medium state with flares of larger amplitude ( erg cm-2 s-1); and finally, a high state in which the outbursts represent the maximum source luminosity ( erg cm-2 s-1). The boundaries are not strict since the peak fluxes in the low state extend up to erg cm-2 s-1, but they provide a useful classification for the various emission states in this source.
If we assume that the Swift detections when the count rates were sufficiently low (i.e. erg cm-2 s-1) were due to low states that may or may not include weak flares, then we can define a low-state duty cycle (DC) as follows:
| (1) |
Here, is the sum of exposure times of all observations in which IGR J173913021 (catalog ) is detected at an average flux within the range of erg cm-2 s-1, including the Suzaku and XMM-Newton observations, while denotes the total exposure from all observations. As expected, the duty cycle is not far from the value of 615% provided in Romano et al. (2009a, 2010).
Low-activity states in which the flux is above the “typical” quiescent level, but well below the medium and bright flaring episodes, are therefore quite common in this source. In the field of IGR J173913021 (catalog ), the limiting flux for XRT is and erg cm-2 s-1 for exposure times of 1 and 30 ks, respectively (Romano et al., 2009a). Therefore, most Swift upper limits would be detections if the exposures had been equivalent to those of the Suzaku and XMM-Newton observations suggesting that the duty cycle of the low state is much higher.
According to the source ephemeris (Drave et al., 2010), the midpoint of our observation coincides with an orbital phase of whereas the XMM-Newton observation took place at phase 0.8. This is another indication that the low state is common since it is not confined to a specific part of the orbit.
Despite the large duty cycle, weak flares lasting a few hundred to a few thousand seconds can be missed by short monitoring observations. Because their peak flux is so low, detecting a low state requires prolonged observations where the long integration time guarantees that we will achieve the sensitivity necessary to detect such low levels of activity. Given that IGR J173913021 (catalog ) is a prototypical member of its class, it would not be surprising to find weak flares from other SFXTs as telescopes continue to devote observing time to such objects. In fact, recent Suzaku and XMM-Newton observations of the SFXT IGR J084084503 (catalog ) included similar low states that were punctuated by weak flares (Bozzo et al., 2010; Sidoli et al., 2010).
6 Summary & Conclusions
The main results from our Suzaku observation of the SFXT IGR J173913021 (catalog ) can be summarized as follows:
-
-
For most of the observation, IGR J173913021 (catalog ) is in what we believe represents the quiescent state. The unabsorbed luminosity in the 0.5–10 keV range is erg s-1, and as low as erg s-1 in the flux-limited spectrum. The spectrum from this epoch is well described by an absorbed, hard power law with cm-2 and , or by an absorbed thermal blackbody with a temperature of keV.
-
-
Around 33 ks into the observation (MJD 54518.92) the source became slightly more active (“low state”) culminating in a series of weak flares each lasting 3 ks whose peak luminosity is only a factor of 5 greater than the quiescent emission that preceded it. During this low state, the reached cm-2 which is a factor of 2–4 times that of the expected interstellar value, and which is 2–9 times the measured during quiescence. The accretion of small clumps of stellar wind material can be responsible for the weak flares, while the increase in can be explained by the passage of the clump in the line-of-sight to the X-ray source prior to accretion.
-
-
The average luminosity of the entire observation is erg s-1. When placed in the full light curve from the Swift-XRT monitoring campaign by Romano et al. (2009a), we find that this luminosity is on par with the low-intensity XRT detections (as well as a few of the 3 upper limits from non-detections). Furthermore, we suspect that many of the faintest detections from the XRT contain similar low states (potentially including weak flares) that are just above the quiescent flux. We estimate that the duty cycle of the low state is 605%, which makes it the most common state for this source.
As a prototypical member of the class of SFXTs, IGR J173913021 (catalog ) holds valuable clues to the accretion processes of these intriguing transients. Continued monitoring of this source by sensitive instruments such as Suzaku should fuel the ongoing debate concerning the mechanisms that are responsible for their peculiar emission behavior.
References
- Balucinska-Church & McCammon (1992) Balucinska-Church, M., & McCammon, D. 1992, ApJ, 400, 699
- Blay et al. (2008) Blay, P., et al. 2008, A&A, 489, 669
- Bodaghee et al. (2010) Bodaghee, A., Tomsick, J. A., & Rodriguez, J. 2010, in Bulletin of the American Astronomical Society, Vol. 41, Bulletin of the American Astronomical Society, 653–+
- Bozzo et al. (2008) Bozzo, E., Falanga, M., & Stella, L. 2008, ApJ, 683, 1031
- Bozzo et al. (2010) Bozzo, E., Stella, L., Ferrigno, C., Giunta, A., Falanga, M., Campana, S., Israel, G., & Leyder, J. C. 2010, ArXiv e-prints: 1004.2059
- Chaty (2010) Chaty, S. 2010, Proceedings of Science, 71
- Chaty et al. (2008) Chaty, S., Rahoui, F., Foellmi, C., Tomsick, J. A., Rodriguez, J., & Walter, R. 2008, A&A, 484, 783
- Chenevez et al. (2008) Chenevez, J., et al. 2008, The Astronomer’s Telegram, 1471, 1
- Dickey & Lockman (1990) Dickey, J. M., & Lockman, F. J. 1990, ARA&A, 28, 215
- Drave et al. (2010) Drave, S. P., Clark, D. J., Bird, A. J., McBride, V. A., Hill, A. B., Sguera, V., Scaringi, S., & Bazzano, A. 2010, ArXiv e-prints: 1007.3379
- Ducci et al. (2009) Ducci, L., Sidoli, L., Mereghetti, S., Paizis, A., & Romano, P. 2009, MNRAS, 398, 2152
- Ducci et al. (2010) Ducci, L., Sidoli, L., & Paizis, A. 2010, MNRAS, 408, 1540
- Hickox et al. (2004) Hickox, R. C., Narayan, R., & Kallman, T. R. 2004, ApJ, 614, 881
- in’t Zand (2005) in’t Zand, J. J. M. 2005, A&A, 441, L1
- Kalberla et al. (2005) Kalberla, P. M. W., Burton, W. B., Hartmann, D., Arnal, E. M., Bajaja, E., Morras, R., & Pöppel, W. G. L. 2005, A&A, 440, 775
- Koyama et al. (2007) Koyama, K., et al. 2007, PASJ, 59, 23
- Liu et al. (2010) Liu, Q. Z., Chaty, S., & Yan, J. Z. 2010, submitted to ApJ
- Liu et al. (2000) Liu, Q. Z., van Paradijs, J., & van den Heuvel, E. P. J. 2000, A&AS, 147, 25
- Lutovinov et al. (2005) Lutovinov, A., Revnivtsev, M., Molkov, S., & Sunyaev, R. 2005, A&A, 430, 997
- Negueruela et al. (2006a) Negueruela, I., Smith, D. M., Harrison, T. E., & Torrejón, J. M. 2006a, ApJ, 638, 982
- Negueruela et al. (2006b) Negueruela, I., Smith, D. M., Reig, P., Chaty, S., & Torrejón, J. M. 2006b, in ESA Special Publication, Vol. 604, The X-ray Universe 2005, ed. A. Wilson, 165–+
- Negueruela et al. (2008) Negueruela, I., Torrejón, J. M., Reig, P., Ribó, M., & Smith, D. M. 2008, in American Institute of Physics Conference Series, Vol. 1010, A Population Explosion: The Nature & Evolution of X-ray Binaries in Diverse Environments, ed. R. M. Bandyopadhyay, S. Wachter, D. Gelino, & C. R. Gelino, 252–256
- Rahoui et al. (2008) Rahoui, F., Chaty, S., Lagage, P., & Pantin, E. 2008, A&A, 484, 801
- Rampy et al. (2009) Rampy, R. A., Smith, D. M., & Negueruela, I. 2009, ApJ, 707, 243
- Romano et al. (2008a) Romano, P., et al. 2008a, The Astronomer’s Telegram, 1466, 1
- Romano et al. (2008b) —. 2008b, The Astronomer’s Telegram, 1659, 1
- Romano et al. (2009a) —. 2009a, MNRAS, 399, 2021
- Romano et al. (2009b) —. 2009b, The Astronomer’s Telegram, 1961, 1
- Romano et al. (2010) —. 2010, MNRAS, 1535
- Sakano et al. (2002) Sakano, M., Koyama, K., Murakami, H., Maeda, Y., & Yamauchi, S. 2002, ApJS, 138, 19
- Sguera et al. (2005) Sguera, V., et al. 2005, A&A, 444, 221
- Sguera et al. (2006) —. 2006, ApJ, 646, 452
- Sidoli et al. (2010) Sidoli, L., Esposito, P., & Ducci, L. 2010, ArXiv e-prints: 1007.1091
- Sidoli et al. (2007) Sidoli, L., Romano, P., Mereghetti, S., Paizis, A., Vercellone, S., Mangano, V., & Götz, D. 2007, A&A, 476, 1307
- Sidoli et al. (2008) Sidoli, L., et al. 2008, ApJ, 687, 1230
- Sidoli et al. (2009a) —. 2009a, ApJ, 690, 120
- Sidoli et al. (2009b) —. 2009b, MNRAS, 397, 1528
- Smith et al. (2006) Smith, D. M., Heindl, W. A., Markwardt, C. B., Swank, J. H., Negueruela, I., Harrison, T. E., & Huss, L. 2006, ApJ, 638, 974
- Smith et al. (2003) Smith, D. M., Heindl, W. A., Swank, J. H., Harrison, T. E., & Negueruela, I. 2003, The Astronomer’s Telegram, 182, 1
- Smith et al. (1998) Smith, D. M., Main, D., Marshall, F., Swank, J., Heindl, W. A., Leventhal, M., in ’t Zand, J. J. M., & Heise, J. 1998, ApJ, 501, L181+
- Smith et al. (2004) Smith, D. M., Negueruela, I., Heindl, W. A., Markwardt, C. B., & Swank, J. H. 2004, in Bulletin of the American Astronomical Society, Vol. 36, Bulletin of the American Astronomical Society, 954–+
- Sunyaev et al. (2003) Sunyaev, R., Lutovinov, A., Molkov, S., & Deluit, S. 2003, The Astronomer’s Telegram, 181, 1
- Taam et al. (1988) Taam, R. E., Brown, D. A., & Fryxell, B. A. 1988, ApJ, 331, L117
- Takahashi et al. (2007) Takahashi, T., et al. 2007, PASJ, 59, 35
- Türler et al. (2007) Türler, M., et al. 2007, The Astronomer’s Telegram, 1019, 1
- Valinia & Marshall (1998) Valinia, A., & Marshall, F. E. 1998, ApJ, 505, 134
- Walter & Zurita Heras (2007) Walter, R., & Zurita Heras, J. 2007, A&A, 476, 335
- White et al. (1983) White, N. E., Swank, J. H., & Holt, S. S. 1983, ApJ, 270, 711
- Wilms et al. (2000) Wilms, J., Allen, A., & McCray, R. 2000, ApJ, 542, 914
- Yuasa et al. (2008) Yuasa, T., et al. 2008, PASJ, 60, 207