Probing nearest-neighbor correlations of ultracold fermions in an optical lattice
Abstract
We demonstrate a probe for nearest-neighbor correlations of fermionic quantum gases in optical lattices. It gives access to spin and density configurations of adjacent sites and relies on creating additional doubly occupied sites by perturbative lattice modulation. The measured correlations for different lattice temperatures are in good agreement with an ab initio calculation without any fitting parameters. This probe opens new prospects for studying the approach to magnetically ordered phases.
pacs:
03.75.Ss, 05.30.Fk, 71.10.Fd, 78.47.-pThe Fermi-Hubbard Hamiltonian is one of the central models for understanding strongly correlated electron systems in condensed matter physics. It incorporates intriguing phenomena such as Mott-insulating behavior or spin ordered phases and is a prominent candidate for describing the origin of high superconductivity. Despite tremendous theoretical effort, several questions still remain open, in particular concerning the low temperature phases. Here, ultracold atomic gases trapped in optical lattices offer the opportunity to address these questions in a very clean way, as they constitute an almost ideal implementation of the Hubbard model Bloch2008 ; Esslinger2010 . The recent realization of a fermionic Mott insulator Jordens2008 ; Schneider2008 demonstrates the unique tunability and control of these systems.
Considerable experimental efforts are currently directed towards reaching the low-temperature regime of quantum magnetism in a two-component quantum gas. Detection of the antiferromagnetically ordered state has been proposed via noise correlation or Bragg scattering measurements Corcovilos2010 ; Altman2004 . These observables reveal long range spin ordering and consequently only show a strong signature well below the critical temperature. However, a probe sensitive to local magnetic correlations Trotzky2010 ; Baur2010 for studying the approach to magnetic ordering of fermions close to the transition point is missing so far.
In this Letter we demonstrate a simple method for probing the nearest-neighbor correlations of strongly interacting repulsive fermionic gases in optical lattices. The correlation function is given by
| (1) |
where , are opposite spins and adjacent sites. This probe determines the probability of finding singly occupied neighboring sites with opposite spins.
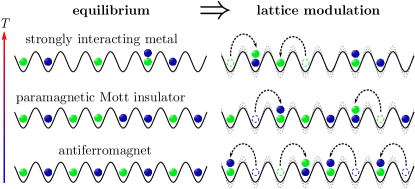
The experimental strategy for detecting the correlator relies on exciting the system by a periodic modulation of the lattice depth Stoferle2004 . The corresponding modulation in kinetic energy leads to tunneling of particles to adjacent sites. If two particles of opposite spin are located on neighboring sites, additional double occupancies (doublons) are created as shown in Fig. 1. The resulting doublon production rate is sensitive on the nearest-neighbor density and spin correlator . In the following we describe and characterize this experimental method and show that in the perturbative regime the frequency integrated doublon production rate is given by Kollath2006 ; Huber2009 ; Sensarma2009 ; Hassler2009 . We then use this technique to measure nearest-neighbor correlations as a function of temperature covering the regime from a paramagnetic Mott insulator to a strongly interacting metallic state. The results are in good agreement with the predictions of an ab initio theory without any fitting parameters.
The experimental sequence used to produce a quantum degenerate Fermi gas has been described in detail in previous work Strohmaier2010 ; Jordens2010 . In brief, a balanced spin mixture of atoms in the and magnetic sublevels of the hyperfine manifold is evaporatively cooled in an optical dipole trap. For samples of atoms we reach temperatures as low as of the Fermi temperature . Subsequently we ramp up a three-dimensional optical lattice of simple cubic geometry and lattice constant . The lattice depth is increased in to final values of or , where is the recoil energy, is Planck’s constant and denotes the mass of . The hopping is inferred from Wannier functions Jaksch1998 and the on-site interaction energy is obtained from lattice modulation spectroscopy Jordens2008 . The underlying trapping potential has a mean frequency of for and for . With this procedure we create samples where the core is in the Mott insulating regime Jordens2010 .
After this preparation, the lattice depth is modulated by along all three axes in time according to . This results in a modulation of both the hopping and the on-site interaction with amplitudes and respectively, creating additional doubly occupied sites as compared to the initial state. The increase in the number of doublons is maximal when the modulation frequency coincides with the doublon energy (resonant excitation at ). After the lattice modulation, the fraction of atoms on doubly occupied sites is measured by mapping doublons into a different spin state, subsequent Stern-Gerlach separation and absorption imaging Jordens2008 .
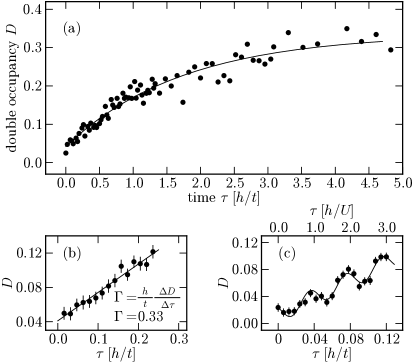
Fig. 2 (a) shows the evolution of double occupancy as a function of lattice modulation time for resonant excitation. After a steep initial rise, we observe a saturation of the induced double occupancy on a timescale on the order of the tunneling time . The saturation value depends only weakly on the modulation strength and reaches typical values of . In contrast to previous work, where only this saturation regime was considered Jordens2008 ; Strohmaier2010 , our high accuracy in the determination of double occupancy allows us to perform measurements in the weak excitation limit. Here we find that double occupancy increases linearly with time as shown in Fig. 2(b). We extract the normalized doublon production rate from the slope of a linear fit to the data
| (2) |
On shorter timescales an underlying oscillatory response at the modulation frequency is observed, Fig. 2(c).
The experiment can be well understood in the framework of time-dependent perturbation theory, which we outline below. The main result is that the frequency integrated doublon production rate is proportional to the nearest-neighbor correlator . The Hamiltonian of the system can be written as , where is the Fermi-Hubbard Hamiltonian and the time-dependent perturbation is given by . Assuming that the doublon production rate is equivalent to the total energy absorption rate (which becomes exact at half-filling and ), the perturbation in can be mapped to an increased tunneling perturbation with amplitude Reischl2005 . The response of the system to second order in perturbation theory is then given by
| (3) | |||||
in good agreement with the experimental observations of Fig. 2 (b),(c) using . The susceptibilities and correspond to the linear response and the non-oscillatory part of the quadratic response respectively. This is recovered by Fermi’s Golden Rule
Here and denote the unperturbed and excited states of , is their energy difference and counts the number of additionally created doublons Huber2009 . Evaluating all contributing matrix elements in the limit , the sum over all excited states is then equal to . To compare with experiments we consider the normalized frequency integrated response
| (4) |
where is the system averaged correlator and the connectivity of the lattice. In the perturbative regime therefore gives direct access to the nearest-neighbor correlator of the unperturbed initial state.
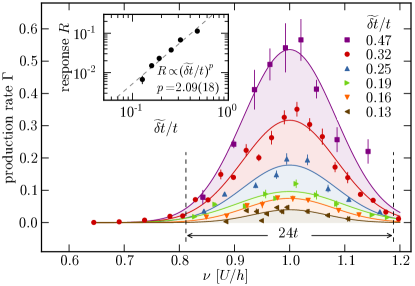
We validate that the experiments are performed in the weak excitation regime by studying the scaling of with the relative modulation amplitude 111We use , which is accurate to a few percent for the lattice depths used in the experiment.. We measure the doublon production rate as a function of the modulation frequency, from which the modulation spectra in Fig. 3 are obtained. The frequency integrated response is then determined by a gaussian fit to each spectrum. The result is plotted as a function of the lattice modulation amplitude (inset of Fig. 3). We find a scaling exponent of , in very good agreement with the expected value of predicted by second order perturbation theory. We can thus infer the nearest-neighbor correlator from the frequency integrated response.
Further information can be obtained from the lineshape of the modulation spectra, which reveals the density of states of the excitations. At half filling and temperatures well above the Néel transition, the density of states has an approximately triangular shape of full width Sensarma2009 . However, the trapping potential is expected to broaden the spectrum and introduce deviations to the lineshape Kollath2006 . This is consistent with the experimental data, which is well captured by gaussian fits with diameters of . The doublon production rate on resonance shows the same scaling behavior as the integrated response , with a scaling exponent of . This allows us to determine from the resonant doublon production rate alone assuming a gaussian density of states as in Fig. 3 222We have verified this assumption by inferring the value of the nearest-neighbor correlator from the inset of Fig. 3, which is in good agreement with the model..
We now use doublon production rate measurements to determine the nearest-neighbor correlator as a function of entropy for . We prepare samples with different entropies per particle by adding a variable waiting time in the optical dipole trap of up to , which results in heating due to inelastic scattering processes. The entropy per particle before loading into the lattice is inferred from Fermi fits to the momentum distribution of the cloud after expansion. This is a lower bound for the specific entropy in the lattice, as non-adiabatic processes take place during the loading. An upper bound is given by the entropy measured after reversing the loading procedure.
The nearest-neighbor correlator rapidly decreases with increasing entropy, as shown in Fig. 4(a). This behavior has a simple physical interpretation: in a harmonically trapped lattice system higher temperatures lead to an increased cloud size, which results in a large number of empty sites. The probability of finding two neighboring singly occupied sites is therefore strongly reduced. This qualitative picture is confirmed by ab initio calculations of the nearest-neighbor correlator. We use a high temperature series expansion (HTSE) up to second order in , where is the Boltzmann constant tenHaaf1992 ; Henderson1992 . Due to the harmonic confinement, the trap averaged correlator needs to be evaluated. This is done using a local density approximation, which is an excellent assumption in this temperature regime Scarola2009 . The system parameters are calibrated by independent methods Jordens2010 . The results of this calculation are shown in Fig. 4(a).
We find quantitative agreement between the measured nearest-neighbor correlator and the theoretical predictions without any fitting parameters. The theoretical entropies corresponding to the measured values of lie in between the lower and upper experimental bounds and . Nearest-neighbor correlation measurements thus allow us to determine entropy and temperature in the lattice for regimes where theory is still reliable and a quantitative comparison is possible. In contrast to thermometry in the optical dipole trap, the correlator is a direct observable in the lattice and does not rely on adiabaticity assumptions during the loading procedure. A comparison of these two methods suggests increased heating during the loading of the lattice for colder initial temperatures.
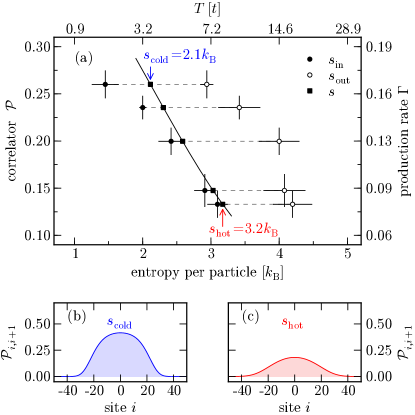
Further insight can be obtained from the theoretical model by investigating the spatial distribution of the nearest-neighbor correlator over the trap. From the inferred entropies we calculate the profiles shown in Fig. 4(b) and (c) for the parameters of our system 333The local value of the nearest-neighbor correlator is obtained by combining the HTSE result with a local density approximation. The average over all sites then yields the values of shown in Fig. 4(a).. At half filling and deep in the Mott insulating regime is expected to be close to , whereas thermal excitations reduce this number in the metallic phase. This is confirmed by the values in the core of the system, with for the coldest and for the hottest point. The decrease in thus signals the transition from a paramagnetic Mott insulator to a strongly interacting metal. As the onset of local spin correlations corresponds to an increase of above , nearest-neighbor correlation measurements are a promising tool for studying the approach to the antiferromagnetic phase Fuchs2010 .
In conclusion, we have measured nearest-neighbor correlations of ultracold fermions in optical lattices by determining the response of the system to a weak lattice modulation. This observable is well suited for thermometry in the lattice and can be used to explore novel cooling schemes Bernier2009 . The technique opens new prospects for studying the approach to the antiferromagnetic phase, since the regime between a paramagnetic Mott insulator and an antiferromagnet is governed by the formation of short-range magnetic correlations. In the future, nearest-neighbor correlation measurements might give insight into resonating valence bond ground states, where singlet correlations on neighboring sites are expected to occur in the absence of long range ordering Anderson1987 .
We are grateful to N. Strohmaier and H. Moritz for contributions in the early stages of the experiment, and to G. Jotzu for a critical reading of the manuscript. We thank M. A. Cazalilla, E. Demler, T. Giamarchi, F. Hassler, A. Ho, S. Huber, C. Kollath, D. Pekker, L. Pollet, A. Rüegg, R. Sensarma and A. Tokuno for insightful discussions, and SNF, NCCR-MaNEP, NAME-QUAM (EU, FET open) and SQMS (ERC advanced grant) for funding.
References
- (1)
- (2) I. Bloch, J. Dalibard and W. Zwerger, Rev. Mod. Phys. 80, 885 (2008).
- (3) T. Esslinger, Ann. Rev. Cond. Mat. Phys. 1, 129 (2010).
- (4) R. Jördens et al., Nature (London) 455, 204 (2008).
- (5) U. Schneider et al., Science 322, 1520 (2008).
- (6) E. Altman, E. Demler and M. Lukin, Phys. Rev. A. 70, 013603 (2004).
- (7) T. A. Corcovilos et al., Phys. Rev. A. 81, 013415 (2010).
- (8) S. K. Baur and E. J. Mueller, Phys. Rev. A 82, 023626 (2010).
- (9) S. Trotzky et al., Phys. Rev. Lett. 105, 265303 (2010).
- (10) T. Stöferle et al., Phys. Rev. Lett. 92, 130403 (2004).
- (11) C. Kollath et al., Phys. Rev. A 74, 041604 (2006).
- (12) S. D. Huber and A. Rüegg, Phys. Rev. Lett. 102, 065301 (2009).
- (13) R. Sensarma et al., Phys. Rev. Lett. 103, 035303 (2009).
- (14) F. Hassler and S. D. Huber, Phys. Rev. A 79, 021607 (2009).
- (15) N. Strohmaier et al., Phys. Rev. Lett. 104, 080401 (2010).
- (16) R. Jördens et al., Phys. Rev. Lett. 104, 180401 (2010).
- (17) D. Jaksch et al., Phys. Rev. Lett. 81, 3108 (1998).
- (18) A. Reischl, K. P. Schmidt and G. S. Uhrig, Phys. Rev. A 72, 063609 (2005).
- (19) D. F. B. ten Haaf and J. M. J. van Leeuwen, Phys. Rev. B 46, 6313 (1992).
- (20) J. A. Henderson, J. Oitmaa and M. C. B. Ashley, Phys. Rev. B 46, 6328 (1992).
- (21) V. W. Scarola et al., Phys. Rev. Lett. 102, 135302 (2009).
- (22) J. S. Bernier et al., Phys. Rev. A 79, 06160 (2009).
- (23) S. Fuchs et al., Phys. Rev. Lett. 106, 030401 (2011).
- (24) P. W. Anderson, Science 235, 1196 (1987).