Identified particle production in inelastic events with the ATLAS detector
Moscow State University - Scobeltsyn Institute of Nuclear Physics
1(2), Leninskie gory, GSP-1, Moscow 119991 - Russia
E-mail
On behalf of the ATLAS Collaboration.
Abstract:
Various strange and charmed hadrons were reconstructed
with the ATLAS detector in collisions at TeV.
The data sample was collected in March-May of 2010 using
a minimum-bias trigger.
The and kinematic distributions were
studied using data corresponding to
an integrated luminosity of b-1.
The and baryons
were reconstructed in their cascade decays
in data corresponding to
an integrated luminosity of b-1.
The , and
charmed mesons
were reconstructed in
the range of transverse momentum GeV
and pseudorapidity
in data corresponding to
an integrated luminosity of nb-1.
The fitted mass values were found to be in agreement
with their world averages
while the observed invariant mass resolutions agree with
Monte Carlo expectations.
This study confirms the high performance of the ATLAS detector
for precision tracking measurements.
1 Introduction
The reconstruction of identified particles
containing strange and charm quarks is already feasible
with first LHC data
due to the large expected cross sections and clean particle signatures.
A study of decays
with the ATLAS detector [1]
in GeV collision data has been reported
earlier [2, 3].
The particle identification
was used to select charged kaons in that analysis.
Results on identified strange and charmed particles production
in collisions at TeV are presented in this note.
The data used in this analysis were collected between March and May, 2010.
Events selected with a minimum-bias trigger and with a reconstructed
primary vertex were kept for particle reconstruction.
The particle identification
was not used.
Non-diffractive minimum-bias Monte Carlo (MC) was used to tune
the selection criteria and to make comparisons with data.
2 Strange Particle Production
The decays ,
and
were reconstructed by fitting pairs of tracks
to a secondary vertex in data corresponding to
an integrated luminosity of b-1 [4].
Only tracks with transverse momentum MeV were used.
The transverse distance between the secondary and primary vertices
was required to be at least mm for candidates, while
the minimal there-dimensional distance of mm was required
for and candidates.
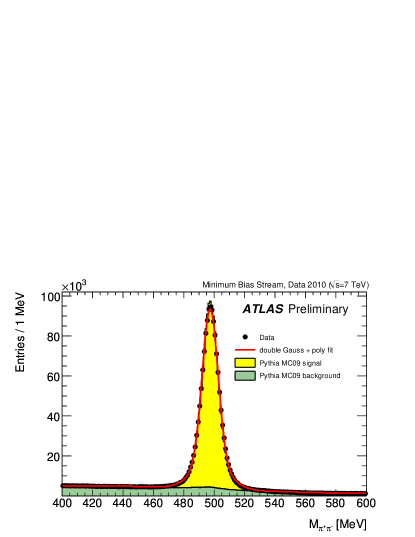
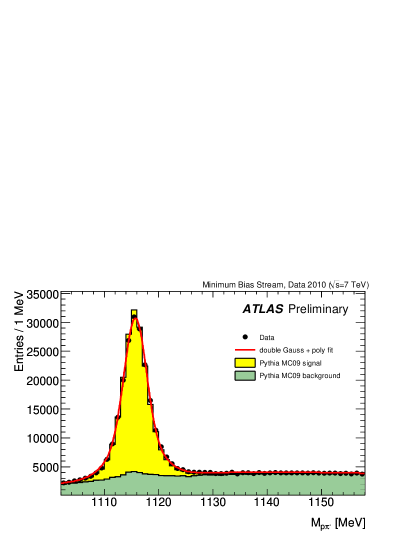
The distributions of the invariant mass of the and
candidates in data and MC simulation are shown in Fig. 1.
The signal positions and widths are consistent with the MC expectations
and with the world average mass values [5].
Distributions of pseudorapidity and azimuthal angle
for the reconstructed , and candidates
are described reasonably well by the MC simulation,
while the MC has a greater fraction of candidates
at higher values of the candidate transverse momentum [4].
Figure 1: The distribution for candidates (left plot)
and for candidates (right plot).
The points are data, while the histograms show the MC simulation.
The solid curves represent fit results.
The fitted masses (widths) are
MeV (MeV) and MeV (MeV)
for the and signals, respectively.
The fit uncertainties on the mass values are statistical only.
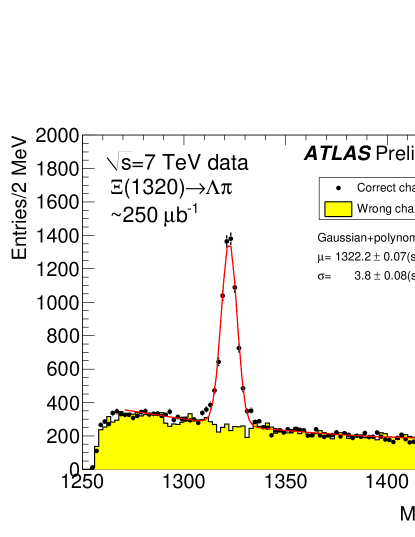
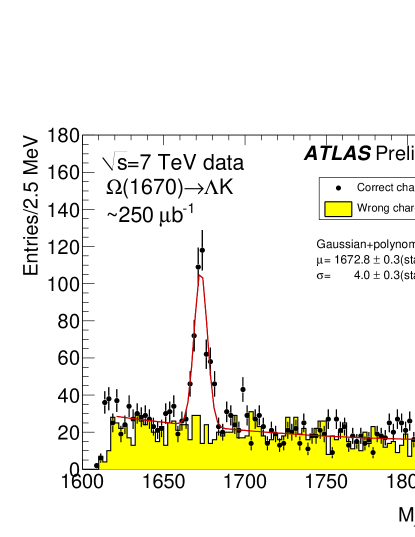
The cascade decays
and with
(+ c.c.)
were reconstructed by fitting
secondary and tertiary vertices
in data corresponding to
an integrated luminosity of b-1 [6].
The additional track for the first cascade vertex
was required to have transverse momentum above MeV
for candidates and above MeV
for candidates.
The transverse distance between the first cascade vertex and primary vertex
was required to be at least mm for the candidates
and at least mm for the candidates.
The distributions of the invariant mass of the and
candidates in data and MC simulation are shown in Fig. 2.
The signal positions and widths are consistent with the MC expectations
and with the world average mass values [5].
Figure 2: The distribution for candidates (left plot)
and for candidates (right plot).
The histograms show the distributions for wrong-charge combinations.
The solid curves represent fit results.
3 Charmed Particle Production
The , and
charmed mesons
were reconstructed in
the range of transverse momentum GeV
and pseudorapidity
in data corresponding to
an integrated luminosity of nb-1 [7].
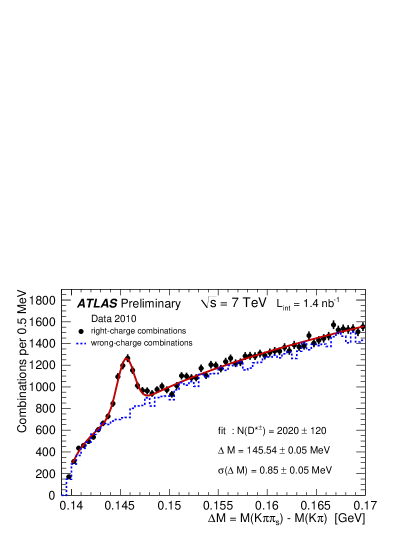
The mesons were identified using the decay channel
,
where the pion from the decay is referred to as
the “soft” pion, .
The transverse decay length of the candidates was required
to satisfy .
The left plot in Fig. 3 shows
the mass difference, ,
distribution for the
candidates
which satisfy GeV,
while the right plot in Fig. 3 shows
the distribution
for the
candidates
which satisfy MeV.
The fitted yield was
.
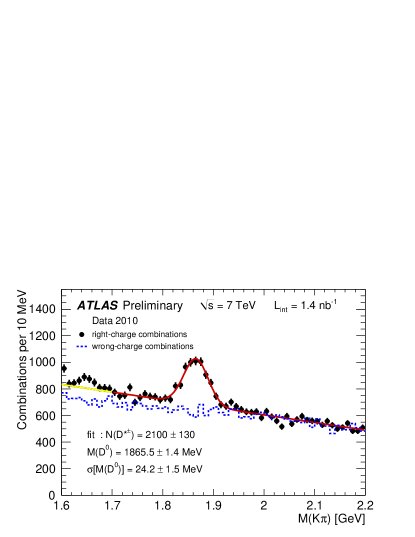
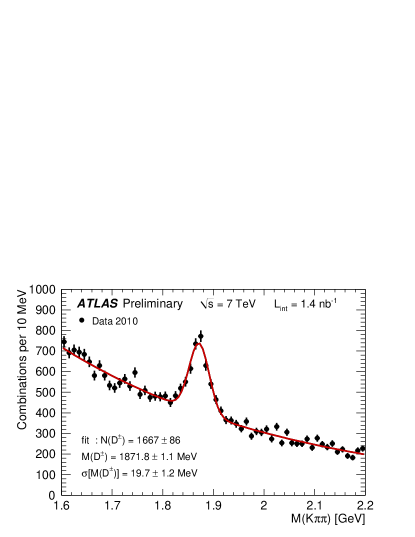
The mesons were reconstructed
from the decay
,
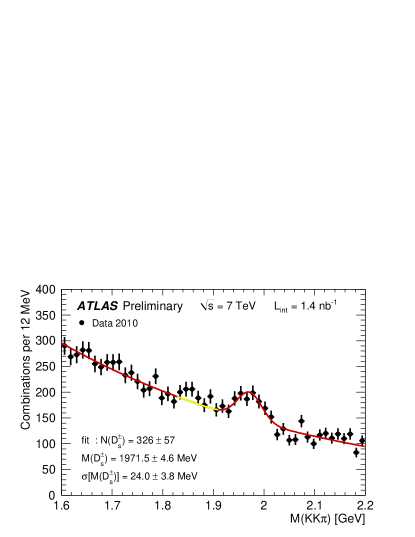
and mesons were reconstructed
from the decay
with .
The transverse decay lengths of the and candidates
were required
to be above mm and mm, respectively.
For candidates, the invariant mass was required to be
within MeV of the mass.
The distribution
for the candidates
and the distribution
for the candidates
are shown in Fig. 4.
The fitted yields were
and .
Figure 3:
The distribution of the mass difference,
, (left plot)
and the distribution (right plot)
for the candidates (points).
The dashed histograms
show the distributions for wrong-charge combinations.
The solid curves represent fit results.
The fitted masses of the reconstructed charmed mesons
were found to be in agreement
with their world averages [5]
while the observed invariant mass resolutions agree with MC
expectations.
Figure 4:
The distribution
for the candidates (left plot)
and the distribution
for the candidates (right plot).
The solid curves represent fit results.
References
[1]
The ATLAS Collaboration,
The ATLAS experiment at the CERN Large Hadron Collider,
JINST3 (2008) S08003.
[2]
The ATLAS Collaboration,
-meson production in GeV collision data,
ATLAS-CONF-2010-023,
http://cdsweb.cern.ch/record/1277655.
[3]
The ATLAS Collaboration,
Performance of the ATLAS Detector using First Collision Data,
JHEP09 (2010) 056.
[4]
The ATLAS Collaboration,
Kinematic Distributions of and decays in collision data at TeV,
ATLAS-CONF-2010-033,
http://cdsweb.cern.ch/record/1277668.
[5]
K. Nakamura et al., (Particle Data Group),
The Review of Particle Physics,
J. Phys.G37 (2010) 075021.
[6]
The ATLAS Collaboration,
Observation of , baryons and meson production at TeV,
ATLAS-CONF-2010-032,
http://cdsweb.cern.ch/record/1277666.
[7]
The ATLAS Collaboration,
mesons reconstruction in collisions at TeV,
ATLAS-CONF-2010-034,
http://cdsweb.cern.ch/record/1277669.