UWISH2 – The UKIRT Widefield Infrared Survey for H2
Abstract
We present the goals and preliminary results of an unbiased, near-infrared, narrow-band imaging survey of the First Galactic Quadrant (10∘ 65∘ ; ∘ +1.3∘). This area includes most of the Giant Molecular Clouds and massive star forming regions in the northern hemisphere. The survey is centred on the 1-0 S(1) ro-vibrational line of H2, a proven tracer of hot, dense molecular gas in star-forming regions, around evolved stars, and in supernova remnants. The observations complement existing and upcoming photometric surveys (Spitzer-GLIMPSE, UKIDSS-GPS, JCMT-JPS, AKARI, Herschel Hi-GAL, etc.), though we probe a dynamically active component of star formation not covered by these broad-band surveys. Our narrow-band survey is currently more than 60 % complete. The median seeing in our images is 0.73. The images have a 5 detection limit of point sources of K18 mag and the surface brightness limit is 10-19 W m-2 arcsec-2 when averaged over our typical seeing. Jets and outflows from both low and high mass Young Stellar Objects are revealed, as are new Planetary Nebulae and - via a comparison with earlier K-band observations acquired as part of the UKIDSS GPS - numerous variable stars. With their superior spatial resolution, the UWISH2 data also have the potential to reveal the true nature of many of the Extended Green Objects found in the GLIMPSE survey.
keywords:
stars: formation – infrared: stars – ISM: jets and outflows – ISM: kinematics and dynamics – ISM: individual: Galactic Plane1 Introduction
Feedback from star formation, particularly massive star formation, has a radical impact on the nature of the interstellar medium (ISM) in galaxies. Outflows from protostars and radiated energy from high-mass young stars heat, excite, modify the chemistry of and may provide the turbulent motions in Giant Molecular Clouds (GMCs). Ultimately, massive stars also enhance metal abundances in the ISM. Understanding the formation of stars, particularly massive stars, is thus of crucial importance.
To help us better understand the dynamical processes associated with massive star formation, but also to search for other line-emitters (Supernova remnants, Planetary nebulae, etc.) along the Milky Way, we are conducting an unbiased survey of the Spitzer Space Telescope GLIMPSE-North portion of the Galactic Plane in H2 1-0 S(1) emission at 2.122 m. H2 observations highlight regions of shocked or fluorescently excited molecular gas (T 2000 K, n 103 cm-3) and thus trace outflows and jets from embedded young stars, but also the radiatively excited boundary regions between massive stars and the ISM.
Our unique survey – dubbed the UKIRT Wide Field Infrared Survey for H2 or UWISH2 – complements the existing UKIRT Infrared Deep Sky Survey (UKIDSS) of the Galactic Plane (the UKIDSS GPS; Lawrence et al. [2007], Lucas et al. [2008]), as well as the Isaac Newton Telescope Photometric H Survey (IPHAS: Drew et al. [2005]), the Herschel Infrared Galactic Plane Survey (Hi-GAL: Molinari et al. [2010]), the planned James Clerk Maxwell Telescope Submillimeter Common User Bolometer Array-2 (SCUBA-2) Galactic Plane Survey (the JPS), the Very Large Array 5 GHz ”CORNISH” survey (Purcell et al. [2008]), the AKARI mid-infrared all sky survey (Ishihara et al. [2010]), and of course the mid-infrared GLIMPSE survey with Spitzer (Benjamin et al. [2003], Churchwell et al. [2006]) as well as the MIPSGAL survey (Carey et al. [2009]). Other surveys which are covering a large fraction of our field are the Bolocam Northern Galactic Plane Survey at 1.1 mm (BGPS, Rosolowsky et al. [2010], Aguirre et al. [2010]), the APEX Telescope Large Area Survey of the Galaxy at 870 m (ATLASGAL, Schuller et al. [2009]), the Millimetre Astronomy Legacy Team 90 GHz Survey (MALT 90), the Galactic Ring Survey (GRS, Jackson et al. [2006]) and the Methanol Multibeam Survey (MMB, Green et al. [2007]).
Together the GLIMPSE, UKIDSS-GPS, JPS, Hi-GAL, CORNISH and other surveys provide a near-complete census of star formation, detecting cool, pre-stellar cores, hot cores, low and high-mass protostars (Class 0/I), pre-main sequence objects (Class II/III – T Tauri and Herbig Ae/Be stars) and HII regions associated with intermediate and high-mass young stars. The longer wavelength surveys will also map the associated dust distribution. Outflows from low and high-mass protostars, as well as HII regions, Photo-Dissociation Regions (PDRs), post-Asymptotic Giant Branch (post-AGB) stars and planetary nebulae (PN) are detectable by the UWISH2 survey and, in many cases, are resolved out to distances of at least 5 kpc.
2 Target Area
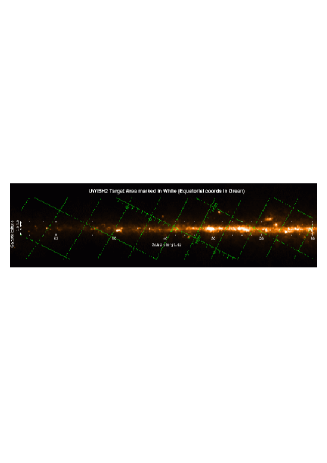
We have selected a region within the Galactic Plane, known as the First Galactic Quadrant, that has already largely been mapped by WFCAM through broad-band J, H, and K filters as part of the UKIDSS GPS survey (see Sect. 3 for details), and by Spitzer with the IRAC camera at 3.6, 4.5, 5.8, and 8.0 m as part of the GLIMPSE survey. Specifically we are mapping a region that covers 10∘ 65∘ and 1.3∘ +1.3∘ (left panel of Fig. 1). This field includes GMCs associated with the distant Scutum and 4 kpc spiral arms of the Galaxy that comprise the northern portion of the Molecular Ring (Dame et al. [2001]). The region also includes many well-known massive star forming regions (W 33, W 51, etc.), supernova remnants (W 44, W 49B, etc. - sites of triggered star formation) and galactic clusters (e.g. M 16, M 17, etc.), as well as a large number of clouds within 1 kpc of the Sun, with radial velocities 20 km/s (Dame & Thaddeus [1985]). The latitude range also includes the vast majority of the molecular and atomic gas. All of the northern massive star forming GMCs with masses of 104 to 106 M⊙ are covered by the longitude range of our survey (Dame & Thaddeus [1985]). It includes the Galactic Ring at a galactocentric radius of 5 kpc, where star formation is particularly intense. Indeed, the scale-height for OB stars in our Galaxy is of the order of 30 – 50 pc (Reed [2000], Elias et al. [2006]). This is a clear indication that much of the massive star formation occurs within the latitude range of our survey.
An unbiased survey was preferred over a survey which targets specific regions based on, e.g. low-resolution CO maps or galactic radio surveys, for a number of reasons. An unbiased survey, by its very nature, provides more reliable statistics for a sizeable portion of the Galactic Plane. Also, the UWISH2 survey not only addresses star formation, but also evolved stars; the latter will not necessarily be associated with massive molecular clouds or bright radio sources. Thirdly, given the abundance of high and low mass cores along the Galactic Plane, we assumed that most regions in the survey would contain emission-line sources. This assumption was to some extent based on preliminary WFCAM JHK and H2 observations of a region that included the well-known high-mass star forming regions DR 21 and W 75 N (Davis et al. [2007]; Kumar et al. [2007]). In this area ( = 81.7∘, = +0.5∘; d = 2-3 kpc), jets, outflows, PDRs and young clusters were identified in separate regions: in the main DR 21 and W 75 N high mass cores, but also along the western periphery of the W 75 N core (100 west of W 75 N) and towards a newly-discovered low mass cloud, dubbed L 906 E, 200 west of DR 21. These latter regions would not necessarily show up as major features in low resolution dust continuum, radio or CO surveys, and therefore could be missed in a pointed survey of GMCs.
Of course, there have been numerous other infrared imaging studies of low and high mass star forming regions which reveal an abundance of H2 line-emission features associated with jets and outflows from YSOs (e.g. Davis & Eislöffel [1995]; Miralles et al. [1997]; Hodapp & Davis [2002]; Walawender, Reipurth & Bally [2009]; Ginsburg et al. [2009]; Varricatt et al. [2010]; Buckle et al. [2011]). The GLIMPSE survey itself also hints at the existence of many extended line-emission objects at locations along the Galactic Plane. Dubbed Extended Green Objects (EGOs), the colour of these features may result from enhanced line emission in the 4.5 m Spitzer-IRAC band (Cyganowski et al. [2008], Stecklum et al. [2009]). These are often regarded as pure-rotational H2 which in these extended objects may be associated with outflows from young stars. However, there is growing evidence that the observed emission at least in some objects can be alternatively attributed to scattered continuum emission (e.g. Qiu et al. [2008]; De Buizer & Vacca [2010]; Chen et al. [2010]). Follow-up observations at higher resolution, like those presented in this paper, are needed to reveal the true nature of these objects.
3 Observations
The narrow-band images that constitute UWISH2 are being obtained with the Wide-Field Camera (WFCAM, Casali et al. [2007]) at the United Kingdom Infrared Telescope (UKIRT). The camera uses four Rockwell Hawaii-II (HgCdTe 2048 2048) arrays. The gaps between the four arrays are equivalent to 94 % of the width of an array. The arrays have a pixel scale of 0.4; a contiguous area covering 0.75 square degrees on the sky (a WFCAM tile) is imaged by observing at four discrete positions. In order to correct for image artifacts, bad pixels, and to fully sample the point spread function, a 2 2 micro-stepping pattern is repeated at three jitter positions. The jitter positions are offset by 6.4 (specifically 0,0; 6.4,0; 6.4,6.4); at each jitter position we microstep with offsets of 1.4 (N+1/2 pixels on the IR arrays and an integral number of autoguider pixels). This results in a pixel scale of 0.2 in the final stacked images. An exposure time of 60 s is employed; the total per-pixel integration time is thus 720 sec. The images are acquired through a narrow-band filter ( 0.021 m) centred on the 1-0 S(1) line of molecular hydrogen at 2.122 m.
All WFCAM data are reduced by the Cambridge Astronomical Survey Unit (CASU) and are distributed through a dedicated archive hosted by the Wide Field Astronomy Unit (WFAU) in Edinburgh, U.K.. The CASU reduction steps are described in detail by Dye et al. [2006]; astrometric and photometric calibrations (Hodgkin et al. [2009]) are achieved using 2MASS (Skrutskie et al. [2006], Dye et al. [2006]; Hewett et al. [2006]). Data are then downloaded in bulk from WFAU and are made available (initially only to members of the UWISH2 consortium) via a dedicated web-site111http://astro.kent.ac.uk/uwish2/. However, all data are available directly from WFAU, and are made publicly available without restriction 18 months after they are acquired. The same applies to data access via our dedicated web-site.
In order to continuum subtract our narrow band H2 images we use the K-band data obtained as part of the UKIDSS GPS (Lucas et al. [2008]). The H2 and K-band images are aligned using the astrometric calibration parameters stored in the file headers and scaled to the same size. The flux scaling between H2 and K-band is done for each star individually. We then determine a map of the median flux scaling factor with a resolution of 1′. This is required since the scaling factor between H2 and K-band changes for regions with high extinction. To subtract the continuum as accurately as possible, i.e. getting the least amount of residuals for stars we also apply a Gaussian smoothing to the image with the better seeing to ensure the same full width half maximum in both images before continuum subtraction. Naturally, this process leads to ’negative bowl’ effects, which can be used to identify K-band reflection nebulae. The continuum subtracted H2 images will be made available on our dedicated web-site. Please note, that we have used these images only for the identification of line-emission sources. They should not be used for photometry.
To facilitate and simplify the continuum subtraction, we have tiled our survey field in exactly the same way as the GPS. Due to the inclination of the Galactic to the Equatorial Plane, at least four tiles are required to ensure that all regions with 1∘ are completely covered. Thus, our survey (once completed) will cover a somewhat larger area, with 1.35∘; in some regions we will reach as far as 1.7∘ or 1.8∘. Hence, an area of approximately 172.5 square degrees in total will be imaged.
4 Results
4.1 Survey Completeness
The survey was originally awarded 222 hrs of observing time spread over four semesters (2009B, 2010A, 2010B and 2011A). Survey observations began on 28 July 2009 and progressed rapidly. As of September 2010 we have obtained data for 141 tiles. To image the entire envisaged survey area we have prepared 224 tile observations. Hence, the survey is currently 62.9 % complete. For the first three semesters we have achieved an efficiency of 83.9 %. The time lost (16.1 % of the total) can be attributed to technical difficulties and a run of bad weather in semester 2009B. The efficiency of the observations in 2010A and 2010B has been very close to 100 %.
The prospects for completion of the survey are somewhat unclear, owing to the uncertain future of UKIRT. Hence, there will be no scheduled observations for our project in Semester 2011A. However, members of the survey team are currently campaigning to use this project as bad-weather filler for the UKIDSS surveys. Furthermore, we will obtain more data next summer via UH time access to the telescope.
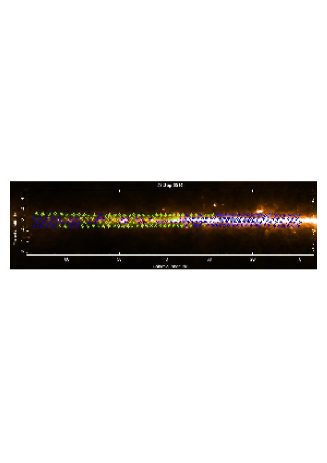
The area covered so far is displayed in the right hand panel of Fig. 1. Our initial goal was to observe a contiguous area at low galactic longitudes (regions with low and negative Declinations), focusing also on the Galactic mid-Plane. However, the inner galaxy sets an hour or so before regions at higher , so some tiles have been observed further out along the Galactic Plane, and at higher latitudes. Even so, we have managed to observe a contiguous area that covers 10∘ – 28∘ across the entire width of the survey. Moreover, we have covered the entire Galactic mid-Plane ( 0.5∘) between 10∘ and 37∘. Currently, out of the completed tiles, about two thirds (63.4 %) are in the Galactic mid-Plane. The region with the least amount of data taken so far is 37∘ 58∘. There, only about one quarter of the area has been observed. The remaining area up to 65∘ is approximately two-thirds complete.
4.2 Data Quality
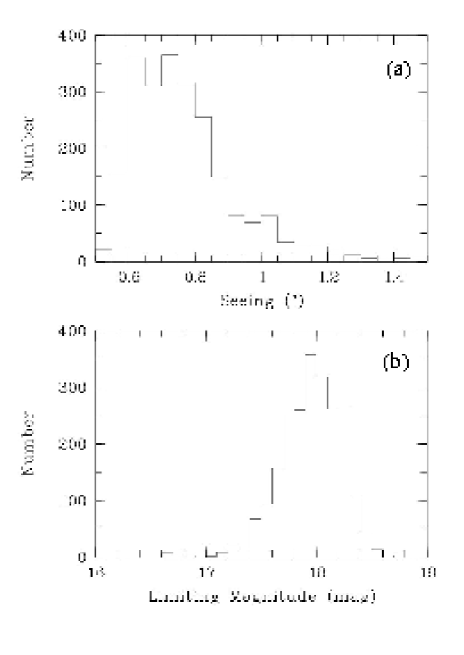
Since the main goal of the survey was to obtain a catalogue of all H2 emission line features, most of which are expected to be extended, the original seeing limitations set for the UWISH2 survey were quite relaxed (less than 1.5). However, this goal has been significantly surpassed for the vast majority of our observed fields. The seeing statistics measured from the 141 tiles observed to date are displayed as a histogram in the top panel of Fig. 2. As one can see, the majority of the data have a seeing between 0.6 and 0.8 in the co-added frames (the median seeing is 0.73). Indeed 90 % of the images have a seeing better than 1.0. In some frames the seeing is as low as 0.51, and only one image has a measured seeing above the original project limit of 1.5.
The astrometric solution of our images has the same precision as the UKIDSS GPS data, i.e. 0.09 (Lucas et al. [2008]). Note that the seeing might introduce variations to this number. We refrain from evaluating the accuracy of the position determination of H2 features, since this depends strongly on the brightness, the signal to noise, and the ’shape’ of the features. It is hence impossible to derive a general value for the position accuracy of H2-knots.
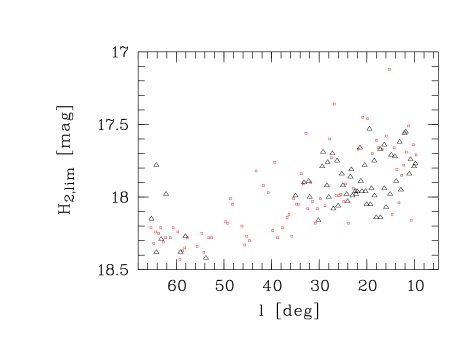
The limiting magnitude (5 detection limit) in the H2 narrow band filter ranges mostly between 17.6 mag and 18.3 mag (bottom panel in Fig. 2). The limiting magnitude in each image is generally not a result of the sky quality (the vast majority of the data was taken under photometric conditions), but rather is caused by crowding along the Galactic Plane. This is nicely illustrated by the apparent correlation between the limiting magnitude in the images and their position (longitude) along the Galactic Plane (see Fig. 3). One can see in this figure that for fields more than about 40∘ or 50∘ from the Galactic Centre, the limiting factor is indeed the integration time, i.e. we reach a point source limit of 18.3 mag. For fields closer to the Galactic Centre a linear correlation between and the limiting magnitude is seen, caused by the increased crowding (confusion noise) in the images at these positions.
For the detection of H2 emission, which is usually extended, the surface brightness detection limit is of interest. We estimate a typical rms noise level in our H2 images of 3.4 10-19 W m-2 arcsec-2. We hence note that a source with a uniform surface brightness of 10-18 W m-2 arcsec-2 will be detected at a 3 level in our unbinned images (0.2 pixel scale). Assuming the H2 features are extended over several arcseconds, we estimate a 3 detection limit after re-binning our images to e.g. 1.2 (a typical resolution in GLIMPSE) of 1.7 10-19 W m-2 arcsec-2. Using the GLIMPSE 3 point source detection limit spread over the PSF (3.4 MJy str-1, Churchwell et al. [2009]) and a conversion from H2 flux at 4.5 m into the 1-0 S(1) flux for a range of typical conditions (Takami et al. [2010]) one finds that the GLIMPSE 3 detection limit corresponds to 5-40 10-17 W m-2 arcsec-2 in the 1-0 S(1) line of molecular hydrogen. Our survey is hence a factor of 300 to 2000 better than the corresponding GLIMPSE detections of H2 in the 4.5 m filter. Thus, only for regions with a K-band extinction in excess of 6 mag, might GLIMPSE detect 4.5 m H2 emission not detectable in our data.
5 Discussion
5.1 Star Formation
Collectively, jets and outflows can be used as sign-posts of star formation (e.g. Bally et al. [1995]; Eislöffel [2000]; Froebrich & Scholz [2003]; Hodapp [2007]; Hatchell et al. [2007]; Davis et al. [2009]; Walawender et al. [2009]). An abundance of jets points to active accretion and a young population; a paucity of flows, in a region where near- and mid-IR photometry still point to a sizeable population of reddened sources, indicates a more evolved region with a larger population of pre-main-sequence stars (T-Tauri and Herbig Ae/Be stars). Indeed, one of the goals of this survey is to establish whether the large number of outflows seen in a massive star forming region like DR 21/W 75 (over 50 independent flows have been detected in a single WFCAM tile – Davis et al. [2007]), is common in other massive star forming regions. Since the dynamical age of a protostellar outflow is 10 to 100-times less than the turbulent lifetime of a GMC, an abundance of outflows in each region would point to ongoing or multiple epochs of star formation, rather than infrequent bursts of star formation in each GMC.
Since outflows are also a direct tracer of mass accretion and ejection they can be used to estimate star formation efficiency, particularly in high mass star forming regions where the efficiency is grossly affected by molecular cores and existing massive young stars, which influence the environment via their hugely energetic winds and intense UV fluxes. An unbiased survey like UWISH2 will map star formation efficiency from region to region, providing a reliable map of the distribution of dynamically active (showing signs of jets/outflows) star forming regions along the Galactic Plane.
Individually, jets and outflows can be used to pin-point the locations of protostars. Flows from Class 0 sources, for example, are typically 10-times brighter in H2 emission than their Class I counterparts (Caratti o Garatti et al. [2006]), while optically-visible Herbig-Haro jets from Class II sources are extremely faint in H2 emission, because of a lack of ambient molecular gas. Outflows from massive young stars are, on the other hand, rarely detected in the optical because of extinction. These flows are usually only seen in H2 emission (e.g. Varricatt et al. [2010]) and in millimeter-wave line maps and radio continuum images (Arce et al. [2007]). However, the spatial resolution of the longer wavelength observations is usually poorer. With outflow sources identified, the mass of the individual sources, derived from supporting multi-wavelength photometry (WFCAM-GPS, Spitzer, JCMT-GPS, VLA, etc.) and thus mass/luminosity estimates, can be measured. This sort of analysis will help to address the question of whether the most massive stars, which may not form through disk accretion, can generate collimated outflows. Because H2 flows are driven by the youngest sources, H2 observations can also break the protostar/T-Tauri star ambiguity in Spitzer-IRAC colour-colour analysis, where inclination effects grossly affect mid-IR colours and thereby hinder individual source classifications (Class 0/I or Class II; e.g. Allen et al. [2004]).
Jets are also powerful tracers of infall history, since jet parameters correlate closely with mass infall rates and accretion luminosities (Beck [2007], Antoniucci et al. [2008]). Tight clustering, interactions between protostellar neighbours, and particularly photo-evaporation and ablation of protostellar disks, can inhibit accretion and thereby switch off the engine that drives an outflow (they can also trigger accretion and cause FU-Ori type outbursts). This will be particularly important in massive star forming regions, where young stars form in clusters and where massive stars influence their lower-mass neighbours through gravitational, radiative and mechanical (outflow) interactions. Estimates of the frequency of jet activity in clustered environments, provided by UWISH2, will lead to an assessment of the degree to which interaction inhibits accretion.
Statistical studies of jets can also shed light on the dynamics of cloud collapse and star formation in GMCs. Are outflows randomly orientated, or are they aligned perpendicular to cloud filaments though parallel to magnetic field lines (Eislöffel et al. [1994], Banerjee & Pudritz [2006])? Existing observations yield contrasting results (e.g. Anathpindika & Whitworth [2008]; Davis et al. [2009]); clearly, a large, statistically-significant sample of flows, with complementary observations of cloud and magnetic field structures, is required to resolve this issue. The structure of the underlying magnetic field is intricately linked to the fragmentation process of filamentary clouds (e.g. Fiege & Pudritz [2000], Falgarone et al. [2001]), and consequently to outflow orientation. The outflow sample obtained by our survey will be an outstanding and unique opportunity to perform this analysis. We expect that the majority of outflow sources will be at distances of 1 – 3 kpc. The Galactic Plane magnetic field structure within 2 or 3 kpc is revealed by stellar polarization surveys (e.g. Heiles [2000]) and out to larger distances by other techniques such as Faraday rotation of pulsars and extra-galactic radio sources (e.g. Han [2009]). Recently the relation of outflow direction and magnetic field structure has been investigated in individual clouds (e.g. in DR 21 by Kirby [2009]). When such magnetic field studies become available for other regions, the UWISH2 data will be helpful to support or negate the relative orientation of outflows with magnetic fields, thus constraining an important aspect of star formation.
There are of course many other outflow parameters that can be measured in a large infrared study: What fraction are collimated, and what fraction are parsec-scale in length? Does the mean flow length correlate with the median age of the embedded population, derived from colour analysis or the mean mid-IR spectral index measured from Spitzer-IRAC photometry? Are outflows from massive stars better aligned (e.g. orthogonal to cloud filaments and/or large-scale magnetic fields) than their less powerful, lower-mass counterparts? And can outflows account for the turbulent motions in GMCs; are they energetic enough and sufficient in numbers, and what is the relative role of massive YSO flows and low-mass YSO outflows? Our goal is to address many of these issues in future analysis of UWISH2 data.
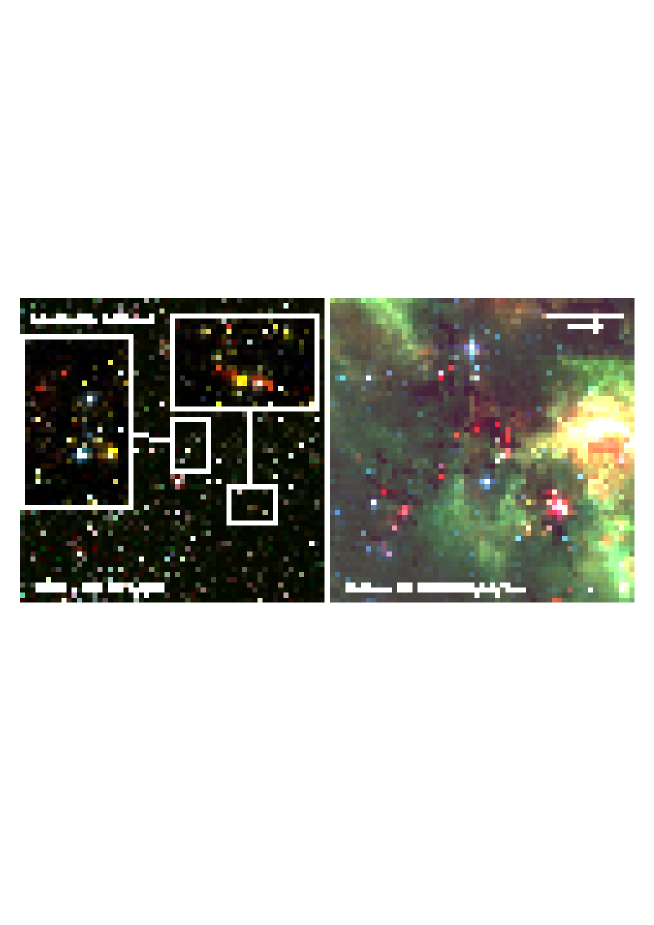
Examples of two rather different star forming regions are shown in Figs. 4 and 5. The GLIMPSE+MIPSGAL Spitzer data presented in the former reveal a remarkable Infra-Red Dark Cloud (IRDC), along which there appears to be a number of reddened mid-IR sources. IRDCs seen in silhouette against the bright Galactic background in the mid-IR are believed to be the precursors to massive stars and star clusters, but individual IRDCs show diverse star forming activities within them (Henning et al. [2010]). The IRDC at presented in Fig. 4 is an intriguing example of such clouds. It is associated with a long, filamentary CO cloud at 2 kpc distance that extends to the north-east, beyond the boundary of the figure, in the Galactic Ring Survey data of 13CO = 1 – 0 emission (Jackson et al. [2006]). Thus, the total extent of the IRDC reaches pc. This IRDC was partially identified as three separate, arcmin-size clouds by Simon et al. [2006a] in their catalog of MSX IRDC candidates. One of these is associated with the most impressive outflow in Fig. 4 in the south-western area. Each cloud has an estimated mass of 100 – 500 and is composed of several compact millimeter-continuum cores (Rathborne et al. [2006], Simon et al. [2006b] Butler & Tan [2009]). In Fig. 4, the complementary UWISH2+GPS data reveal ubiquitous outflows along the IRDC. Detailed analysis of this field is reserved for a future paper (Kim et al. in preparation). However, the fact that some of the reddened mid-IR sources have associated outflows while some do not indicates that the IRDC is a site of active star formation with YSOs in various evolutionary stages.
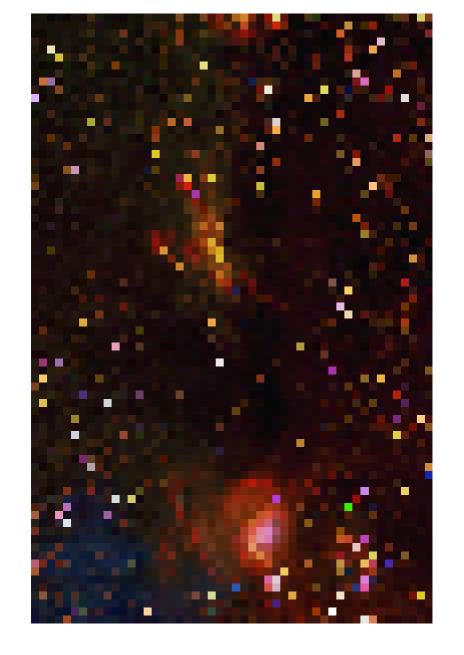
Figure 5 shows the JKH2 colour-composite of the area containing the high-mass star forming region G 35.2 N, the young cluster Mercer 14 and an HII region. The massive molecular outflow previously observed in CO and radio by Birks et al. [2006] and De Buizer [2006] is evident in bright H2 line emission. The area contains CO outflows (Dent et al. [1985]) as well as H2O, methanol and OH masers (Caswell et al. [1995]; Hutawarakorn & Cohen [1999]). Observations suggest that the outflows are driven by more than one source and that the distance to the complex is about 2 kpc (Brown et al. [1982]). 13CO data, taken as part of the RMS-survey by Urquhart et al. [2008] indicate a distance of 2.3 kpc. These authors also determine the bolometric luminosity of the source to be about 1.7 104 L⊙.
Using 2.3 kpc as the distance, we measure the length of both H2 outflows to be about 1.2 pc. The H2 flows lie on the same principle outflow axis as observed in the radio observations. The bright bow-shaped features, in particular in the north-eastern lobes, seem to form the terminal bow-shock of the flow interacting with the surrounding medium. The blue and redshifted lobes point to the north-east and south-west, respectively. This is in agreement with the strength of the H2 emission, which is higher for the blue-shifted part of the outflow. We measure a combined, de-reddened (assuming = 2 mag) 1-0 S(1) luminosity of about 1 L⊙. Assuming typical shock conditions, about 10 % of the entire H2 emission will be in the 1-0 S(1) line (Smith [1995], Caratti o Garatti et al. [2006]), but note that the cold component, traced by the 0 – 0 transitions might play a major role in the overall energy balance (Smith & Rosen [2005], Caratti o Garatti et al. [2008]). Hence, the total H2 luminosity is about 10 L⊙. This is in good agreement with the expected relation between source bolometric luminosity and outflow H2 luminosity for young Class 0 and Class 1 protostars (discussed e.g. in Caratti o Garatti et al. [2006]). Together with IRAS 20126+4104 (Caratti o Garatti et al. [2008]), this object is one of the few luminous young objects where the outflow has been observed in such detail in H2 emission. Our survey will investigate many more of these massive outflows and investigate the relation between H2 emission and the outflow driving sources.
Presumably unrelated to G 35.2 N, outflow activity is observed just to the north-east of the young cluster Mercer 14. At least three outflows can be identified in that region. To the east of the young cluster we identify an HII region, surrounded by most likely fluorescently excited H2 emission as well as a continuum reflection nebula. The object is listed as a planetary nebula (PN G035.100.7) but given the appearance, this is clearly a mis-classification. A more detailed analysis of this region will be performed in Ioannidis et al. (in preparation).
A preliminary analysis of UWISH2 data obtained in the first semester of operations (2009B) has been conducted. Images covering 24 square degrees have been examined. We identify about 350 candidate H2 outflows and/or emission line features (Molecular Hydrogen emission-line Objects - MHOs; Davis et al. [2010]) distributed over about 50 star forming regions. Based on this cursory analysis of the first semester data, we estimate that 2400 outflows spread throughout 300 star forming regions may be detectable in the UWISH2 data, a remarkable result – almost trebling the number of known MHOs (Davis et al. [2010]). We investigated the already analysed data for any trends of outflow numbers per square degree with galactic longitude or latitute. No significant trends could be found. Rather the number of flows per square degree varies by more than an order of magnitude between a few and up to 80, when averaged over one tile. Given the small fraction (just about ten percent of the total survey area) of data analysed so far we cannot draw any meaningful conclusions. We will have to await the investigation of the entire dataset before a complete and conclusive picture emerges.
5.2 HII Regions and Photon-Dominated Regions
UWISH2 complements perfectly the CORNISH VLA survey at 5 GHz and the IPHAS H survey, both of which are detecting not only evolved, extended HII but also Ultra Compact HII (UCHII) regions by virtue of their radio continuum and hydrogen recombination line emission. The spatial resolution of WFCAM is well matched to the resolution of the VLA and Spitzer surveys. Therefore, a statistical comparison can be made between radio and molecular emission properties.
In the Spitzer-GLIMPSE data, Churchwell et al. [2006] recently detected over 300 dusty bubbles surrounding late O or B-type stars. Roughly 25 % coincide with known HII regions, while 13 % enclose star clusters. Similar structures have been reported in ground-based H2 (and Br) observations of O/B stars and associated PDRs in NGC 7538 (Bloomer et al. [1998]) and in WFCAM observations of DR 21/W 75 (Davis et al. [2007]; Kumar et al. [2007]). A spectacular example of a PDR is evident in the UWISH2 image in Fig. 5. Combining UWISH2, CORNISH and IPHAS observations will also allow us to establish what fraction are fluorescently illuminated and what fraction are ionised. Thus, these data can be used to further examine the morphological and excitation properties of these HII regions, along with their associated PDRs and mid-IR bubbles. UWISH2 clearly offers sufficient resolution to distinguish morphological features in many of these objects. With (kinematic) distance estimates, size scales may also be attributed to many of these objects, yielding number distribution estimates and therefore lifetimes for H2 -bright HII regions.
Ground-based H2 observations of PDRs may also allow further constraints to be placed on current models of the material in PDRs. Allers et al. [2005] have used H2 observations of the Orion Bar PDR (at a similar pixel resolution to that of WFCAM) in conjunction with Far-UV information from the literature to identify a separation between the ionization front and the H2 emission peak, placing new constraints on both the FUV attenuation cross-section and atomic heating rates used in PDR models. UWISH2 survey data, when used in conjunction with observations at other wavelengths, will allow a whole range of PDR geometries, morphologies and radiation field strengths to be studied in a similar manner.
| Name | RA (J2000) | DEC (J2000) | Din [] | Dout [] |
|---|---|---|---|---|
| UWISH2 PN 1 | 18:50:14.1 | +02:18:08 | 3.3 | 7.5 |
| UWISH2 PN 2 | 18:57:35.8 | +02:27:02 | 6.0 | 14-21 |
| UWISH2 PN 3 | 19:01:03.1 | +01:57:28 | 10.0 | 15-25 |
| UWISH2 PN 4 | 19:31:10.7 | +19:29:06 | 5-11 | 15-23 |
5.3 Post-AGB Stars and Planetary Nebulae
Although widely distributed throughout the Milky Way, the post-AGB to PN phase is relatively brief. Thus, only a few hundred are known in the Galaxy. Many post-AGB stars and PN are bright H2 emitters. Near-infrared spectroscopic surveys have shown that objects in the early post-AGB phase can produce strong H2 emission as fast winds begin to blow and drive shocks into the surrounding molecular envelope (e.g. Hrivnak, Kwok & Geballe [1994]; García-Hernández et al. [2002]). As the central star evolves to hotter temperatures the H2 transitions are readily UV-pumped so that objects with B type central stars (and hotter) show fluorescent H2 emission (e.g. Davis et al. [2003], Kelly & Hrivnak [2005]).
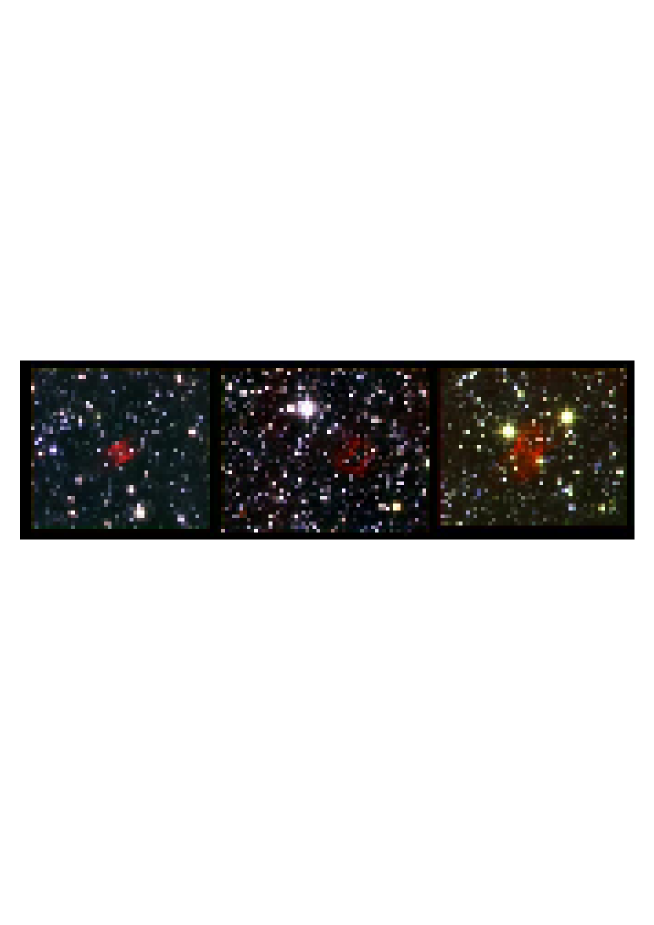
When combined with the UKIDSS-GPS, CORNISH 5 GHz and IPHAS H surveys, UWISH2 will result in a more complete census of evolved sources within the Galactic Plane. In particular, it will give a near extinction-free estimate of PN numbers, revealing embedded young PN hidden by interstellar extinction. Indeed, in our preliminary analysis of the 2009A data noted above, we have found four new PN, three of which are shown in Fig. 6. These objects were selected based on the appearance of their H2 line emission. We list the positions and apparent sizes of the PN in Table 1. The appearance of the objects in H2 emission ranges from compact circular symmetric objects to bipolar and asymmetric. If we assume the objects have an average size of about 0.3 pc (O’Dell [1962]), their distances range between 3 kpc for the larger objects and about 8 kpc for the compact UWISH2 PN 1. This is a general argument and may not have any meaning in terms of these specific objects as it depends on exactly the stage of evolution they are in. Old PN will tend to be bigger (e.g. the median radius of a volume limited sample within 1 kpc is 0.6 pc, which is dominated by old PN (Frew & Parker [2010]). Young objects will be smaller and pre-PN (protoplanetary nebulae) an order of magnitude smaller (e.g. 0.05 pc).

The current number of identified PN in the Galaxy now stands at around 3000 and is likely to rise as a result of ongoing surveys (e.g. Frew & Parker, [2010]), including UWISH2. An accurate measure of the PN content of the Galaxy is important in determining the relative importance of the various routes to PN formation and the role of binary interaction (see de Marco [2009] for a review). It has been noted that H2 -emitting PN tend to lie at low Galactic latitude, with a scale height of 150 pc (Kastner et al. [1996]) and the same trend exists for the pre-PN H2 emitters, which tend to be bipolar (Kelly & Hrivnak [2005]). A deep Galactic plane H2 survey, such as UWISH2, has the potential to uncover a significant population of evolved objects and its contiguous areal coverage will provide important constraints on their space density and any variation along the plane.
The UWISH2 survey also provides a unique study of PN morphologies (note the considerable improvement in spatial resolution over Spitzer evident in Fig. 4), particularly when complemented by IPHAS optical and CORNISH radio survey data. Point-symmetric structure is seen in many post-AGB objects and PN; this is thought to result from the interaction of a precessing jet with the remnant AGB shell (Kwok [2000]). In many ways the physics of post-AGB evolution mimics that seen in pre-main-sequence objects, something that could be investigated further with these simultaneous observations of both classes of object. Observations of the near-IR H2 and CO bandhead emission in the post-AGB object IRAS 18276-1431 show striking similarities with emission features in Herbig Haro jet sources (Gledhill et al. [2010]). Our near-IR observations will certainly lead to a more complete understanding of PN formation and shaping, and provide observational constraints on (magneto) hydrodynamic and photo-ionization models of PN formation and evolution.
Finally, to some extent UWISH2 may be useful in slecting transition objects, specifically those that are too cool to produce radio or Br emission, but which produce shocked H2 emission. The combined radio, H2 and H data will ultimately yield an evolutionary sequence for evolved stars based on excitation, providing age determinations for each evolutionary stage from source statistics.
5.4 Variable and High Proper Motion Stars
When combined with the GPS K-band data, UWISH2 is ideal for revealing long-term variables (e.g. giants, FUors, EXors). Although the time between the GPS JHK and UWISH2 H2 observations is somewhat random, the bulk of the First Galactic Quadrant was observed in the broad-band filters between May 2005 and July 2007, about two to four years prior to the first H2 observations were acquired in July 2009. We also stress that the narrow-band images reach a similar depth to point sources in the K-band (the GPS broad-band data reaches a modal depth of K 18 mag in uncrowded fields; Lucas et al. [2008]). Note that the GPS includes a 2nd K band epoch for which data collection is currently underway. Hence there will be three epochs in total for much of the UWISH2 region. The broad and narrow-band data can therefore be used to search for variable stars.
We find that for most fields the conversion of H2 into K-band magnitudes required for this variability search, is straight forward and only minor offsets and small colour terms need to be applied. In all cases using a colour term leads to the conversion with the lowest of the difference in flux measurements of stars between epochs. However, the exact magnitude of the offsets and colour terms varies with the observed field. This is due to known issues with the photometric calibration. As noted in the WFCAM Science Archive under ”Known Issues”, a small proportion of UKIDSS GPS fields with high extinction throughout, currently have significant photometric calibration errors. Sources in these fields are flagged with the ”pperrbits” error flags in the 7th UKIDSS GPS data release. E.g. sources with photometric errors in the K band have k1pperrbits 131072, compared with k1pperrbits 256 for sources with a reliable calibration. This issue is being investigated with the intention of correcting it for the 8th UKIDSS GPS data release in early 2011.
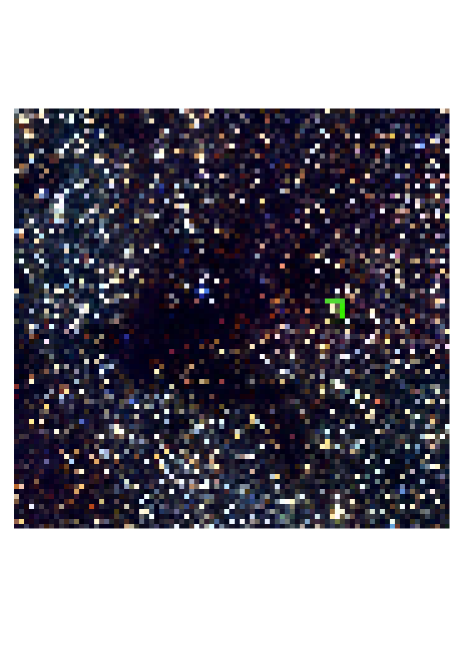
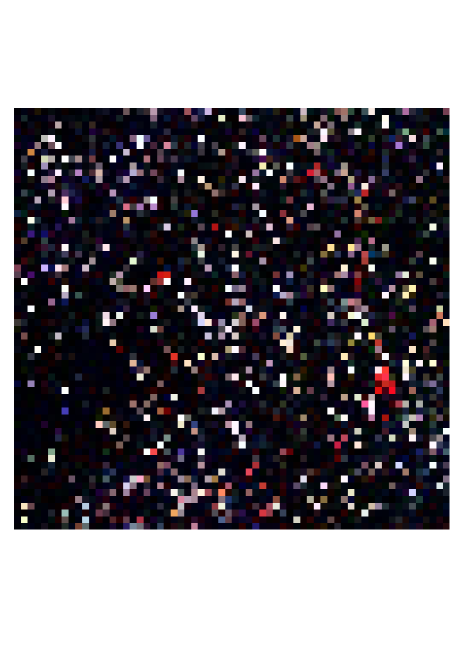
We search for variable stars by converting the H2 magnitudes into the K-band, considering the colour of the objects. Then we search for objects that change their brightness by more than 5 with respect to stars of comparable magnitude. One example of a variable source detected in our survey (2MASS J18072340-2025532) is shown in Fig. 7. This object has an IRAS and MSX detection, is associated with an OH maser and listed as ’Star with envelope of OH/IR type’ in the SIMBAD222http://simbad.u-strasbg.fr/simbad/ database. The source appears much “greener” in our JHH2 colour composite compared to the JHK composite from the UKIDSS GPS (see Fig. 7), hinting at a dimming in the K-band flux in the time between the observations. Indeed, as can be seen in Table 2, the source shows a remarkable change in near infrared brightness and colours over the last 11 yrs. It changes its J-K colour from about 6.5 mag to about 3.2 mag while brightening in the J-band and getting fainter in the K-band.
Our examination of the 24 square degrees observed in 2009B revealed about 450 candidate variable stars, many of which will be variable giants or FUor/EXor-type objects. Thus, throughout the entire UWISH2 survey area, we expect to observe as many as 3000 variable sources spread along the Galactic Plane. The threshold for detection of variability depends on the star’s brightness. We find that bright stars (K 15 mag) that change their K-band magnitude by more than 0.1 mag between UWISH2 and UKIDSS GPS can be identified at the 3 level. This increases up to about 0.7 mag for stars at the completeness limit of the survey. This should enable us to find not only variable giants, FUORs and EXORS but also many of the young stars, and other species as well.
Combining the UWISH2 and UKIDSS GPS surveys, with their sub-arcsecond resolution, we are also well equipped to find stars with high proper motion (HPM). These objects are also generally nearby, and hence a search for HPM stars naturally contributes to our inventory of the immediate Solar neighbourhood. Currently there is a lack of known nearby stars in the area of the Galactic Plane, simply caused by the vast number of stars, crowding and the insufficient spatial resolution of available surveys. The GPS has already been used to find one of the nearest known brown dwarfs (UGPS 0722-05, Lucas et al. [2010]). The object was selected using its colours, but was shown to have a proper motion of about 970 mas yr-1 and is at a distance of 4.1 pc.
We cross-matched a fraction of our survey with the GPS K-band data to identify detection limits for proper motion measurements. If one assumes a typical time gap of four years between the observation, then the 3 detection limit for PM measurements will be of the order of 100 to 200 mas yr-1. The actual value will depend on the brightness of the stars, the local crowding and the seeing conditions. Nevertheless, objects such as the above mentioned UGPS 0722-05 will be easily uncovered. Given our photometric detection limits (see Fig.3) of at least 17.5 mag in the K-band, and the absolute magnitudes of known brown dwarfs from Marocco et al. [2010] we can determine the distances out to which a search for HPM stars can be performed. We find that we can in principle search out to 80, 50, 20, and 5 pc for objects of spectral type T0, T5, T7, and T9, respectively. Of course the actual limits will depend on the local crowding, blending, the corresponding K-band photometric quality, and the actual proper motion. Note that away from the Galactic Centre with a detection limit of 18.3 mag in the K-band, the distance out to which these objects are detectable increases by 45 %, or in other words a three times larger volume can be searched.
| Survey | Date | J | H | K | J-K |
|---|---|---|---|---|---|
| DENIS | 1998/08/13 | 14.132 | — | 7.734 | 6.398 |
| 2MASS | 1999/07/07 | 14.797 | 10.545 | 8.026 | 6.771 |
| UKIDSS | 2007/05/09 | 12.353 | 10.440 | 9.070 | 3.283 |
| UWISH2 | 2009/07/30 | — | — | 9.94∗ | — |
5.5 Supernovae Remnants
Supernova remnants (SNR) are another category of astronomical sources where the H2 line is of considerable use. H2 lines are usually emitted by shocked interstellar or circumstellar molecular gas swept-up by SNR shocks. But sometimes the emission could originate from H2 gas in pre-shock region heated by a precursor or, in pulsar wind nebulae, from H2 gas heated by synchrotron emission and/or cosmic rays (Graham et al. [1990, 1991]). These H2 lines can be used to explore the physical properties and the nature of SNRs.
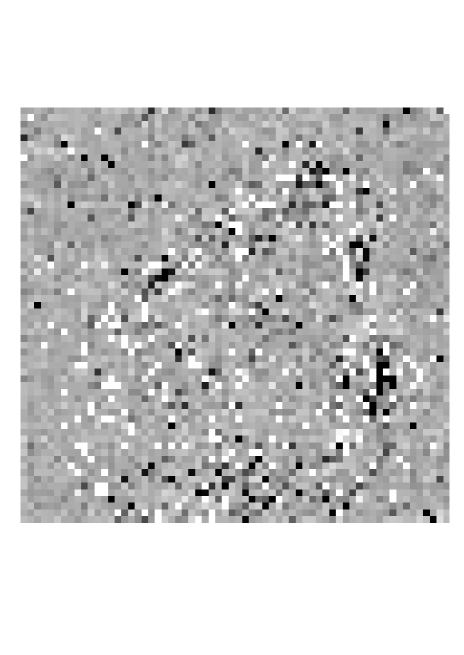
Among the known 274 Galactic SNRs in the Catalogue by Green [2009], about 25 % are included in the UWISH2 area. According to our preliminary analysis, at least seven of these SNRs show associated H2 emission. Figure 8 shows a JKH2 colour-composite image of the SNR W 44 (G 34.70.4), one of the most H2-prominent SNRs in the survey area. W 44 is a middle-aged ( yrs) SNR interacting with a molecular cloud at 3 kpc and the H2 emission had been detected by Reach et al. [2005]. However, this is the first time that we see the entire remnant in H2 emission. An extensive, organized system of thin and knotty H2 filaments is visible with the bright ones delineating the SNR boundary. The H2 image shows that the remnant has a morphology that is extended along the northwest-southeast direction, which is somewhat different from its morphology in radio emission (Castelletti et al. [2007]). This might be due to the non-uniform structure of the ambient medium. Meanwhile, the H2 morphology is quite similar to that seen in the Spitzer IRAC 4.5 m band (Lee [2005]), which implies that the latter is dominated by H2 lines in this band. Detailed analysis of the UWISH2 data will reveal more SNRs with associated H2 emission, which will help us to understand their physical environment and evolution.
5.6 Evolved Massive Stars
A fundamental key to understanding the evolution of massive stars is their mass loss (e.g. Maeder & Meynet [2000]) and observations of circumstellar nebulae around evolved massive stars (Wolf-Rayet stars, luminous blue variables (LBVs), etc.) could provide critical constraints on the mass loss history of the central stars. H2 lines can potentially provide a powerful probe of circumstellar nebulae around massive stars, as has been demonstrated for the case of -Carinae, a well known LBV (Smith [2006]). However, H2 lines around evolved massive stars could be rare as H2 might not survive in the vicinity of hot stars, and might not be sufficiently excited around cool supergiants. Nevertheless, a search for H2 emission around evolved massive stars using UWISH2 survey data might lead to new detections and could improve our understanding of their mass loss history.
In our preliminary study, we searched for associated H2 emission around known LBVs and candidate LBVs from Clark et al. [2005]. Eight sources are covered by the UWISH2 survey, but all resulted in negative detections. We also searched for H2 counterparts of compact nebulae reported by Gvaramadze et al. [2010], most of which are proposed to be associated with evolved massive stars. About 30 nebulae are covered by UWISH2, and we found only one candidate with emission so far. Even though our preliminary search has not been very successful, continuing search efforts in a larger sample of evolved massive stars will be performed.
5.7 Distances to star forming regions within our survey
One major task of the survey will be to assign distances to the investigated star forming regions. This is vital to achieve many of the science goals discussed in the above sections. There are a number of possibilities:
The VLA HI GP survey, BU FCRAO 13CO Galactic Ring survey, and Boston University-Arecibo Observatory HI survey can be used to assign kinematic distances to each star forming region. HI absorption in the aforementioned surveys can be used to resolve near/far distance ambiguities. Furthermore, the BGPS and Hi-GAL teams are working on using HISA, 13CO, and other heterodyne observations of dense gas tracers (NH3, HCO+, N2H+, CS, etc.) to determine distances to all of the dense gas clumps within the northern galactic plane. Also, maser parallaxes to a number of massive star forming regions are currently being measured (e.g. Reid et al. [2009]).
Distances can also be estimated from mean extinction values in JHK colour-colour diagrams, as well as counting the number of foreground stars in dense clouds and comparing with the Besançon Galaxy model (Robin et al. [2003]). It has been shown e.g. in Scholz et al. [2010] that this enables us to determine distances to not too distant dark clouds with an accuracy of about 20 %. Finally, we can utilise objects of known distance that are associated with the molecular clouds we are investigating.
6 Concluding Remarks
The UWISH2 narrow-band imaging survey is being used to trace dynamic processes associated with star formation and late stellar evolution. In particular, it picks out active regions of star formation, leading to estimates of star formation efficiency along the Galactic Plane. At the same time it also yields a more complete, unbiased census of post-AGB stars and PN in the Milky Way, leading to a comprehensive catalogue of PN morphologies as well as a map of their distribution along the Inner Galaxy.
A major strength of the UWISH2 survey lies in its complementarity with other existing or upcoming surveys; the benefits of combining high-spatial resolution narrow-band WFCAM images of massive star forming regions with mid- and far-IR observations has recently been demonstrated by Davis et al. [2007] and Kumar et al. [2007]. In these complex environments the narrow-band data yield flow statistics and pin-point regions of active star formation, while the multi-wavelength photometry reveal the relative distributions of pre-stellar cores, protostars and pre-main-sequence objects.
Benefits are also wrought when H2 data are combined with optical and radio data, in outflows from low and high mass YSOs, but also toward post-AGB stars and PN, where rapidly changing physical conditions require combined observations in a variety of excitation tracers. The GLIMPSE-North data are already available and accessible through the IPAC archive (and has been cross-matched to the GPS, available at the WFCAM science archive); IPHAS data are also publicly available and cover half of the Northern Galactic Plane; the AKARI all sky survey faint point source catalogue will also be available in the near future. The MSX point-source catalogue may also be used for the few massive sources that saturate in IRAC data, along with future longer wavelength data from JCMT-JPS. The importance of serendipitous discoveries of interesting emission-line objects of all types should also not be ignored.
The combination of broad- and narrow-band data will aid in the selection of targets for study with instruments where full-scale mapping of the Galactic plane is impractical (e.g. the sub-mm heterodyne array receiver, HARP, the SCUBA-2 Polarimeter on the JCMT, and of course future high-resolution facilities such as ALMA and the James Webb Space telescope). Finally, it is worth noting that massive star formation is at the heart of the science case for many Galactic Plane surveys, e.g. the JCMT Galactic Plane Survey (JPS), the Spitzer-GLIMPSE survey, and the Herschel Hi-GAL mid-IR survey. These will reveal dense molecular cores and mid-IR bright YSOs, effectively identifying all of the massive pre-main-sequence stars, protostars and massive pre-stellar cores. UWISH2 will in turn establish how many of these are dynamically active. Although extinction will be high in the coldest and most massive objects, outflows rapidly break out of these environments and are usually bright in H2 line emission. Identifying outflows and tracing them back to sub-mm sources will certainly be an important way of identifying the location of protostars in these mid-IR and sub-mm survey data. Indeed, our initial analysis of 24 square degrees of early UWISH2 data, which has revealed numerous outflows (as well as new PN, clusters and variable stars), demonstrates that this is certainly the case.
acknowledgements
We would like to thank the referee A. Ginsburg for his helpfull comments on the paper. The UWISH2 survey team would also like to acknowledge the UKIRT support staff, particularly the Telescope System Specialists (Thor Wold, Tim Carroll and Jack Ehle) and the many UKIRT observers who have obtained data for the UWISH2 project via flexible scheduling. We also acknowledge the Cambridge Astronomical Survey Unit and the WFCAM Science Archive for the reduction and ingest of the survey data. BCK was supported by the Korean Research Foundation Grant funded by the Korean Government (KRF-2008-313-C00372). MSNK is supported by a Ciência 2007 contract, funded by FCT/MCTES (Portugal) and POPH/FSE (EC). The United Kingdom Infrared Telescope is operated by the Joint Astronomy Centre on behalf of the Science and Technology Facilities Council of the U.K. Finally, we also thank the UKIRT Time Allocation Committee for their support of this long-term project.
References
- [2004] Allen, L.E., Calvet, N., D’Alessio, P., Merin, B., Hartmann, L., Megeath, S.T., Gutermuth, R.A., et al., 2004, ApJS, 154, 363
- [2005] Allers, K.N., Jaffe, D.T., Lacy, J.H., Draine, B.T., Richter, M.J., 2005, ApJ, 630, 368
- [2008] Anathpindika, S., & Whitworth, A.P., 2008, A&A, 487, 605
- [2008] Antoniucci, S., Nisini, B., Giannini, T., Lorenzetti, D., 2008, A&A, 479, 503
- [2010] Aguirre, J.E., Ginsburg, A.G., Dunham, M.K., Drosback, M.M., Bally, J., Battersby, C., Bradley, E.T., et al., 2010, ApJS, in press
- [2007] Arce, H.G., Shepherd, D., Gueth, F., Lee, C.-F., Bachiller, R., Rosen, A., Beuther, H., 2007, in Protostars and Planets V, B. Reipurth, D. Jewitt, and K. Keil (eds.), University of Arizona Press, Tucson, 951, 245
- [1995] Bally, J., Devine, D., Fesen, R.A., Lane, A.P., 1995, ApJ, 454, 345
- [2006] Banerjee, R. & Pudritz, R.E. 2006, ApJ, 641, 949
- [2007] Beck, T.L., 2007, AJ, 133, 1673
- [2003] Benjamin, R.A., Churchwell, E., Babler, B.L., Bania, T.M., Clemens, D.P., Cohen, M., Dickey, J.M., et al., 2003, PASP, 115, 953
- [2006] Birks, J.R., Fuller. G.A., Gibb, A.G., 2006, A&A, 458, 181
- [1998] Bloomer, J.D., Watson, D.M., Pipher, J.L., Forrest, W.J., Ali, B., Greenhouse, M.A., Satyapal, S., 1998, ApJ, 506, 727
- [1982] Brown, A.T., Little, L.T., MacDonald, G.H., Matheson, D.N., 1982, MNRAS, 201, 121
- [2011] Buckle, J.V., Richer, J.S., Davis, C.J., 2011, MNRAS, in press
- [2009] Butler, M.J., Tan, J.C., 2009, ApJ, 696, 484
- [2008] Caratti o Garatti, A., Froebrich, D., Eislöffel, J., Giannini, T., Nisini, B., 2008, A&A, 485, 137
- [2006] Caratti o Garatti, A., Giannini, T., Nisini, B., Lorenzetti, D., 2006, A&A, 449, 1077
- [2009] Carey, S.J., Noriega-Crespo, A., Mizuno, D.R., Shenoy, S., Paladini, R., Kraemer, K.E., Price, S.D., et al., 2009, PASP, 121, 76
- [2007] Casali, M., Adamson, A., Alves de Oliveira, C., Almaini, O., Burch, K., Chuter, T., Elliot, J., et al., 2007, A&A, 467, 777
- [2007] Castelletti, G., Dubner, G., Brogan, C., Kassim, N.E., 2007, A&A, 471, 537
- [1995] Caswell, J.L., Vaile, R.A., Ellingsen, S.P., Whiteoak, J.B., Norris, R.P., 1995, MNRAS, 272, 96
- [2010] Chen H.-H., Takami M., Karr J.L., Lee H.-T., Lai S.-P., Minh Y.-C., 2010, ApJ, submitted
- [2009] Churchwell, E., Babler, B.L., Meade, M.R., Whitney, B.A., Benjamin, R., Indebetouw, R., Cyganowski, C., et al., 2009, PASP, 121, 213
- [2006] Churchwell, E., Povich, M.S., Allen, D., Taylor, M.G., Meade, M.R., Babler, B.L., Indebetouw, R., et al., 2006, ApJ, 649, 759
- [2005] Clark, J.S., Larionov, V.M., Arkharov, A., 2005, A&A, 435, 239
- [2008] Cyganowski, C. J., Whitney, B. A., Holden, E., Braden, E., Brogan, C. L., Churchwell, E., et al., 2008, AJ, 136, 2391
- [2001] Dame, T.M., Hartmann, D., Thaddeus, P., 2001, ApJ, 547, 792
- [1985] Dame, T.M., Thaddeus, P., 1985, ApJ, 297, 751
- [1995] Davis, C.J., Eislöffel, J. 1995, A&A, 300, 851
- [2009] Davis, C.J., Froebrich, D., Stanke, T., Megeath, S.T., Adamson, A., et al., 2009, A&A, 496, 153.
- [2010] Davis, C.J., Gell, R., Khanzadyan, T., Smith, M.D., Jenness, T., 2010, A&A, 511, 24
- [2007] Davis, C.J., Kumar, M.S.N., Sandell, G., Froebrich, D., Smith, M.D., Currie, M.J., 2007, MNRAS, 374, 29
- [2003] Davis, C.J., Smith, M.D., Stern, L., Kerr, T.H., Chiar, J.E., 2003, MNRAS, 344, 262
- [2006] De Buizer, J.M., 2006, ApJ, 642, 57
- [2010] De Buizer, J.M., Vacca, W.D., 2010, AJ, 140, 196
- [2009] de Marco, O., 2009, PASP, 121, 316
- [1985] Dent, W.R.F., Little, L.T., Kaifu, N., Ohishi, M., Suzuki, S., 1985, A&A, 146, 375
- [2005] Drew, J.E., Greimel, R., Irwin, M.J., Aungwerojwit, A., Barlow, M.J., Corradi, R.L.M., Drake, J.J., et al., 2005, MNRAS, 362, 752
- [2006] Dye, S., Warren, S.J., Hambly, N.C., Cross, N.J.G., Hodgkin, S.T., Irwin, M.J., Lawrence, A., et al., 2006, MNRAS, 372, 1227
- [2000] Eislöffel, J., 2000, A&A, 354, 236
- [1994] Eislöffel, J., Mundt, R., Böhm, K.-H., 1994, AJ, 108, 1042
- [2006] Elias, F., Alfaro, E.J., Cabrera-Cano, J., 2006, AJ, 132, 1052
- [2001] Falgarone, E., Pety, J., Phillips, T.G., 2001, ApJ, 555, 178
- [2000] Fiege, J.D., Pudritz, R.E., 2000, MNRAS, 311, 105
- [2010] Frew, D.J., Parker, Q.A., 2010, PASA, 27, 129
- [2003] Froebrich, D., Scholz, A., 2003, A&A, 407, 207
- [2002] García-Hernández, D.A., Manchado, A., García-Lario, P., Domínguez-Tagle, C., Conway, G.M., Prada, F., 2002, A&A, 387, 968
- [1997] Giacani, E.B., Dubner, G.M., Kassim, N.E., Frail, D.A., Goss, W.M., Winkler, P.F., Williams, B.F., 1997, AJ, 113, 1379
- [2009] Ginsburg, A.G., Bally, J., Yan, C-H., Williams, J.P., 2009, ApJ, 707, 310
- [2010] Gledhill, T.M., Forde, K.P., Lowe, K.T.E., Smith, M.D., 2010, MNRAS, in press, arXiv:1009.5608
- [1990] Graham, J.R., Wright, G.S., Longmore, A.J., 1990, ApJ, 352, 172
- [1991] Graham, J.R., Wright, G.S., Hester, J.J., Longmore, A.J., 1991, AJ, 101, 175
- [2009] Green, D.A., 2009, Bulletin of the Astronomical Society of India, 37, 45
- [2007] Green, J.A., Cohen, R.J., Caswell, J.L., Fuller, G.A., Brooks, K., Burton, M.G., Chrysostomou, A., et al., 2007, in Astrophysical Masers and their Environments, Proceedings of the International Astronomical Union, IAU Symposium, Volume 242, 218
- [2010] Gvaramadze, V.V., Kniazev, A.Y., Fabrika, S., 2010, MNRAS, 405, 1047
- [2009] Han, J.L., 2009, in Cosmic Magnetic Fields: From Planets, to Stars and Galaxies, Proceedings of the International Astronomical Union, IAU Symposium, 259, 455
- [2007] Hatchell, J., Fuller, G.A., Richer, J.S., 2007, A&A, 472, 187
- [2000] Heiles, C., 2000, AJ, 119, 923
- [2010] Henning, T., Linz, H., Krause, O., Ragan, S., Beuther, H., Launhardt, R., Nielbock, M., et al., 2010, A&A, 518, L95
- [2006] Hewett, P.C., Warren, S.J., Leggett, S.K., Hodgkin, S.T., 2006, MNRAS, 367, 454
- [2007] Hodapp, K.W., 2007, AJ, 134, 2020
- [2002] Hodapp, K.W., Davis, C.J., 2002, ApJ, 575, 291
- [2009] Hodgkin, S.T., Irwin, M.J., Hewett, P.C., Warren, S.J., 2009, MNRAS, 394, 675
- [1994] Hrivnak, B.J., Kwok, S., Geballe, T.R., 1994, ApJ, 420, 783
- [1999] Hutawarakorn, B., Cohen, R.J., 1999, MNRAS, 303, 845
- [2010] Ishihara, D., Onaka, T., Kataza, H., Salama, A., Alfageme, C., Cassatella, A., Cox, N., et al., 2010, A&A, 514, 1
- [2006] Jackson, J.M.. Rathborne, J.M., Shah, R.Y., Simon, R., Bania, T.M., Clemens, D.P., Chambers, E.T., et al., ApJS, 163, 145
- [1996] Kastner, J.H., Weintraub, D.A., Gatley, I., Merrill, K.M., Probst, R.G., 1996, ApJ, 462, 777
- [2005] Kelly, D.M., Hrivnak, B.J., 2005, 629, 1040
- [2009] Kirby, L., 2009, ApJ, 694, 1056
- [2007] Kumar, M.S.N., Davis, C.J., Grave, M.J.C., Ferreira, B., Froebrich, D., 2007, MNRAS, 374, 54
- [2000] Kwok, S., 2000, in Encyclopedia of Astronomy and Astrophysics, Edited by Paul Murdin, article 5200. Bristol: Institute of Physics Publishing
- [2007] Lawrence A., Warren, S.J., Almaini, O., Edge, A.C., Hambly, N.C., Jameson, R.F., Lucas, P.W., et al., 2007, MNRAS, 379, 1599
- [2005] Lee, H.-G., 2005, JKAS, 38, 385
- [2008] Lucas, P.W., Hoare, M.G., Longmore, A., Schröder, A.C., Davis, C.J., Adamson, A., Bandyopadhyay, R.M., et al., 2008, MNRAS, 391, 136
- [2010] Lucas, P.W., Tinney, C.G., Burningham, B., Leggett, S.K., Pinfield, D.J., Smart, R., Jones, H.R.A., et al., 2010, MNRAS, 408, 56
- [2000] Maeder, A., Meynet, G., 2000, A&A, 361, 159
- [2010] Marocco, F., Smart, R.L., Jones, H.R.A., Burningham, B., Lattanzi, M.G., Leggett, S.K., Lucas, P.W., et al., 2010, A&A, 524, 38
- [1997] Miralles, M.P., Salas, L., Cruz-González, I., Kurtz, S., 1997, ApJ, 488, 749
- [2006] Moe, M., De Marco, O., 2006, ApJ, 650, 916
- [2010] Molinari, S., Swinyard, B., Bally, J., Barlow, M., Bernard, J.-P., Martin, P., Moore, T., et al., 2010, PASP, 122, 314
- [1962] O’Dell, C.R., 1962, ApJ, 135, 371
- [2008] Purcell, C.R., Hoare, M.G., Diamond, P., 2008, in Massive Star Formation: Observations Confront Theory ASP Conference Series, Edited by Henrik Beuther, Hendrik Linz, and Thomas Henning. San Francisco: Astronomical Society of the Pacific, 387, 389
- [2008] Qiu, K., Zhang, Q., Megeath, S.T., Gutermuth, R.A., Beuther, H., Shepherd, D.S., Sridharan, T.K., et al., 2008, ApJ, 685, 1005
- [2006] Rathborne, J.M., Jackson, J.M., Simon, R., 2006, ApJ, 641, 389
- [2005] Reach, W.T., Rho, J., Jarrett, T.H., 2005, ApJ, 618, 297
- [2000] Reed, B.C., 2000, AJ, 120, 314
- [2009] Reid, M.J., Menten, K.M., Zheng, X.W., Brunthaler, A., Moscadelli, L., Xu, Y., Zhang, B., et al., 2009, AJ, 700, 137
- [2003] Robin, A. C., Reylé, C., Derriere, S., Picaud, S., 2003, A&A, 409, 523
- [2010] Rosolowsky, E., Dunham, M.K., Ginsburg, A., Bradley, E.T., Aguirre, J., Bally, J., Battersby, C., et al., 2010, ApJS, 188, 523
- [2010] Scholz, A., Froebrich, D., Davis, C.J., Meusinger, H., 2010, MNRAS, 406, 505
- [2009] Schuller, F., Menten, K.M., Contreras, Y., Wyrowski, F., Schilke, P., Bronfman, L., Henning, T., et al., 2009, A&A, 504, 415
- [2006a] Simon, R., Jackson, J.M., Rathborne, J.M., Chambers, E.T., 2006a, ApJ, 639, 227
- [2006b] Simon, R., Rathborne, J.M., Shah, R.Y., Jackson, J.M., Chambers, E.T., 2006b, ApJ, 653, 1325
- [2006] Skrutskie, M.F., Cutri, R.M., Stiening, R., Weinberg, M.D., Schneider, S., Carpenter, J.M., Beichman, C., et al., 2006, AJ, 131, 1163
- [1995] Smith, M.D., 1995, A&A, 296, 789
- [2005] Smith, M.D., Rosen, A., 2005, MNRAS, 357, 1370
- [2006] Smith, N., 2006, ApJ, 644, 1151
- [2009] Stecklum, B., Caratti O Garatti, A., Davis, C.J., Linz, H., Stanke, T., Zinnecker, H., 2009, in Protostellar Jets in Context, by Kanaris Tsinganos, Tom Ray, Matthias Stute. Astrophysics and Space Science Proceedings Series. Berlin: Springer, 619
- [2010] Takami, M., Karr, J.L., Koh, H., Chen, H.-H., Lee, H.-T., 2010, ApJ, 720, 155
- [2008] Urquhart, J.S., Busfield, A.L., Hoare, M.G., Lumsden, S.L., Oudmaijer, R.D., Moore, T.J.T., Gibb, A.G., et al., 2008, A&A, 487, 253
- [2010] Varricatt, W.P., Davis, C.J., Ramsay, S.K., Todd, S.P., 2010, MNRAS, 404, 661.
- [2009] Walawender, J., Reipurth, B., Bally, J., 2009, AJ, 137, 3254