The old environment of the faint calcium-rich supernova SN 2005cz
Abstract
The supernova SN 2005cz has recently attracted some attention, due to the fact that it was spectroscopically similar to type Ib supernovae (SNe), a class that is presumed to result from core-collapse of massive stars, yet it occurred in an elliptical galaxy, where one expects very few massive stars to exist. Two explanations for this remarkable event were put forward. Perets et al. (2010) associate SN 2005cz with the class of Ca-rich, faint SNe Ib, which likely result from old double-white-dwarf systems with a He-rich secondary. On the other hand, Kawabata et al. (2010) suggest that SN 2005cz is indeed a core-collapse event (in a binary system), albeit of a star at the lower end of the mass range, . The existence of this star in its elliptical host is explained as resulting from low-level star formation (SF) activity in that galaxy. Here we present extensive observations of the location of SN 2005cz, sensitive to a variety of SF tracers, including optical spectroscopy, emission, UV emission and HST photometry. We show that NGC 4589, the host galaxy of SN 2005cz, does not show any signatures of a young stellar population or recent SF activity either close to or far from the location of SN 2005cz.
1. Introduction
Recently a novel type of faint supernovae (SNe) with peculiar properties has been discovered. A group of eight such events has been identified, all spectroscopically similar to type Ib SNe, but faint (typical absolute peak magnitude of ) and calcium rich (Perets et al., 2010). Although type Ib SNe are generally thought to result from core-collapse of massive stars (e.g. Filippenko 1997), a large fraction of the host galaxies of these faint, Ca-rich SNe are early type galaxies. Additionally, the ejecta mass of SNe in this subclass appear to be very low (e.g. found for SN 2005E, Perets et al., 2010; and found for SN 2005cz, Kawabata et al., 2010), less than expected and observed for core-collapse SNe of any type. These SNe were therefore suggested to originate from a different process involving the thermonuclear explosion of a helium-shell on a white dwarf (Perets et al., 2010; Shen et al., 2010; Waldman et al., 2010). Nevertheless, an alternative scenario involving a core-collapse of a star, which is a part of a binary, was suggested by Kawabata et al. (2010) for the origin of one of the Ca-rich SNe; SN 2005cz. Here we study this possibility, and look for any evidence for SF or young stellar population near the location of SN 2005cz. In the following we discuss our results from observations of various SF tracers including emission, HST photometry, host galaxy spectra and UV emission. In addition we shortly discuss the star formation and merger history of the host galaxy.
2. Star formation traces
Massive stars are usually formed and observed in giant molecular clouds and young stellar clusters or associations (Chu & Gruendl, 2008; Schilbach & Röser, 2008). Core-collapse SNe from massive stars are therefore expected to be found close to star-forming regions (SFRs), and overall in SF galaxies. We therefore searched for SF tracers in the host galaxy both near and far from the location of SN 2005cz.
SFRs produce two classes of emission: continuum emission from young stars and emission lines (dominated by H) produced by ionized gas. We have searched for both classes of emission, and obtained upper limits on the SF rates. In addition we used HST images to look for nearby point sources which may correspond to young stars close to the SN location.
2.1. R-band and H imaging
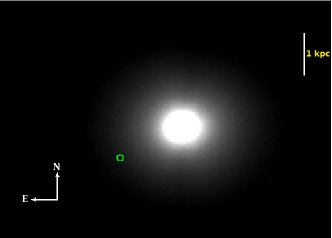
SN 2005cz was discovered on July 17th 2005, in the elliptical galaxy NGC 4589 (Dimai et al., 2005, RA 12:37:27.85; dec 74:11:24.5). Published H narrow-band imaging data exists for this galaxy (Goudfrooij et al., 1994). These data do not suggest any SF activity close to the location of SN 2005cz, although Goudfrooij et al. do find a significant H+[NII] emission from the central regions of the galaxy, aligned along the minor axis where a dust lane is observed (see Fig. 1 and their Fig. 22).
We obtained an additional H image of NGC 4589 with the Liverpool Telescope (LT), and then analyzed it using similar methods to those described in detail elsewhere (Anderson & James, 2009). We detected the dust lane mentioned above as a perturbation to the isophotes in our LT R-band image. Notice that according to Goudfrooij et al. (1994) the H+[NII] emission is associated with the LINER nucleus, and SF is not discussed in that context; this is further supported by Ho et al. (1997) and our analysis of the galaxy spectrum (see below and in Fig. 2). Moreover, the emission runs from the galactic nucleus along an axis offset to that containing the SN 2005cz position. Therefore, there is no evidence in either the Goudfrooij et al. (1994) data or in ours for any line emission near the SN location and even to large distances from it (> 1.5 kpc, see also Fig. 2).
Although core-collapse SNe do not locally trace the H emission from SF regions, they do trace larger scale SF H emission in the host galaxies of core-collapse SNe (Anderson & James, 2009). In particular, none of the SNe in the Anderson & James (2009) sample were found in elliptical galaxies, and only of all CC SNe in their survey show H emission at similar or larger distances from the SNe location as found for SN 2005cz. We note that in the latter cases the emission was clearly related to SF, where as the H emission we find in the host galaxy of SN 2005cz (but far from it) is likely related to the LINER nucleus, rather than to any SF activity (see next section).
We also used our data to determine a upper limit for the H flux from the variation of the sky background, using a aperture, of erg cm-2 (determined using a host galaxy R-band magnitude taken from Sandage & Visvanathan, 1978). At the distance of NGC 4589 ( Mpc; taken from NED111http://nedwww.ipac.caltech.edu/) this corresponds to an H luminosity of erg s-1. Correcting this for Galactic extinction (0.075) and the contribution from NII lines we get an H flux of erg s-1 cm-2 . Using the calibration from Kennicutt (1998, Eq. 2) we find an upper limit on the SF rate of yr-1.
2.2. Host galaxy spectrum
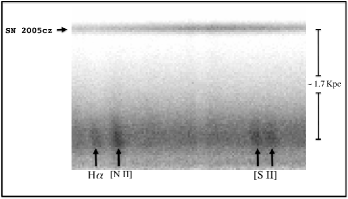
We observed the location of SN 2005cz on 28 July, 2005 using the LRIS spectrograph mounted on the Keck 10m telescope on 28 July, 2005, and obtained data from a 500 s exposure. The deep, 2-d spectral image shows no emission features within at least 1 kpc of the location of SN 2005cz (see Fig. 2). While emission lines from the bright galaxy nucleus are seen on the spectral image, they are ( kpc) away, and are not those of typical HII regions (e.g., they include strong [S II] 6722/6734); rather, they present line ratios characteristic of a LINER galaxy nucleus, consistent with the LINER classification of this galaxy given by Ho et al. (1997). Thus, while H emission is observed in the galaxy, it is not near the SN location, and in any event shows no obvious indication of being associated with SF activity.
2.3. HST photometry
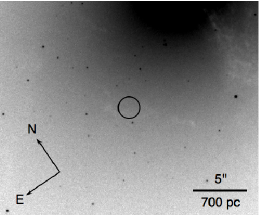
Post-explosion HST data exist for the location of SN 2005cz (taken on Nov 11th 2006 with the ACS/WFC F435W, F555W and F814W filters and exposure times of 1500, 1500 and 1600 s, respectively). These observations were made as part of HST program GO 10498 (PI: S. Smartt). Photometric analysis of the objects close to the location of SN 2005cz has been performed using PSF fitting procedures within IRAF DAOPHOT.
Fig. 3 shows a section of the post-explosion ACS F435W image. The plotted circle has radius ( pc) and is centered on the reported position of SN 2005cz. As can be seen we found no object suggesting the existence of massive stars nearby the reported location of SN 2005cz. The closest source we observe is ( pc, projected; see Fig. 3); the V-I colors () and absolute magnitudes (ranging between and mag) of objects within ( pc) are all consistent with those of globular clusters, as seen in other nearby elliptical galaxies (e.g. M87; Kundu et al., 1999).
One of the scenarios discussed by Kawabata et al. (2010) suggested the progenitor of SN 2005cz had been a massive star () with a binary companion. Massive stars usually have similarly high mass companions (e.g. Kobulnicky & Fryer, 2007). We therefore initially attempted to find a detection of the (likely) massive companion of the SN progenitor in the post-explosion data, but no point source was visible at the SN site. We therefore derived detection limits for each image, in an attempt to constrain the luminosity, and hence mass, of the unseen companion of the progenitor star, or alternatively, of any other massive star likely to exist in this region if it were a SFR environment. Photon counts at the level were defined for an aperture of (ACS/WFC) pixels radius. Aperture corrections (from a 4 pixel to infinite aperture) were taken from Sirianni et al. (2005), while Vegamag zeropoints were taken from the ACS website hosted by STScI.222http://www.stsci.edu/hst/acs/analysis/zeropoints The apparent magnitude limits were converted to absolute magnitude limits using the average distance modulus from NED: mag and the foreground extinction from Schlegel et al. (1998): assuming the reddening law of Cardelli et al. (1989). We then find detection limits of and where the errors are dominated by the uncertainty in the distance modulus.
We similarly use pre-explosion HST data from the WFPC2 instrument which exist for the location of SN 2005cz. In principle, the pre-explosion data can be used to constrain not only the type of the companion of the progenitor star (or other massive stars in its environment), but also the SN progenitor itself. Unfortunately, the pre-explosion data are of significantly lower depth than post-explosion observations. These data were taken on May 14th 1994 (GO 5454 - PI: M. Franx), with the F555W and F814W filters and exposure times of 1000 and 460 s, respectively, and on January 10th 1999 (SNAP 6357 - PI: W. Jaffe), with the F702W filter and an exposure time of 1000 s. We derived detection limits for these images using the same procedure as above; photon counts defined for a 4 (PC) pixel radius aperture, with aperture corrections from Holtzman et al. (1995), and the updated Vegamag zeropoints of Dolphin (2000) taken from his website.333http://purcell.as.arizona.edu/wfpc2_calib In this case we find detection limits of and where again the the errors are dominated by the uncertainty in the distance modulus.
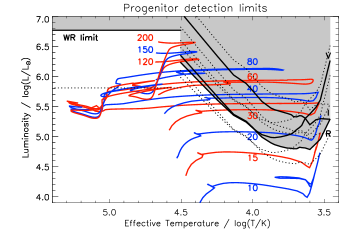
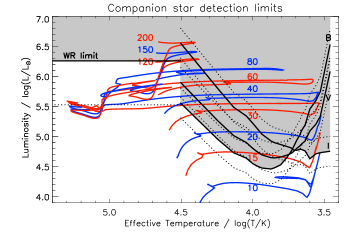
The absolute magnitude limits we find are converted to luminosity limits for a range of Wolf-Rayet and supergiant spectral-types. To do so requires a color and bolometric correction for each spectral type in each of the HST instrument and filter combinations. This is exactly the same approach used by, for example, Maund & Smartt (2005) and Crockett et al. (2007). Here, we have used the color and bolometric corrections for O9 to M5 supergiant stars from Drilling & Landolt (2000). The color transformations between the ACS Vegamag to Johnson-Cousins photometry was carried out using the methodology and coefficients from Sirianni et al. (2005) for the post-explosion data. For the pre-explosion data correction from the HST flight system to Johnson-Cousins magnitudes were done following Dolphin (2000) and using the updated coefficients from his website2. The results are shown in Fig. 4. The solid, black curves to the right of the H-R diagrams (HRD), which are labeled B, V, R and I denote the luminosity limits derived from the F435W, F555W, F702W and F814W images, respectively. The dashed curves are the uncertainties of these limits.
For Wolf-Rayet stars we have taken a simplified approach, following Crockett et al. (2007). In this case, the F555W and F435W filters provide the most restrictive limits for such hot stars in the pre- and post- explosion data (respectively), and these are the only limits that are plotted on the HRDs, shown as horizontal black lines in the top-left. These lines denote the WR luminosity limits calculated from the F555W and F435W absolute magnitude limits, and using a bolometric correction of (Smith & Maeder, 1989). The lower, horizontal dashed lines mark the luminosity limits assuming a lower limit to the bolometric correction of (Crowther, 2007) and the lower bound of the distance modulus.
Also plotted on the HRDs are stellar evolutionary models created using the Cambridge STARS code (Eldridge & Tout, 2004). These models are of solar metallicity () and range in mass from to . WR mass-loss rates including scaling with metallicity are from Eldridge & Vink (2006).
The HST images show no evidence of red supergiants more massive than in the vicinity of the SN location. If the progenitor of SN 2005cz was a star (lifetimes of Myr; Schaller et al. 1992), we might still have been able to find more massive stars (e.g. 15 , with lifetime of Myr), given a few Myr age spread inferred for SF regions (e.g. Da Rio et al., 2010; Jeffries, 2009, and references therein).
We conclude that the HST data constrain the possibility of recent SF activity, and disfavor a very massive stellar progenitor for SN 2005cz (i.e. likely excluding the possibility of a single massive progenitor, as suggested in some models for type Ib SN). They also exclude the existence of a massive () red supergiant binary companion to the progenitor of SN 2005cz. However, these data can not, by themselves, strongly constrain a core-collapse model with a progenitor for the SN.
2.4. GALEX, 2MASS and RCS photometry
2.4.1 Star formation history of the host galaxy
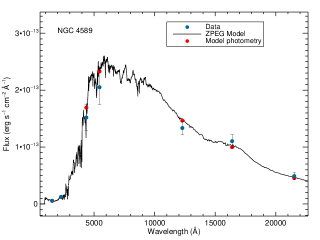
We use host galaxy photometry compiled in a similar way to that described by Neill et al. (2009), including ultraviolet data from the GALEX (Galaxy Evolution Explorer) satellite, and optical photometry from the third reference catalog of bright galaxies (RC3; Corwin et al., 1994) and 2MASS (Skrutskie et al., 2006). We analyzed the data in order to estimate the SF history and age of NGC 4589 using the methods described in detail by Sullivan et al. (2006, 2010). This makes use of the photometric redshift code Z-PEG (Le Borgne & Rocca-Volmerange, 2002) based upon the PEGASE.2 spectral synthesis code (e.g. Fioc & Rocca-Volmerange, 1997). Our best fitted spectrum is shown in Fig. 5.
We find that the photometry of NGC 4589 is best fitted with a total stellar mass of (acceptable solutions are in the range ), null specific SF rate, and a mean age of Gyr444Note that the given error ranges are only statistical, and the systematics could be larger., i.e. we find no trace of any recent SF activity in this galaxy, and generally infer from the data an old age for the stellar population of NGC 4589.
2.4.2 Limits on local star formation from GALEX UV photometry
We have estimated a limit on the SF rate near the SN location using the measured NUV luminosity. We have relied on the relation from Kennicutt (1998) converted to the Kroupa (2001) IMF:
| (1) |
where is the NUV luminosity in units of ergs s-1 Hz-1, and SFR is the SF rate in yr-1.
We note that SFRs derived from the NUV luminosity for red sequence galaxies are problematic (see discussion in Wyder et al., 2007), because the NUV band can include light from older stellar populations (Yi et al., 2005; Rich et al., 2005). In such cases, the NUV luminosity will overestimate the recent SFR. The SFR we find therefore serves only as an upper limit. For an aperture of kpc around the SN location we find the Galactic extinction corrected AB NUV magnitude of mag. At the distance of NGC 4589 this translates to yr-1. At such low SFR, massive stars are unlikely to form. Indeed, as discussed by Pflamm-Altenburg et al. (2007), the upper limit for the stellar clusters mass function decreases with lower SFR. The fraction of ionizing massive stars is higher in heavy star clusters than in light star clusters, due to the relation between the mass of a star cluster and its most massive star. Therefore (Pflamm-Altenburg et al., 2007, see their figure 4) find that at SFRs as low as we find, massive stars of as required for a core-collapse SN, rarely form, if they form at all.
2.5. Galaxy morphology
In support of one of the model in which SN 2005cz originated from a core collapse of a young massive star (), Kawabata et al. (2010) suggest that NGC 4589 could have suffered a recent merger, triggering some SF activity. However, the morphology of NGC 4589 is relaxed (Schweizer et al., 1990). Even the dust lane mentioned above is observed at a very low level, and therefore a major merger occurring 100 Myr ago or less is unlikely. Although NGC 4589 does have a complex stellar rotation field, its morphology shows a smooth optical profile following the de Vaucouleurs law (Moellenhoff & Bender, 1989); this could support the possibility that the galaxy is a relatively old merger remnant; however, this is irrelevant for the discussion of recently triggered SF. Moreover, even if a minor merger event occurred in the more recent past, the evidence from the dust lane (Fig. 1) would suggest that it occurred along the minor axis, far from the SN location.
3. Discussion and Summary
In this letter we studied the local and global environment of SN 2005cz in the elliptical galaxy NGC 4589. We used various SF tracers including optical spectroscopy, emission, UV emission and HST photometry. We also reviewed the the merger history of the host galaxy. We found that although some H emission (which in principle could trace SF activity) exists in the host galaxy, it is far (>1.5 kpc away) from, and unrelated to the close environment of SN 2005cz. Moreover, this emission is more likely to be associated with an AGN in the nucleus, rather than trace SF activity. Other star formation tracers (HST imaging of young massive stars, UV, R-band imaging and host galaxy spectrum) show no evidence for SF in the galaxy, and particularly close to the reported location of the SN. The UV emission data could trace stars down to lower mass than H emission (e.g. Gogarten et al., 2009). Therefore, while H emission may not be detected in older SF regions, in which core-collapse SNe from progenitors of may explode, they should still present significant UV emission. The lack of such UV emission therefore suggests that recent SF activity has not occurred in this galaxy, and in particular close to the location of SN 2005cz. In addition, the overall structure and colors of the host galaxy show no evidence of recent SF in the last Gyr. The HST data exclude very massive progenitors, suggested to be the progenitors of type Ib SNe, and show no evidence for massive young clusters or supergiants near the SN location.
In principle, a massive progenitor could have formed far from the observed SN location, and later have been ejected at high velocity to explode far from its birth place. Since we find no evidence for SF even up to 1 kpc from the SN location, such a star should have been a runaway star to form so far (velocities of 30-100 km s-1, for a lifetime of 10-40 Myr). According to Kawabata et al. (2010) the progenitor is suggested to be a binary star. However, runaway (or hypervelocity) binary stars, especially massive ones as required for a SN progenitor, are rare (Leonard & Duncan, 1990; Perets, 2009; Perets et al., 2010; Perets & Subr, 2010). Therefore, although possible in principle, such a scenario would require fine tuned conditions.
Taken together, the analysis of UV and H emission, the spectrum of the host galaxy NGC 4589, the 2MASS and RCS photometry as well as out HST data, show no evidence for recent SF near the location of SN 2005cz or even at large distances from it.
We conclude that our results strongly disfavor a young massive-star progenitor for SN 2005cz. These results are consistent with the host galaxy type of other Ca-rich faint type Ib SNe, found to be biased towards early type galaxies (Perets et al., 2010). Moreover, the only SNe of types II or Ib/c ever to be found in elliptical galaxies (SNe 2000ds and 2005cz) are both faint Ca-rich type Ib SNe similar to SN 2005E (Hakobyan et al., 2008; Perets et al., 2010). This provides additional support to the suggested origin of these SNe from a helium detonation in a WD-WD binary system, i.e. from a low mass old progenitor rather than a core-collapse of a young massive star.
References
- Anderson & James (2009) Anderson, J. P. & James, P. A. 2009, MNRAS, 399, 559
- Cardelli et al. (1989) Cardelli, J. A., Clayton, G. C., & Mathis, J. S. 1989, ApJ, 345, 245
- Chu & Gruendl (2008) Chu, Y.-H. & Gruendl, R. A. 2008, in Astronomical Society of the Pacific Conference Series, Vol. 387, Massive star formation: Observations confront theory, ed. H. Beuther, H. Linz, & T. Henning (ASP), 415
- Corwin et al. (1994) Corwin, Jr., H. G., Buta, R. J., & de Vaucouleurs, G. 1994, AJ, 108, 2128
- Crockett et al. (2007) Crockett, R. M. et al. 2007, MNRAS, 381, 835
- Crowther (2007) Crowther, P. A. 2007, ARA&A, 45, 177
- Da Rio et al. (2010) Da Rio, N., Gouliermis, D. A., & Gennaro, M. 2010, ApJ, 723, 166
- Dimai et al. (2005) Dimai, A. et al. 2005, IAU Circ., 8569, 1
- Dolphin (2000) Dolphin, A. E. 2000, PASP, 112, 1397
- Drilling & Landolt (2000) Drilling, J. S. & Landolt, A. U. 2000, Normal Stars, 381–+
- Eldridge & Tout (2004) Eldridge, J. J. & Tout, C. A. 2004, MNRAS, 348, 201
- Eldridge & Vink (2006) Eldridge, J. J. & Vink, J. S. 2006, A&A, 452, 295
- Jeffries (2009) Jeffries, R. D. 2009, IAU Symposium, 258, 95
- Filippenko (1997) Filippenko, A. V. 1997, ARAA, 35, 309
- Fioc & Rocca-Volmerange (1997) Fioc, M. & Rocca-Volmerange, B. 1997, A&A, 326, 950
- Gogarten et al. (2009) Gogarten, S. M., et al. 2009, ApJ, 691, 115
- Goudfrooij et al. (1994) Goudfrooij, P. et al. 1994, A&AS, 105, 341
- Hakobyan et al. (2008) Hakobyan, A. A. et al. 2008, A&A, 488, 523
- Ho et al. (1997) Ho, L. C., Filippenko, A. V., & Sargent, W. L. W. 1997, ApJS, 112, 315
- Holtzman et al. (1995) Holtzman, J. A. et al. 1995, PASP, 107, 1065
- Kawabata et al. (2010) Kawabata, K. S. et al. 2010, Nature, 465, 326
- Kennicutt (1998) Kennicutt, Jr., R. C. 1998, ARA&A, 36, 189
- Kobulnicky & Fryer (2007) Kobulnicky, H. A. & Fryer, C. L. 2007, ApJ, 670, 747
- Kroupa (2001) Kroupa, P. 2001, MNRAS, 322, 231
- Kundu et al. (1999) Kundu, A. et al. 1999, ApJ, 513, 733
- Le Borgne & Rocca-Volmerange (2002) Le Borgne, D. & Rocca-Volmerange, B. 2002, A&A, 386, 446
- Leonard & Duncan (1990) Leonard, P. J. T. & Duncan, M. J. 1990, AJ, 99, 608
- Maund & Smartt (2005) Maund, J. R. & Smartt, S. J. 2005, MNRAS, 360, 288
- Meynet & Maeder (2005) Meynet, G. & Maeder, A. 2005, A&A, 429, 581
- Moellenhoff & Bender (1989) Moellenhoff, C. & Bender, R. 1989, A&A, 214, 61
- Neill et al. (2009) Neill, J. D. et al. 2009, ApJ, 707, 1449
- Perets (2009) Perets, H. B. 2009, ApJ, 698, 1330
- Perets & Subr (2010) Perets, H. B. & Subr, L. 2010, In preparation
- Perets et al. (2010) Perets, H. B. et al. 2010, Nature, 465, 322
- Pflamm-Altenburg et al. (2007) Pflamm-Altenburg, J., Weidner, C., & Kroupa, P. 2007, ApJ, 671, 1550
- Rich et al. (2005) Rich, R. M. et al. 2005, ApJ, 619, L107
- Sandage & Visvanathan (1978) Sandage, A. & Visvanathan, N. 1978, ApJ, 225, 742
- Schilbach & Röser (2008) Schilbach, E. & Röser, S. 2008, A&A, 489, 105
- Schaller et al. (1992) Schaller, G., Schaerer, D., Meynet, G., & Maeder, A. 1992, A&AS, 96, 269
- Schlegel et al. (1998) Schlegel, D. J., Finkbeiner, D. P., & Davis, M. 1998, ApJ, 500, 525
- Schweizer et al. (1990) Schweizer, F. et al. 1990, ApJ, 364, L33
- Shen et al. (2010) Shen, K. J. et al. 2010, ApJ, 715, 767
- Sirianni et al. (2005) Sirianni, M. et al. 2005, PASP, 117, 1049
- Skrutskie et al. (2006) Skrutskie, M. F. et al. 2006, AJ, 131, 1163
- Smith & Maeder (1989) Smith, L. F. & Maeder, A. 1989, A&A, 211, 71
- Sullivan et al. (2006) Sullivan, M. et al. 2006, ApJ, 648, 868
- Sullivan et al. (2010) —. 2010, MNRAS, 755
- Waldman et al. (2010) Waldman, R. et al. 2010, ArXiv:1009.3829
- Wyder et al. (2007) Wyder, T. K. et al. 2007, ApJS, 173, 293
- Yi et al. (2005) Yi, S. K. et al. 2005, ApJ, 619, L111