11email: filgas@mpe.mpg.de 22institutetext: Universe Cluster, Technische Universität München, Boltzmannstraße 2, D-85748 Garching, Germany 33institutetext: INAF - IASF di Bologna, via Gobetti 101, I-40129, Bologna, Italy 44institutetext: Thüringer Landessternwarte Tautenburg, Sternwarte 5, D-07778 Tautenburg, Germany 55institutetext: INAF - Osservatorio Astronomico di Roma, via di Frascati 33, I-00040, Monteporzio Catone (Roma), Italy 66institutetext: INAF - Osservatorio Astronomico di Brera, via Bianchi 46, I-23807, Merate, Italy 77institutetext: European Southern Observatory, Karl-Schwarzschild-Straße 2, D-85748 Garching, Germany 88institutetext: Institute of Astronomy, University of Cambridge, Madingley Road CB3 0HA, Cambridge, UK 99institutetext: Department of Physics and Astronomy, Clemson University, Clemson, SC 29634-0978, United States of America
The two-component jet of GRB 080413B
Abstract
Aims. The quick and precise localization of GRBs by the Swift telescope allows the early evolution of the afterglow light curve to be captured by ground-based telescopes. With GROND measurements we can investigate the optical/near-infrared light curve of the afterglow of gamma-ray burst 080413B in the context of late rebrightening.
Methods. Multi-wavelength follow-up observations were performed on the afterglow of GRB 080413B. X-ray emission was detected by the X-ray telescope onboard the Swift satellite and obtained from the public archive. Optical and near-infrared photometry was performed with the seven-channel imager GROND mounted at the MPG/ESO 2.2 m telescope and additionally with the REM telescope, both in La Silla, Chile. The light curve model was constructed using the obtained broad-band data.
Results. The broad-band light curve of the afterglow of GRB 080413B is well fitted with an on-axis two-component jet model. The narrow ultra-relativistic jet is responsible for the initial decay, while the rise of the moderately relativistic wider jet near its deceleration time is the cause of the rebrightening of the light curve. The later evolution of the optical/NIR light curve is then dominated by the wide component, the signature of which is almost negligible in the X-ray wavelengths. These components have opening angles of and , and Lorentz factors of and . We calculated the beaming-corrected energy release to be erg.
Key Words.:
gamma rays: bursts - ISM: jets and outflows - X-rays: individuals: GRB 080413B1 Introduction
Gamma-ray burst (GRB) afterglows are commonly interpreted in the framework of the standard synchrotron shock model, in which an ultra-relativistic shock is expanding into the ambient medium swept up by the blast wave (Mészáros meszaros2 (2002); Zhang & Mészáros zhang3 (2004); Piran piran (1999)). For the simplified assumption that the shock front is spherical and homogeneous, a smooth afterglow light curve is expected. This smooth power-law decay with time was a common phenomenon in most of the pre-Swift GRBs (Laursen & Stanek laursen (2003)), because the afterglow observations typically began 1 day after the burst compared to now when we can be on-target within minutes.
The Swift satellite (Gehrels et al. gehrels (2004)) allows studies of the early afterglow phase thanks to its rapid slew, a precise localization of GRBs with its Burst Alert Telescope (BAT, Barthelmy et al. barthelmy (2005)), and the early follow-up with two telescopes sensitive at X-ray (XRT, Burrows et al. burrows (2005)) and ultraviolet/optical (UVOT, Roming et al. roming (2005)) wavelengths. Since its launch in 2004, Swift, together with ground-based follow-up telescopes, has provided many early and well-sampled afterglow light curves deviating from the smooth power-law decay (Panaitescu et al. panaitescu3 (2006); Nousek et al. nousek (2006); Zhang et al. zhang2 (2006); Panaitescu et al. 2006b ). Such variability can shed light on the central engine and its surroundings.
Several major scenarios have been proposed for afterglow variability. The reverse shock emission might add to the emission from the forward shock (see §4.1, Sari & Piran sari2 (1999); Mészáros & Rees meszaros (1993); Zhang et al. zhang (2003); Kobayashi & Zhang kobayashi (2003)), the shock might be refreshed by slower shells catching up with the decelerating front shells (see §4.2, Rees & Mészáros rees (1998); Panaitescu panaitescu2 (2005); Sari & Mészáros sari3 (2000); Panaitescu et al.panaitescu (1998); Granot et al. granot2 (2003); Kumar & Piran kumar (2000)), the ambient density profile into which the blast wave expands might not be homogeneous (see §4.3, Lazzati et al. lazzati (2002); Nakar et al. nakar2 (2003); Zhang et al. zhang2 (2006); Nakar & Piran nakar3 (2003); Ioka et al. ioka (2005); Wang & Loeb wang (2000); Dai & Lu dai (2002),;Nakar & Granot nakar (2007)), or the jet may have an angular structure different from a top hat (see §4.4, Peng et al. peng (2005); Granot et al. granot (2006); Berger et al. berger (2003); Racusin et al. racusin2 (2008)).
Here we provide details of the Swift, GROND, and REM observations of the afterglow of GRB 080413B and test the above alternative scenarios for consistency with these data. Throughout the paper, we adopt the convention that the flux density of the GRB afterglow can be described as .
2 Observations
2.1 Swift
The Swift/BAT triggered by the long GRB 080413B at 08:51:12 UT started slewing to the burst after 70 seconds (Stamatikos et al. stamatikos (2008)). The mask-weighted light curve shows a single FRED-like peak starting at s, peaking at s, and returning to baseline at s. The measured (15-350 keV) is s (Barthelmy et al. barthelmy2 (2008)). The BAT prompt emission spectrum was fitted using the Band function with a photon index of and an keV (Krimm et al. krimm (2009)). By integrating the GRB spectrum using the Band function, we estimate the event fluence in the 15-150 keV energy range to be erg/cm2 (Krimm et al. krimm (2009)). With a standard concordance cosmology ( km/s/Mpc, = 0.27, , Komatsu et al. komatsu (2009)), and a redshift of (Fynbo et al. fynbo (2009)), the bolometric (1keV - 10MeV) energy release of GRB 080413B is erg, with a rest-frame of 150 keV. The difference between this value and the value in Krimm et al. (krimm (2009)) is only due to different set of cosmological parameters used.
The Swift/XRT started observations of the field of GRB 080413B 131.2 s after the trigger (Stamatikos et al. stamatikos (2008); Troja & Stamatikos troja (2008)). XRT data were obtained from the public Swift archive and reduced in the standard manner using the xrtpipeline task from the HEAsoft package, with response matrices from the most recent CALDB release. The XRT light curve was obtained from the XRT light curve repository (Evans et al. evans (2007), Evans et al. evans2 (2009)). Spectra were grouped using the grppha task and fitted with the GROND data in XSPEC v12 using statistics. The combined optical/X-ray spectral energy distributions were fitted with power-law and broken power-law models and two absorbing columns: one Galactic foreground with a hydrogen column of cm-2 (Kalberla et al. kalberla (2005)) and another one that is local to the GRB host galaxy at . Only the latter was allowed to vary in the fits. To investigate the dust reddening in the GRB environment, the zdust model was used, which contains Large and Small Magellanic Clouds (LMC, SMC) and Milky Way (MW) extinction laws from Pei (pei (1992)).
2.2 REM
The Rapid Eye Mount (REM, Zerbi et al. zerbi (2001)) 60 cm robotic telescope, located at the ESO La Silla observatory (Chile), reacted promptly and began observing GRB 080413B on April 13 08:52:13 UT, about 76 s after the GRB trigger time. A transient source was detected both in the and bands, and follow–up observations lasted for hr. The afterglow is well detected only up to about 300 s, then its brightness falls below the instrument detection limits in both filters.
Each single -band observation was performed with a dithering sequence of five images shifted by a few arcsec. These images are automatically elaborated using the jitter script of the eclipse (Devillard devillard (1997)) package. The script aligns the images and co-adds all the frames to obtain one average image for each sequence. The -band images were reduced using standard procedures. A combination of the IRAF111IRAF is the Image Reduction and Analysis Facility made available to the astronomical community by the National Optical Astronomy Observatories, which are operated by AURA, Inc., under contract with the U.S. National Science Foundation. It is available at http://iraf.noao.edu/, and Sextractor packages (Bertin & Arnouts bertin (1996)) were then used to perform aperture photometry.
The photometric calibration for the band was accomplished by applying average magnitude shifts to the ones of bright, isolated, unsaturated stars in the field, as reported in the 2MASS catalog. The optical data were calibrated using instrumental zero points, checked with observations of standard stars in the SA96 Landolt field (Landolt landolt (1992)). All data were then cross-calibrated using GROND photometry to obtain consistent results.
2.3 GROND
The Gamma-Ray burst Optical Near-infrared Detector (GROND, Greiner et al. greiner1 (2008); Greiner et al. greiner2 (2007)) responded to the Swift GRB alert and initiated automated observations at 08:56 UT, 5 minutes after the trigger. A predefined sequence of observations with successively increasing exposure times was executed and images were acquired in the seven photometric bands () simultaneously. The observations continued for two months, and the last of ten epochs was acquired on June 11th, 2008. In total, 191 CCD optical individual frames in each and 2718 NIR images of 10 s exposures in were obtained. The CCD integration time scaled from 45 to 360 s according to the brightness of the optical afterglow.
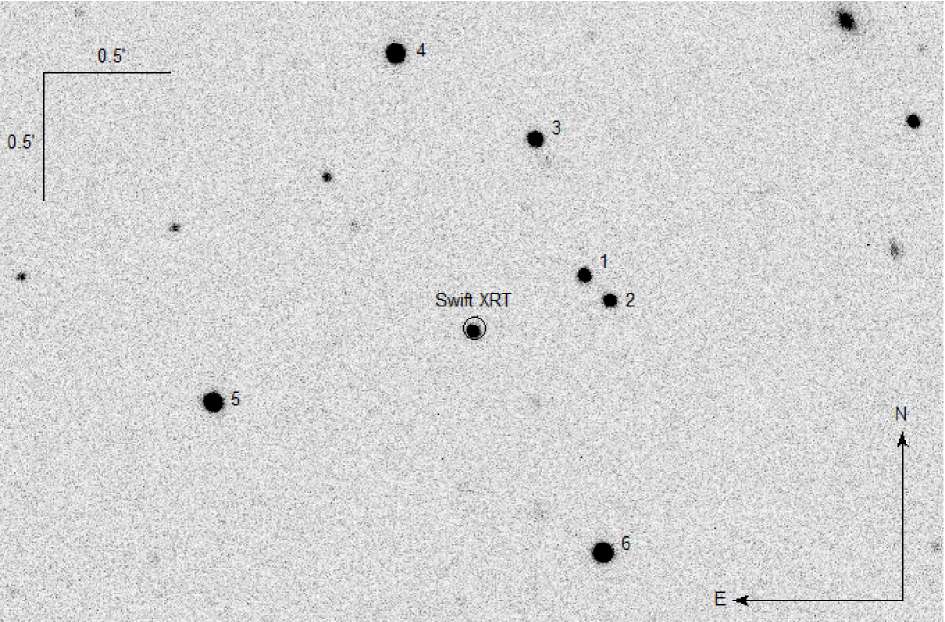
A variable point source was detected in all bands (Krühler et al. 2008a ) by the automated GROND pipeline (Küpcü Yoldaş et al. yoldas (2008)). The position of the transient was calculated to be R.A. (J2000) = 21:44:34.67 and Dec (J2000) = 19:58:52.4 compared to USNO-B reference field stars (Monet et al. monet (2003)) with an astrometric uncertainty of . The afterglow was also observed and detected by the Faulkes Telescope South (Gomboc et al. gomboc (2008)) and Skynet/PROMPT (Brennan et al. brennan (2008)), and spectroscopy was obtained with the GMOS spectrograph on Gemini-South (Cucchiara et al. cucchiara (2008)) and FORS1 on VLT (Vreeswijk et al. vreeswijk (2008)), both determining a redshift of .
The optical and NIR image reduction and photometry were performed using standard IRAF tasks (Tody tody (1993)) similar to the procedure described in detail in Krühler et al. (2008b ). A general model for the point-spread function (PSF) of each image was constructed using bright field stars and fitted to the afterglow. In addition, aperture photometry was carried out, and the results were consistent with the reported PSF photometry. All data were corrected for a Galactic foreground reddening of mag in the direction of the burst (Schlegel et al. schlegel (1998)), corresponding to an extinction of using , and in the case of data, transformed to AB magnitudes.
Optical photometric calibration was performed relative to the magnitudes of six secondary standards in the GRB field, shown in Fig. 1 and Table 3. During photometric conditions, a spectrophotometric standard star, SA112-223, a primary SDSS standard (Smith et al. smith (2002)), was observed within a few minutes of observations of the GRB field. The obtained zeropoints were corrected for atmospheric extinction and used to calibrate stars in the GRB field. The apparent magnitudes of the afterglow were measured with respect to the secondary standards reported in Table 3. The absolute calibration of bands was obtained with respect to magnitudes of the Two Micron All Sky Survey (2MASS) stars within the GRB field obtained from the 2MASS catalog (Skrutskie et al. skrutskie (2006)).
3 Results
3.1 Afterglow light curve
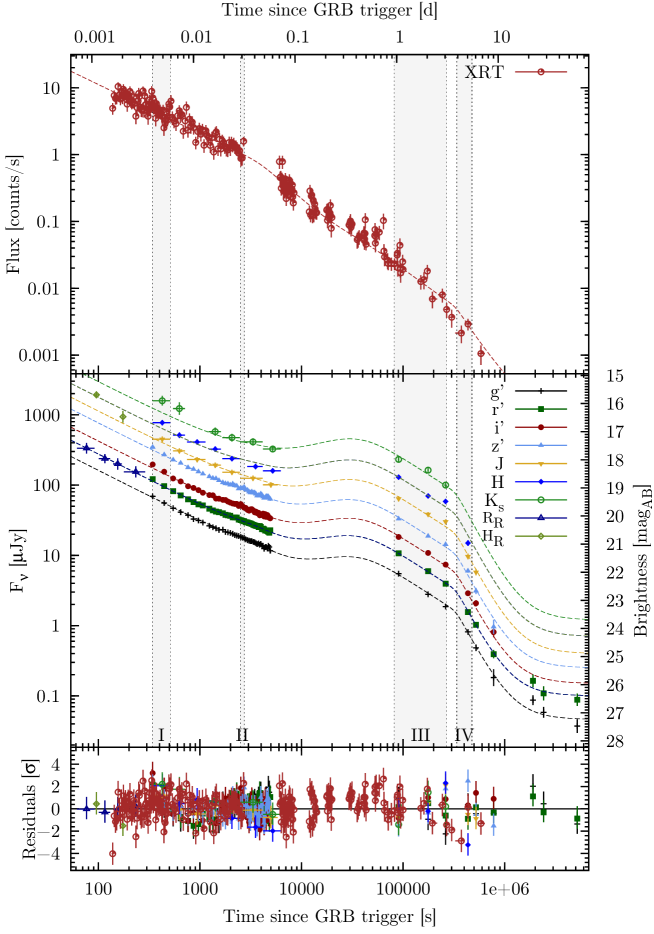
The optical/NIR light curve (Fig. 2) of the afterglow of GRB 080413B shows an initial decay with a temporal slope , followed by a flattening starting at roughly 1 ks. Despite the lack of data between 5 and 90 ks, a comparable brightness at the beginning and at the end of the gap (chromatic fading from mag in the band to mag in the band) suggests a plateau. The light curve then resumes the decay with a steeper temporal slope of until an achromatic break at roughly 330 ks. Owing the achromacity, time, and sharp steepening of the decay, we assume this to be a jet break. After this break the afterglow fades with a steep decay of . The flattening at the end ( Ms) of the light curve suggests a faint host galaxy.
The X-ray light curve shows a different evolution. The initial decay has the same temporal slope as the optical/NIR light curve, but the later plateau phase is missing completely. The time of the break at ks and the decay index after this break is adopted from the optical/NIR data as the X-ray flux does not provide strong constraints in this part of the X- ray light curve.
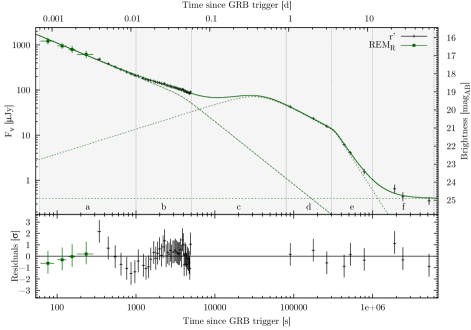
Both light curves were jointly fitted with an empirical model consisting of three components (see Fig 3). The first component is composed of two smoothly connected power-laws. The second component was needed to model the later rebrightening and uses three smoothly connected power-laws. The flattening in the latest part was modeled with a constant flux. As a result of the high accuracy of the data and good sampling in the time domain, most parameters were left free to vary and are presented in Table 4.
The only fixed parameters were the smoothnesses of all breaks connecting the power-laws and the flux of the host galaxy in filters without a detection in the latest flattening phase ( and ). The smoothness was fixed to a value of in two cases where the power-law decay was steepening in order to be consistent with the smoothness of a jet break (Zeh et al. zeh (2006)) and to a value of in the place of the peak of the second component. The flux of the host was fixed to values that assume an achromatic afterglow evolution, though this is probably not quite correct, as the host is expected to have different colors than the afterglow.
The optical/NIR light curve (Fig. 2) of the afterglow of GRB 080413B can be divided into six segments and , based on the temporal indices shown in Fig. 3. We assign segment to the first, and segments to the second component. Segment is the prompt decay dominated by the first component. In segment we see the rising influence of the second component, which then dominates the rest of the later optical light curve and peaks in the third segment . The best fit in the segment is a plateau-like evolution without any sharp flares. Though we have no data points in this segment, magnitudes from Gomboc et al. (gomboc (2008)) are in good agreement with this interpretation. Segments and are fully dominated by the second component with segments and showing the rising influence of the constant flux, which we interpret as the host galaxy. This host galaxy was detected in the and bands, but the stellar mass is not constrained by the optical identification obtained by GROND because observations probe the rest-frame wavelengths below the 4000 Åbreak, where the mass-to-light ratio can vary by a factor of more than 100. The X-ray light curve shows a significantly different evolution, mainly due to a much lower contribution from the second component to the total flux. The absence of the rebrightening part gives evidence of the flux from the second component being stronger in optical wavelengths and nearly negligible in X-rays. This suggests a different physical origin for each component.
3.2 Broad-band spectrum
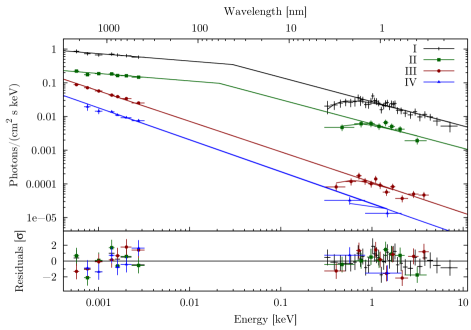
The afterglow spectrum can be parameterized over a broad wavelength range using X-ray, optical, and NIR data. Broad-band spectral energy distributions (SED, Fig. 4) were constructed at four different time intervals, which are indicated in the light curve (Fig. 2). Fit parameters of these SEDs are presented in Table 5.
As already evident from the lack of the plateau phase in the X-ray light curve, there is a spectral evolution between data from the time intervals II and III. The two last optical/NIR SEDs (III and IV) are consistent with a power-law with a spectral index consistent with the X-ray spectral index without strong signatures of any curvature. There is also no evidence of any spectral evolution between SEDs before and after the break at ks, providing more evidence of an achromatic jet break. Both the optical/NIR and X-ray emission in these two latest phases probe the same segment of the afterglow synchrotron spectrum with a spectral slope .
SEDs of phases I and II show evidence of a synchrotron cooling break between the X-ray and optical/NIR frequencies. We fixed the difference in values between optical/NIR and X-ray spectral indices to 0.5 (as predicted by the standard fireball model; Sari et al. sari4 (1998)) but the values come from the fitting. This produced a cooling break that showed a slight drift to lower frequencies with time. However, the error on the cooling break frequency is too large to claim any trend, and the cooling break is therefore consistent with being constant as well. We note that this possible cooling break passage through the optical/NIR bands cannot be the cause of rebrightening as it would have the opposite effect, i.e. a steepening of the decay (Sari et al. sari4 (1998)).
3.3 Closure relations
The optical/NIR temporal index of the segment is consistent within 3 errors with the closure relations (Granot & Sari granot3 (2002); Dai & Cheng dai2 (2001); Zhang & Mészáros zhang3 (2004); Racusin et al. racusin (2009)) for a normal decay in the regime, where the jet is interacting with a homogeneous ISM and is in the slow cooling phase. The corresponding power-law index of electron energy distribution is very hard. The X-ray temporal and spectral slopes in the segment are inconsistent with any closure relations. While the spectral slope is different from that in the optical/NIR wavelengths, the temporal slopes are similar.
The temporal index of the second power-law of the first component after the break is within 1 consistent with the closure relations for a post-jet break decay in the regime, where the jet is interacting with a homogeneous ISM and does not spread. The X-ray slopes are again inconsistent with any closure relations.
The initial decay of the second component in segment with an index of is consistent (within 1) with the closure relations for the normal (pre-jet break) decay in the regime for a homogeneous ISM and slow cooling case. The corresponding electron energy distribution index is still rather hard but closer to the values typical of GRBs. The late temporal decay is not constrained well by the data, but it is relatively steep and consistent with being achromatic. Fixing the break to be rather sharp (Zeh et al. zeh (2006)) results in a decay with a temporal index of , indicative of a post jet break evolution and a break time of roughly 330 ks. This light curve slope, however, is not consistent with any closure relation, which might be, at least partially, the result of the parameter fixing in the light curve fitting.
4 Discussion
Rebrightenings of the afterglow light curves are generally associated with density inhomogeneities in the circumburst medium or with different forms of late energy injections. In this section we discuss various possible models for interpreting the optical/NIR rebrightening and conclude that the data require the two-component jet model to explain all the light curve features.
4.1 Reverse shock emission
When the relativistic shell of the fireball ejecta encounters the interstellar medium, the reverse shock propagates back into the shocked material and can produce a bright optical flash (Sari & Piran sari2 (1999); Mészáros & Rees meszaros (1993)). This emission peaks very early, before the emission from the forward shock, and has a steep temporal decay index (Zhang et al. zhang (2003); Kobayashi & Zhang kobayashi (2003)). The reverse shock is therefore inconsistent with being the source of the late emission during the plateau phase in segment since this emission peaks at several hours after the burst. A second scenario would be that the initial light curve emission in segment was the reverse shock component decay and the later plateau was the result of the forward shock emission reaching a peak followed by its slow decay, which would then dominate the later light curve (segments ). However, the shallow temporal index during the initial decay in segment is incompatible with emission from a reverse shock. The light curve of the afterglow is therefore incompatible with emission from reverse shocks.
4.2 Refreshed shock emission
Refreshed shocks are produced when slower shells with a lower Lorentz factor catch up with the afterglow shock at late times (Rees & Mészáros rees (1998); Panaitescu panaitescu2 (2005); Sari & Mészáros sari3 (2000); Panaitescu et al.panaitescu (1998)). Each collision then causes a rebrightening in the afterglow light curve. After the rebrightening, the afterglow resumes its original decay slope (Granot et al. granot2 (2003)). However, these rebrightenings are generally achromatic (Kumar & Piran kumar (2000)) as the slow shell reenergizes the forward shock, which is responsible for both X-ray and optical emission. Therefore, a refreshed shock could not create the chromatic rebrightening in the light curve of the afterglow after the initial decay. Different temporal indices before and after this event moreover exclude refreshed shocks as a feasible explanation for the evolution of the light curve.
4.3 Inhomogeneous density profile of the ISM
Variations in the external density provide a possible explanation for the temporal variability of the GRB afterglow light curves within the external shock framework (Lazzati et al. lazzati (2002); Nakar et al. nakar2 (2003); Zhang et al. zhang2 (2006); Nakar & Piran nakar3 (2003); Ioka et al. ioka (2005); Wang & Loeb wang (2000); Dai & Lu dai (2002)). Such variations might be the result of the interstellar medium turbulence or variability in the winds from the progenitor. The first case might be characterized by either an abrupt change in the radial density or density clumps on top of a smooth background. The latter can be a case of the wind termination shock, which is an abrupt increase in the radial density between wind environments of two evolutionary stages of the massive progenitor. Models suggest that these inhomogeneities will have a clear observational signature in the form of the optical afterglow light curve rebrightening.
The initial decay of the light curve of GRB 080413B is a smooth power-law with . At d becomes positive over a factor in time. According to Nakar & Granot (nakar (2007)) and van Eerten et al. (eerten (2009)), such a large increase in over a relatively small factor in time is not expected from variations in the external density. Even though our temporal index during the rebrightening is based on the fit alone, real data before and after this gap show that a smooth power law connected with very sharp breaks and with a temporal index very near zero would be needed to connect these data points without a rebrightening with a peak. While the wind termination shock could explain the lack of the rebrightening feature in X-ray band, the expected increase in temporal index above the cooling frequency is too small to be compatible with our optical light curve.
4.4 Two-component jet
The generic two-component jet model consists of a narrow and highly relativistic jet, responsible for the prompt afterglow emission, and of a wider and moderately relativistic jet, dominant in the later afterglow emission (Peng et al. peng (2005); Granot et al. granot (2006); Berger et al. berger (2003); Racusin et al. racusin2 (2008)). For an on-axis geometry, the resulting afterglow light curve is a superposition of these two components, where the decelerating narrow jet creates the initial decay and the wide jet dominates the later emission that rises during the pre-deceleration phase, followed by the shallow decay with a possible jet break. The relative energies and jet structure then define the light curve morphology.
The light curve is well-fitted (red. ) with the sum of the two components that we relate to the two afterglow jets, where both are viewed on-axis and are coaxial. The initial shallow decay phase of segment could be the result of the emission of the decelerating narrow jet. Given that we do not see any rising part in the early light curve and that even the very early data from the REM telescope have the same decay slope as the later GROND data, we can safely assume that we see the narrow jet on-axis. From the time of the jet break at around ks, we can calculate the opening angle (Sari et al. 1999b ) of the narrow jet as , substituting the measured quantities and normalizing to the typical values cm-3 and (Bloom et al. bloom (2003)). Assuming the time of the first band data point to be upper limit on the time of the emission peak, we calculate the initial Lorentz factor (Molinari et al. molinari (2007)) to be . These values lead to the beaming factor and the true gamma-ray energy release (Frail et al. frail (2001); Bloom et al. bloom (2003)) of and erg.
The wide-jet component might be responsible for the rebrightening starting at around 10 ks. However, this second component is visible even earlier in the initial decay phase, where the light curve gets shallower (segment ). The initial rising temporal index is compatible with the jet decelerating in the circumburst medium. The wide jet is therefore seen on-axis as well, and both jets can be considered coaxial. The jet break at roughly 330 ks indicates an opening angle of the wide jet of . The initial Lorentz factor, corresponding to the peak of the second jet at 37 ks, is then .
5 Conclusions
In this paper we study the optical/NIR light curve produced by the afterglow of GRB 080413B. The possibility that the jet of this GRB might have a narrow ultra-relativistic core and a wider, mildly relativistic outer component has been indicated by the observation of the afterglow emission. An on-axis coaxial two-component jet model provides a consistent description of the properties of GRB 080413B, and can additionally explain the wide range of light curve evolutions, the difference between optical/NIR and X-ray light curves, and the chromatic evolution of the optical light curve itself.
The comparison with the two most prominent light curves modeled by the two-component jet to date - GRB 050315 and GRB 080319B - reveal consistency with the GRB 080413B afterglow light curve. The X-ray light curve of the afterglow of GRB 050315 (Granot et al. granot (2006); Nousek et al. nousek (2006)) shows a remarkable resemblance to the optical/NIR light curve evolution of the afterglow of GRB 080413B. If we neglect the very steep tail of the prompt GRB emission, the initial XRT light curve of GRB 050315 is dominated by the narrow jet, followed by a slight rebrightening at around 1.5 ks caused by the wide jet in its pre-deceleration phase. After the peak, the light curve decay is dominated by the emission from the wide jet. Times of jet breaks of narrow ( ks) and wide ( ks) components, as well as their opening angles (Granot et al. granot (2006)), are within an order comparable with those of GRB 080413B.
The X-ray light curve of the naked-eye GRB 080319B (Racusin et al. racusin2 (2008)) shows similar evolution. The narrow jet dominates the first ks of the afterglow. After the narrow jet decays, the wide jet dominates the late afterglow. There is no rising part of the wide jet and thus no sharp rebrightening or plateau, so the wide jet merely makes the decay flatter. The optical light curve is missing the emission from the narrow jet, suggesting that the optical flux from the wide jet must be much stronger than that of the narrow jet. The jet break of the narrow jet at ks, which corresponds to an extremely narrow opening angle of , is the earliest of these three bursts. The jet break of the wide component with opening angle is, on the other hand, the latest at roughly 1 Ms. In general, the X-ray light curves of GRBs 050315, 080319B and the optical light curve of GRB 080413B are very similar. However, the afterglow of GRB 080413B is the only one showing both components in the optical/NIR wavelengths, while the emission from the wide jet in the X-rays is negligible. The X-ray flux from the wide jet must then be much less prominent than for the narrow jet.
Following this line of reasoning the relative fluxes in optical/NIR and X-ray of the narrow and wide jets can be explained in the following way. The SED of the narrow jet (intervals I and II) shows a break, while that of the wider jet does not. For both jets we have argued that we cover the slow cooling regime. The spectral slope of the wide component implies that the cooling break is at frequencies below the near-infrared bands. Both the cooling frequency and the maximum power depend on the product of Lorentz factor of the shocked fluid and the magnetic field strength. It is generally assumed that the narrow jet comes with a larger Lorentz factor than the wide one, and a similar assumption can be reasonably made about the (self-created) magnetic field. The SEDs of the two jets show us that the product of the wide jet, and consequently also the emission at X-ray energies, are at least a factor 100 less than for the narrow one. Therefore, the wide jet does not contribute to the X-ray emission in any significant way. The situation is different in the optical/NIR since cooling break of the narrow jet leads to a reduced flux by a factor of 10 relative to a spectrum with no cooling break between the optical/NIR and X-rays. Consequently, the optical/NIR emission of the wide jet is much more prominent than for the narrow jet.
The values derived from the modeling of GRB 080413B afterglow are fairly consistent with the collapsar jet breakout model of Zhang et al. (2004b ), where the numerical simulations predict , for the narrow component and , for the wide component (Peng et al. peng (2005)). The characteristic Lorentz factors are very similar to those of the hydromagnetically accelerated, initially neutron-rich jet model of Vlahakis et al. (vlahakis (2003)), where and . These two models are distinguished by the ratio of the kinetic energy injected into the two components. For values typical of the collapsar model (), Peng et al. (peng (2005)) predict that the contribution of the narrow component dominates at all times. However, for (as in the neutron-rich hydromagnetic model), the narrow component dominates at early times but the contribution of the wide jet becomes dominant around the deceleration time of the wide jet. If , the jet break of the narrow jet could be masked by the rise (and subsequent dominance) of the flux from the wide jet as the deceleration time of the wide component is approached. That the only visible jet break in the optical light curve is the one of the wide jet may lead to overestimating the emitted gamma-ray energy if the opening angle of the wide jet is used in converting the measured energy into the beaming-corrected energy (see Peng et al peng (2005) for detailed discussion). Because the deceleration time of the wide component is much longer than for the narrow component, a bump is expected to show up in the decaying light curve of the narrow component owing the emission of the wide component at its deceleration time. These predictions are in perfect agreement with our data, suggesting that the two-component jet model can be placed among models that explain the variability in the early light curves of the GRB afterglows.
Acknowledgements.
TK acknowledges support by the DFG cluster of excellence Origin and Structure of the Universe.Part of the funding for GROND (both hardware and personnel) was generously granted from the Leibniz-Prize to Prof. G. Hasinger (DFG grant HA 1850/28-1).
SK and ARossi acknowledge support by DFG grant Kl 766/11-3 and ARossi additionally from the BLANCEFLOR Boncompagni- Ludovisi, née Bildt foundation.
MN acknowledges support by DFG grant SA 2001/2-1.
FOE acknowledges support by the DAAD.
Swift/XRT: This work made use of data supplied by the UK Swift Science Data Centre at the University of Leicester.
We thank the anonymous referee for constructive comments that helped to improve the paper.
References
- (1) Barthelmy, S. D., Barbier, L. M., Cummings, J. R., et al. 2005, Space Science Reviews, 120, 143
- (2) Barthelmy, S. D., Baumgartner, W., Cummings, J. R., et al. 2008, GRB Coordinates Network, 7606, 1
- (3) Berger, E., Kulkarni, S. R., Pooley, G., et al. 2003, Nature, 426, 154
- (4) Bertin, E., & Arnouts, S. 1996, A&AS, 117, 393
- (5) Bloom, J. S., Frail, D. A., & Kulkarni, S. R. 2003, ApJ, 594, 674
- (6) Brennan, T., Reichart, D., Nysewander, M., et al. 2008, GRB Coordinates Network, 7629, 1
- (7) Burrows, D. N., Hill, J. E., Nousek, J. A., et al. 2005, Space Science Reviews, 120, 165
- (8) Cucchiara, A., Fox, D. B., & Cenko, S. B. 2008, GRB Coordinates Network, 7615, 1
- (9) Dai, Z. G., & Cheng, K. S. 2001, ApJ, 558, L109
- (10) Dai, Z. G., & Lu, T. 2002, ApJ, 565, L87
- (11) Devillard, N., ”The eclipse software”, The messenger No 87 - March 1997
- (12) van Eerten, H. J., Meliani, Z., Wijers, R. A. M. J., & Keppens, R. 2009, MNRAS, 398, L63
- (13) Evans, P. A., Beardmore, A. P., Page, K. L., et al. 2007, A&A, 469, 379
- (14) Evans, P. A., Beardmore, A. P., Page, K. L., et al. 2009, MNRAS, 397, 1177
- (15) Frail, D. A., Kulkarni, S. R., Sari, R., et al. 2001, ApJ, 562, L55
- (16) Fynbo, J. P. U., Jakobsson, P., Prochaska, J. X., et al. 2009, ApJS, 185, 526
- (17) Gehrels, N., Chincarini, G., Giommi, P., et al. 2004, ApJ, 611, 1005
- (18) Gomboc, A., Guidorzi, C., Melandri, A., et al. 2008, GRB Coordinates Network, 7626, 1
- (19) Granot, J., & Sari, R. 2002, ApJ, 568, 820
- (20) Granot, J., Nakar, E., & Piran, T. 2003, Nature, 426, 138
- (21) Granot, J., Königl, A., & Piran, T. 2006, MNRAS, 370, 1946
- (22) Greiner, J., Bornemann, W., Clemens, C., et al. 2007, The Messenger, 130, 12
- (23) Greiner, J., Bornemann, W., Clemens, C., et al. 2008, PASP, 120, 405
- (24) Ioka, K., Kobayashi, S., & Zhang, B. 2005, ApJ, 631, 429
- (25) Kalberla, P. M. W., Burton, W. B., Hartmann, D., et al. 2005, A&A, 440, 775
- (26) Krimm, H. A., Yamaoka, K., Sugita, S., et al. 2009, ApJ, 704, 1405
- (27) Krühler, T., Greiner, J., Küpcü Yoldaş, et al. 2008, GRB Coordinates Network, 7599, 1
- (28) Krühler, T., Küpcü Yoldaş, Greiner, J., et al. 2008, ApJ, 685, 376
- (29) Kobayashi, S., & Zhang, B. 2003, ApJ, 597, 455
- (30) Komatsu, E., Dunkley, J., Nolta, M. R., et al. 2009, ApJS, 180, 330
- (31) Kumar, P., & Piran, T. 2000, ApJ, 532, 286
- (32) Küpcü Yoldaş, A., Krühler, T., Greiner, J., et al. 2008, American Institute of Physics Conference Series, 1000, 227
- (33) Landolt, A. U. 1992, AJ, 104, 340
- (34) Laursen, L. T., & Stanek, K. Z. 2003, ApJ, 597, L107
- (35) Lazzati, D., Rossi, E., Covino, S., et al. 2002, A&A, 396, L5
- (36) Mészáros, P., & Rees, M. J. 1993, ApJ, 418, L59
- (37) Mészáros, P. 2002, ARA&A, 40, 137
- (38) Molinari, E., Vergani, S. D., Malesani, D., et al. 2007, A&A, 469, L13
- (39) Monet, D. G., Levine, S. E., Canzian, B., et al. 2003, AJ, 125, 984
- (40) Nakar, E., & Piran, T. 2003, ApJ, 598, 400
- (41) Nakar, E., Piran, T., & Granot, J. 2003, New Astronomy, 8, 495
- (42) Nakar, E., & Granot, J. 2007, MNRAS, 380, 1744
- (43) Nousek, J. A., Kouveliotou, C., Grupe, D., et al. 2006, ApJ, 642, 389
- (44) Panaitescu, A., Mészáros, P., & Rees, M. J. 1998, ApJ, 503, 314
- (45) Panaitescu, A. 2005, MNRAS, 363, 1409
- (46) Panaitescu, A., Mészáros, P., Burrows, D., et al. 2006, MNRAS, 369, 2059
- (47) Panaitescu, A., Mészáros, P., Gehrels, N., et al. 2006, MNRAS, 366, 1357
- (48) Pei, Y. C. 1992, ApJ, 395, 130
- (49) Peng, F., Königl, A., & Granot, J. 2005, ApJ, 626, 966
- (50) Piran, T. 1999, Phys. Rep, 314, 575
- (51) Racusin, J. L., Karpov, S. V., Sokolowski, M., et al. 2008, Nature, 455, 183
- (52) Racusin, J. L. Liang, E. W., Burrows, D. N., et al. 2009, ApJ, 698, 43
- (53) Rees, M. J., & Mészáros, P. 1998, ApJ, 496, L1
- (54) Roming, P. W. A., Kennedy, T. E., Mason, K. O., et al. 2005, Space Science Reviews, 120, 95
- (55) Sari, R., Piran, T., & Narayan, R. 1998, ApJ, 497, L17
- (56) Sari, R., & Piran, T. 1999, ApJ, 520, 641
- (57) Sari, R., Piran, T., & Halpern, J. P. 1999, ApJ, 519, L17
- (58) Sari, R., & Mészáros, P. 2000, ApJ, 535, L33
- (59) Schlegel, D. J., Finkbeiner, D. P., & Davis, M. 1998, ApJ, 500, 525
- (60) Skrutskie, M. F., Cutri, R. M., Stiening, R., et al. 2006, AJ, 131, 1163
- (61) Smith, J. A., Tucker, D. L., Kent, S., et al. 2002, AJ, 123, 2121
- (62) Stamatikos, M., Beardmore, A. P., Gehrels, N., et al. 2008, GRB Coordinates Network, 7598, 1
- (63) Tody, D. 1993, Astronomical Data Analysis Software and Systems II, 52, 173
- (64) Troja, E., & Stamatikos, M. 2008, GRB Coordinates Network, 7608, 1
- (65) Vlahakis, N., Peng, F., & Königl, A. 2003, ApJ, 594, L23
- (66) Vreeswijk, P. M., Thoene, C. C., Malesani, D., et al. 2008, GRB Coordinates Network, 7601, 1
- (67) Wang, X., & Loeb, A. 2000, ApJ, 535, 788
- (68) Zeh, A., Klose, S., & Kann, D. A. 2006, ApJ, 637, 889
- (69) Zerbi, R. M., Chincarini, G., Ghisellini, G., et al. 2001, Astronomische Nachrichten, 322, 275
- (70) Zhang, B., Kobayashi, S., & Mészáros, P. 2003, ApJ, 595, 950
- (71) Zhang, B., & Mészáros, P. 2004, International Journal of Modern Physics A, 19, 2385
- (72) Zhang, W., Woosley, S. E., & Heger, A. 2004, ApJ, 608, 365
- (73) Zhang, B., Fan, Y. Z., Dyks, J., et al. 2006, ApJ, 642, 354
| [ks] | Exposure [s] | Brightness(a) magAB | |||
|---|---|---|---|---|---|
| 0.0765 | 30 | ||||
| 0.1158 | 30 | ||||
| 0.1549 | 30 | ||||
| 0.2334 | 110 | ||||
| 0.3421 | 35 | ||||
| 0.4441 | 35 | ||||
| 0.5443 | 35 | ||||
| 0.6463 | 35 | ||||
| 0.7646 | 35 | ||||
| 0.8657 | 35 | ||||
| 0.9677 | 35 | ||||
| 1.0679 | 35 | ||||
| 1.2390 | 35 | ||||
| 1.3401 | 35 | ||||
| 1.4394 | 35 | ||||
| 1.5396 | 35 | ||||
| 1.6813 | 35 | ||||
| 1.7824 | 35 | ||||
| 1.8835 | 35 | ||||
| 1.9863 | 35 | ||||
| 2.1021 | 35 | ||||
| 2.2041 | 35 | ||||
| 2.3034 | 35 | ||||
| 2.4062 | 35 | ||||
| 2.5237 | 35 | ||||
| 2.6240 | 35 | ||||
| 2.7242 | 35 | ||||
| 2.8261 | 35 | ||||
| 2.9428 | 35 | ||||
| 3.0439 | 35 | ||||
| 3.1441 | 35 | ||||
| 3.2443 | 35 | ||||
| 3.3566 | 35 | ||||
| 3.4577 | 35 | ||||
| 3.5580 | 35 | ||||
| 3.6599 | 35 | ||||
| 3.7731 | 35 | ||||
| 3.8733 | 35 | ||||
| 3.9735 | 35 | ||||
| 4.0764 | 35 | ||||
| 4.1913 | 35 | ||||
| 4.2924 | 35 | ||||
| 4.3943 | 35 | ||||
| 4.4963 | 35 | ||||
| 4.6172 | 35 | ||||
| 4.7148 | 35 | ||||
| 4.8159 | 35 | ||||
| 4.9179 | 35 | ||||
| 90.3010 | 2733 | ||||
| 176.4193 | 3805 | ||||
| 262.4098 | 3556 | ||||
| 434.6533 | 4046 | ||||
| 522.1878 | 3036 | ||||
| 780.5056 | 3520 | ||||
| 1901.2933 | 2989 | ||||
| 2418.4846 | 7770 | ||||
| 5185.0714 | 6995 | ||||
-
(a)
Not corrected for Galactic foreground reddening.
| [ks] | Exposure [s] | Brightness(a) mag | ||
|---|---|---|---|---|
| 0.0956 | 10 | |||
| 0.1746 | 10 | |||
| 0.4251 | 168 | |||
| 0.6275 | 168 | |||
| 0.9392 | 385 | |||
| 1.4126 | 384 | |||
| 2.0667 | 808 | |||
| 3.3229 | 1637 (1216 for ) | |||
| 4.9974 | 2065 (1650 for ) | |||
| 90.3234 | 2780 | |||
| 176.4426 | 3854 | |||
| 262.4340 | 3605 | |||
| 434.6775 | 4096 | |||
| 522.2111 | 3084 | |||
| 780.5298 | 3567 | |||
| 1901.3193 | 3040 | |||
| 2418.5088 | 7822 | |||
| 5185.0938 | 7041 | |||
-
(a)
Not corrected for Galactic foreground reddening. Converted to AB magnitudes for consistency with Table 1.
-
(a)
For the SED fitting, the additional error of the absolute calibration of 0.07 ( and ) and 0.09 () mag was added.
| Star | R.A., Dec | |||||||
|---|---|---|---|---|---|---|---|---|
| number | [J2000] | (magAB) | (magAB) | (magAB) | (magAB) | (magVega) | (magVega) | (magVega) |
| 1 | 21:44:32.81, 19:58:39.4 | |||||||
| 2 | 21:44:32.38, 19:58:45.1 | |||||||
| 3 | 21:44:33.65, 19:58:07.7 | |||||||
| 4 | 21:44:35.98, 19:57:47.9 | |||||||
| 5 | 21:44:38.98, 19:59:09.2 | |||||||
| 6 | 21:44:32.50, 19:59:44.2 |
| /d.o.f. | ||||||||
|---|---|---|---|---|---|---|---|---|
| DPL(a) | 10 | 462 / 429 | ||||||
| TPL(b) | 2 | 10 |
-
(a)
Smoothly connected double power-law
-
(b)
Smoothly connected triple power-law
| Epoch | Optical/NIR spectral index | X-ray spectral index | Cooling frequency [eV] | N [ cm-2] | /d.o.f |
|---|---|---|---|---|---|
| I | 24/36 | ||||
| II | (frozen) | 16/12 | |||
| III | (frozen) | 23/17 | |||
| IV | (frozen) | 10/6 | |||
-
(a)
Intrinsic hydrogen column density, in excess of the frozen Galactic foreground of cm-2.