11email: alessio@cp.dias.ie
22institutetext: INAF - Osservatorio Astronomico di Roma, via Frascati 33, I-00040 Monte Porzio, Italy
33institutetext: Thüringer Landessternwarte Tautenburg, Sternwarte 5, D-07778 Tautenburg, Germany
44institutetext: INAF - Osservatorio Astrofisico di Arcetri, Largo E. Fermi 5, I-50125 Firenze, Italy
The outburst of an embedded low-mass YSO in L1641 ††thanks: Based on observations collected at the ESO/NTT (082.C-0264), at the REM telescope La Silla, Chile, and at the the Italian Telescopio Nazionale Galileo (TNG), operated on the island of La Palma by the Fundacion Galileo Galilei of the INAF (Istituto Nazionale di Astrofisica) .
Abstract
Context. Strong outbursts in very young and embedded protostars are rare and not yet fully understood. They are believed to originate from an increase of the mass accretion rate () onto the source.
Aims. We report the discovery of a strong outburst in a low-mass embedded young stellar object (YSO), namely 2MASS-J05424848-0816347 or [CTF93]216-2, as well as its photometric and spectroscopic follow-up.
Methods. Using near- to mid-IR photometry and NIR low-resolution spectroscopy, we monitor the outburst, deriving its magnitude, duration, as well as the enhanced accretion luminosity and mass accretion rate.
Results. [CTF93]216-2 increased in brightness by 4.6, 4.0, 3.8, and 1.9 mag in the , , bands and at 24 m, respectively, corresponding to an increase of 20 L☉. Its early spectrum, probably taken soon after the outburst, displays a steep almost featureless continuum, with strong CO band heads and H2O broad-band absorption features, and Br line in emission. A later spectrum reveals more absorption features, allowing us to estimate 3200 K, 0.25 M☉, and 1.210-6 M☉ yr-1. This makes it one of the lowest mass YSOs with a strong outburst so far discovered.
Key Words.:
stars: protostars – ISM: jets and outflows – Infrared: stars – individual: 2MASS-J05424848-0816347 - [CTF93]216-21 Introduction
Most of the stellar mass in low-mass YSOs is assembled within the first 105 yr of their evolution (i. e. class 0, 104 yr, and Class I, 105 yr: see e. g., Lada & Wilking, 1984; Andre et al., 1993). During this stage, the YSO luminosity is thus expected to be dominated by accretion. However, several studies, including the latest Spitzer Space Telescope surveys (e. g., Enoch et al., 2009; Evans et al., 2009), have found that more than 50% of the embedded YSOs have and values considerably lower than those theoretically predicted (i. e. 210-6 M⊙ yr-1 for solar-mass YSOs; Shu, 1977; Terebey et al., 1984) and roughly of the same order of magnitude as the Classical T Tauri stars (CTTs; i. e. 1010-6 M⊙ yr-1; e. g., White & Hillenbrand, 2004). Among several hypotheses, a likely explanation is that the mass accretion is episodic, and the protostars with the lowest luminosities are those observed in quiescent accretion states (Enoch et al., 2009; Evans et al., 2009; Vorobyov, 2009). Non-steady mass accretion is often observed in CTTs, such as EXors and FUors (lasting from a few months to several decades), in which increases by several orders of magnitude up to 10-4 M⊙ yr-1 (Hartmann & Kenyon, 1996). It is thus reasonable to believe that a similar mechanism also exists in earlier and more embedded YSOs. Unfortunately, there is little direct observational evidence of outbursts in Class I YSOs, and so far, only a few clear cases have been detected (e. g. V 1647 Ori outbursts in 2003 and 2008, or OO Ser in 1995; see e. g. Fedele et al., 2007; Kóspál et al., 2007). To reconcile theory with observations and improve the quality of the statistics, it is mandatory to detect and study these rare events.
With this aim, we started a long-term project to monitor the NIR flux and spectroscopic variability of embedded YSOs (mostly Class I and Flat sources) in nearby, young, and active star-forming regions (namely L 1641, CrA, and the Serpens Molecular Cloud). This letter reports the outburst of an embedded YSO in L 1641, namely 2MASS-J05424848-0816347, hereafter [CTF93]216-2 (=05h42m48.48s, =-0816347). This object was identified by our group as a low-mass embedded YSO (spectral type M, circumstellar 18 mag) with a flat spectral index (=0.25, derived by fitting all the photometric data points from 2.2 to 24 m) and a bolometric luminosity of 1.9 L☉ (Caratti o Garatti et al. in prep., hereafter CoG). It has been named [CTF93]216-2, because it is relatively close to [CTF93]216 (Chen et al., 1993; Chen & Tokunaga, 1994), located about 385 SW. Our Spitzer/IRAC images indicate that both YSOs have precessing jets, thus they could be part of a wide binary system (17 300 AU, assuming a distance =450 pc). During our recent survey in October 2010 with the robotic telescope REM (see Section 2), we detected for [CTF93]216-2 a brightness increase of several magnitudes with respect to the 2MASS images. We then compared our new images with the acquisition image in the band and the NIR spectrum of this source acquired in February 2009, discovering that the outburst was already in progress.
2 Observations
NIR spectra were obtained at the ESO-NTT with SofI (Moorwood et al., 1998) (on the 13 Feb. 2009) and at the 3.5-m Italian telescope TNG (13 Oct. 2010) with NICS (Baffa et al., 2001), adopting the usual ABBA configuration. The SofI spectrum was taken with the red grism (1.51-2.5 m), a 06 slit 1000), and a total integration time of 1800 s. The full width half maximum (FWHM) in the dispersion direction, measured from Gaussian fits to the OH sky lines, was 19 (260 km s-1) in the band. The NICS low-resolution spectrum was acquired using a slit width of 1 (600) for the JH and HK grisms (1.15-1.75 m and 1.4-2.5 m, respectively) with a total integration time () of 480 and 160 s for the JH and HK grisms, respectively. The measured FWHM in the dispersion direction was 33 (600 km s-1) in the band. Telluric and spectrophotometric standards were observed to correct for the atmospheric transmission and flux-calibrate the spectra. The wavelength calibrations were performed using a xenon lamp in the infrared.
Most of our , , and images were collected between the 10 October and the 6 November 2010 at the 60-cm robotic telescope REM (Zerbi et al., 2001, ESO La Silla observatory) with the NIR camera REMIR (Conconi et al., 2004) and a 150 s total integration time per filter. An additional band image was obtained with NICS (13 Oct. 2010) with a 18 s total integration time. Additional photometry (5 Nov. 2003) with the near-IR instrument UIST (Ramsay Howat et al., 2004) was retrieved from the UKIRT data archive (=15 s). Moreover, another photometric data point was derived from the band of the SofI acquisition image (=6 s). Early epoch photometry was retrieved from the Two-Micron All Sky Survey (2MASS; Skrutskie et al., 2006, , , band; November 1998) and from the DEep Near-Infrared southern sky Survey (DENIS; Epchtein et al., 1997, and bands; January 1997). All the raw data were reduced using IRAF packages, applying standard procedures for sky subtraction, dome flat-fielding, and bad pixel and cosmic ray removal. Photometric calibration was obtained by means of photometric standard stars, except for the SofI acquisition image and the UIST image, where 2MASS photometry of field stars was used.
Finally, we also used additional Spitzer/IRAC photometric data (3.6, 4.5, 5.8, and 8 m, obtained on the 8 Oct. 2004), MIPS-24 m (taken on the 2 Apr. 2005 and 27 Nov. 2008), MIPS 70 and 160 m (2 Apr. 2005), as well as Spitzer/IRS low-resolution spectroscopy (5.2-39 m, obtained on the 12 Mar. 2007), presented in CoG. Additional SCUBA/JCMT photometry (at 450 and 850 m) was taken from Di Francesco et al. (2008).
3 Results

| Date | JD | Ks | 24 m | ||
|---|---|---|---|---|---|
| (d.m.y) | (2450000+) | (mag) | (mag) | (mag) | (mag) |
| 10.1.1997 | 0458.6 | 16.10.2 | 11.550.1 | ||
| 18.11.1998 | 1135.7 | 16.40.1 | 13.530.02 | 11.760.03 | |
| 5.11.2003 | 2948.8 | 10.90.2 | |||
| 2.4.2005 | 3462.8 | 2.480.1 | |||
| 12.3.2007 | 4172.0 | 2.490.06a𝑎aa𝑎aPhotometry derived from the Spitzer-IRS flux-calibrated spectrum. | |||
| 27.11.2008 | 4798.2 | 0.580.04 | |||
| 13.2.2009 | 4875.5 | 9.550.06b𝑏bb𝑏bPhotometry derived from the SofI flux-calibrated spectrum. | 7.980.05 | ||
| 10.10.2010 | 5479.9 | 11.770.08 | 9.660.05 | 8.130.07 | |
| 12.10.2010 | 5481.9 | 11.830.09 | 9.640.04 | 8.120.05 | |
| 13.10.2010 | 5482.7 | 9.700.05 | |||
| 19.10.2010 | 5488.9 | 11.820.07 | 9.630.06 | 8.150.07 | |
| 28.10.2010 | 5497.8 | 12.010.1 | 9.760.09 | 8.250.1 | |
| 06.11.2010 | 5506.6 | 12.000.07 | 9.700.06 | 8.240.08 |
3.1 Photometry
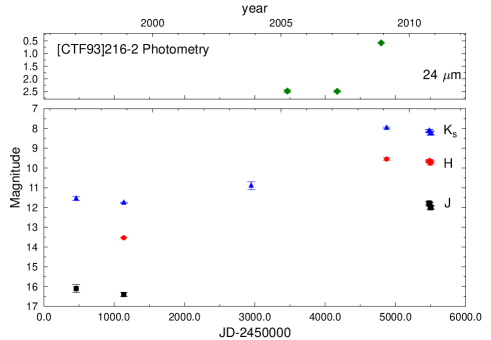
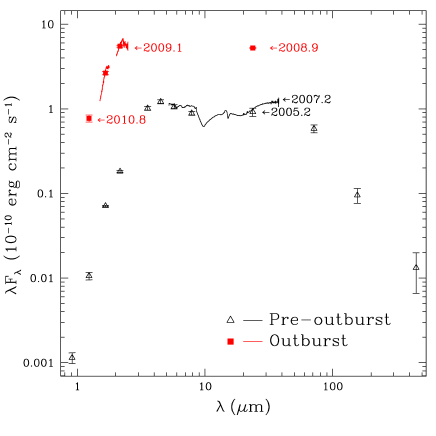
In Figure 1, pre- and outburst images of [CTF93]216-2 in the band (top panels) and the Spitzer/MIPS 24 m band (bottom panels) are shown, clearly indicating an increase in the object brightness. Lightcurves in the , , bands, and at 24 m are shown in Figure 2, and the corresponding photometric data points along with their uncertainties are reported in Table 1. We stress that the photometric data points at 24 m (on the 12 Mar. 2007) and in the band (on the 13 Feb. 2009) were derived from the Spitzer/IRS and from the NTT/SofI flux-calibrated spectra, respectively. The 24 m data points (Fig. 2, upper panel) give us some constraints on the date of the outburst, i. e. after March 2007 and before November 2008. Pre-outburst photometry from DENIS, 2MASS, and the UIST images indicates that the object is variable (in both and bands, we have just one 2MASS data point for the band), as is often the case for YSOs (Carpenter et al., 2001). Comparing 2MASS (November 1998) with our earliest outburst SofI photometry (February 2009), we measure the amplitudes 3.8 mag, and 4 mag, corresponding to a flux increase by a factor of 33 and 40, respectively. Considering our earliest post-burst photometric point in the band (October 2010), we derive 4.6 mag (or F69), whereas the at 24 m is 1.9 mag (F6). Our data do not allow us to determine the exact date of the peak, but it is clear that the NIR lightcurves are still close to the maximum, and that this plateau phase has lasted at least 2 years, with a small decrement in the and bands of about 0.1 mag between February 2009 and October 2010. Moreover, our latest photometry (November 2010) seems to indicate that the rate of decrease, between October and November 2010, has increased to 0.2 mag/month in the band and 0.1 mag/month in the and bands. Pre- and outburst spectral energy distributions (SEDs) are shown in Figure 3, where all available photometric and spectroscopic data (from this work and from CoG) are reported. We note that both the spectral index and bolometric luminosity have changed, as already reported in other YSO outbursts (see e. g. OO Ser, Kóspál et al., 2007). During the outburst, the YSO SED has become bluer and flatter, and the value, computed between 2.2 and 24 m, varied from 0.69 to -0.04. To compute , and estimate the outburst in the Spitzer/IRAC photometry, we fit the dereddened amplitude from 1.25 to 24 m by means of a power law, obtaining (3.6 m)=2.9 mag, (4.5 m)=2.6 mag, (5.8 m)=2.3 mag, and (8 m)=2.1 mag. We also assume that the SED flux experienced no significant increase for 24m. As a result, we estimate an value of 22 L☉ during the outburst, i. e., 20 L☉ with respect to the pre-outburst state.
3.2 Spectroscopy
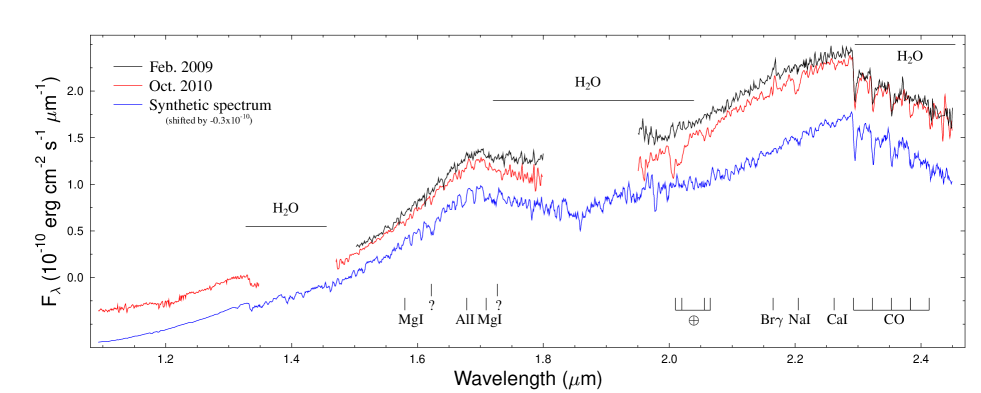
Our SofI and NICS low resolution spectra (taken in February 2009 and October 2010, respectively) are shown in Figure 4 (in black and red).
The SofI spectrum shows an almost featureless continuum, with strong veiling and IR excess. The absorption water band between 1.7 and 2.1 m, typical of M spectral types with a 3800 K, is clearly visible. In addition, deep CO band-head absorption lines are detected at 2.29 m (2-0), 2.32 m (3-1), and 2.35 m (4-2). Finally, Br emission, usually associated with accretion, is observed in our SofI spectrum. The measured Br flux is 9.6(1.8)10-14 erg s-1 cm-2 (EW-3.6 ), peaking at 2.166 m.
The flux of the NICS spectrum, taken 607 days later, shows a slight decrease. The continuum still has a similar shape, but the absorption H2O band depth is more prominent. The EW of the CO lines slightly increases by 1 (9.8 to 10.6 and 7.2 to 8.2 , for the 2-0 and 3-1 band heads, respectively). More CO lines at 2.38 m (5-3), and 2.41 m (6-4) are detected. In addition, a few more narrow-band absorption features become visible on the continuum, i. e. Ca i (2.26 m), the Na i doublet (2.20-2.21 m), Mg i (1.59-1.71 m), and the Al i doublet (1.67-1.68 m). No relevant features are detected in the band, except for the absorption H2O band between 1.3 and 1.5 m. The Br line is not resolved, peaking at 2.166 m. The measured flux is 9(2)10-14 erg s-1 cm-2 (EW-3.7 ). We note that no signature of any emission line (such as H2 or [Fe ii]) from the jet has been detected on-source in both spectra.
To more tightly constrain the YSO spectral type, we separately compared limited regions of our spectra (in the and bands) to model spectra. Veiling and scattering (not taken into account by our fit) are expected to smoothly and slowly vary as a function of wavelength and thus, they should not affect the spectrum in individual bands significantly (e. g., Scholz et al., 2010). For our comparison, we used a series of AMES-DUSTY model spectra (Allard et al., 2001) with ranging from 2500 to 3900 K and log g=4.0, as expected for young stars. We varied to obtain a consistent solution for the two bands, using the =18 mag derived by CoG. We find a reasonable match between observed and model spectra for =3200200 K. As an illustration, the model for 3200 K is shown in Fig. 4 (blue spectrum), shifted by -0.310-10 erg s-1 cm-2 m-1 for clarity.
4 Discussion
Our discovery of the [CTF93]216-2 outburst gives us a rare opportunity to study boosted accretion in young embedded protostars, probing whether episodic mass accretion can reconcile the low accretion rates observed in young embedded protostars with the theoretical predictions.
The Br luminosity, corrected for the circumstellar extinction, is often used to derive an estimate of the accretion luminosity (see e. g. Muzerolle et al., 1998; Natta et al., 2006). Assuming that =183 mag and =450 pc, we derive 3.5(0.9)10-3 L☉ and, from the Muzerolle et al. (1998) relationship, we obtain 228 L☉, which is close to the derived 20 L☉ and indicates that .
On the other hand, can be derived from (Gullbring et al., 1998), where and are the stellar mass and radius, and the number 1.25 is derived by assuming a value of 5 for the inner radius of the accretion disk.
Assuming that =3200200 K and 1.90.1 L☉, from Siess et al. (2000) models, we obtain =0.240.04 M☉ and =4.40.4 R☉, which gives a mass accretion rate of 1.1-1.310-6 M☉ yr-1. While is well constrained by , the radius depends on . Thus this last should be considered as an upper limit, since pre-outburst is unknown. However, even a 50% decrease in would affect and thus of just 20%.
Compared to typical accretion rates of Class I YSOs with similar masses (i. e. 10-8 M☉ yr-1; e. g., CoG; Scholz et al. 2010; White & Hillenbrand 2004), the derived is about two orders of magnitude higher. This value is about an order of magnitude lower than what some episodic-accretion models predict for these early YSO bursts (i .e 10-5 M☉ yr-1; e. g. Vorobyov, 2009), which should resemble the more evolved FUor counterparts. On the other hand, we note that the magnitude of luminosity change during this outburst (10) is similar to those of V 1647 Ori and OO Ser (8). Our object would probably differ from the others in its pre-outburst , which is about two times lower, because of its lower mass. Moreover, as already noted in previous cases (e. g. Hodapp et al., 1996; Fedele et al., 2007; Kóspál et al., 2007), the [CTF93]216-2 outburst shows similarities with both FUor and EXor events, i. e. a NIR featureless FUor spectrum with strong absorption CO band heads, but with Br line in emission as in EXors. The event duration (if confirmed by additional observations) and amplitude are in-between those of EXors and FUors, thus, as noted by other authors (Gibb et al., 2006; Fedele et al., 2007) EXors and FUors might not be distinct categories of eruptive events, but instead part of a continuum of outburst events.
Acknowledgements.
ACG was supported by the Science Foundation of Ireland, grant 07/RFP/PHYF790. We would like to thank Dino Fugazza and Francesca Ghinassi for supporting the REM and TNG observations.References
- Allard et al. (2001) Allard, F., Hauschildt, P. H., Alexander, D. R., Tamanai, A., & Schweitzer, A. 2001, ApJ, 556, 357
- Andre et al. (1993) Andre, P., Ward-Thompson, D., & Barsony, M. 1993, ApJ, 406, 122
- Baffa et al. (2001) Baffa, C., Comoretto, G., Gennari, S., et al. 2001, A&A, 378, 722
- Carpenter et al. (2001) Carpenter, J. M., Hillenbrand, L. A., & Skrutskie, M. F. 2001, AJ, 121, 3160
- Chen & Tokunaga (1994) Chen, H. & Tokunaga, A. T. 1994, ApJS, 90, 149
- Chen et al. (1993) Chen, H., Tokunaga, A. T., & Fukui, Y. 1993, ApJ, 416, 235
- Conconi et al. (2004) Conconi, P., Cunniffe, R., D’Alessio, F., et al. 2004, in SPIE Conference Series, Vol. 5492, SPIE Conference Series, ed. A. F. M. Moorwood & M. Iye, 1602–1612
- Di Francesco et al. (2008) Di Francesco, J., Johnstone, D., Kirk, H., MacKenzie, T., & Ledwosinska, E. 2008, ApJS, 175, 277
- Enoch et al. (2009) Enoch, M. L., Evans, N. J., Sargent, A. I., & Glenn, J. 2009, ApJ, 692, 973
- Epchtein et al. (1997) Epchtein, N., de Batz, B., Capoani, L., et al. 1997, The Messenger, 87, 27
- Evans et al. (2009) Evans, N. J., Dunham, M. M., Jørgensen, J. K., et al. 2009, ApJS, 181, 321
- Fedele et al. (2007) Fedele, D., van den Ancker, M. E., Petr-Gotzens, M. G., & Rafanelli, P. 2007, A&A, 472, 207
- Gibb et al. (2006) Gibb, E. L., Rettig, T. W., Brittain, S. D., et al. 2006, ApJ, 641, 383
- Gullbring et al. (1998) Gullbring, E., Hartmann, L., Briceno, C., & Calvet, N. 1998, ApJ, 492, 323
- Hartmann & Kenyon (1996) Hartmann, L. & Kenyon, S. J. 1996, ARA&A, 34, 207
- Hodapp et al. (1996) Hodapp, K., Hora, J. L., Rayner, J. T., Pickles, A. J., & Ladd, E. F. 1996, ApJ, 468, 861
- Kóspál et al. (2007) Kóspál, Á., Ábrahám, P., Prusti, T., et al. 2007, A&A, 470, 211
- Lada & Wilking (1984) Lada, C. J. & Wilking, B. A. 1984, ApJ, 287, 610
- Moorwood et al. (1998) Moorwood, A., Cuby, J.-G., & Lidman, C. 1998, The Messenger, 91, 9
- Muzerolle et al. (1998) Muzerolle, J., Hartmann, L., & Calvet, N. 1998, AJ, 116, 2965
- Natta et al. (2006) Natta, A., Testi, L., & Randich, S. 2006, A&A, 452, 245
- Ramsay Howat et al. (2004) Ramsay Howat, S. K., Todd, S., Leggett, S., et al. 2004, in SPIE Conference Series, Vol. 5492, SPIE Conference Series, ed. A. F. M. Moorwood & M. Iye, 1160–1171
- Scholz et al. (2010) Scholz, A., Wood, K., Wilner, D., et al. 2010, MNRAS, 1258
- Shu (1977) Shu, F. H. 1977, ApJ, 214, 488
- Siess et al. (2000) Siess, L., Dufour, E., & Forestini, M. 2000, A&A, 358, 593
- Skrutskie et al. (2006) Skrutskie, M. F., Cutri, R. M., Stiening, R., et al. 2006, AJ, 131, 1163
- Terebey et al. (1984) Terebey, S., Shu, F. H., & Cassen, P. 1984, ApJ, 286, 529
- Vorobyov (2009) Vorobyov, E. I. 2009, ApJ, 704, 715
- White & Hillenbrand (2004) White, R. J. & Hillenbrand, L. A. 2004, ApJ, 616, 998
- Zerbi et al. (2001) Zerbi, R. M., Chincarini, G., Ghisellini, G., et al. 2001, Astronomische Nachrichten, 322, 275