A Decline in the Nonthermal X-ray Emission from Cassiopeia A
Abstract
We present new Chandra ACIS-S3 observations of Cassiopeia A which, when combined with earlier ACIS-S3 observations, show evidence for a steady 1.5–2% yr-1 decline in the 4.2–6.0 keV X-ray emission between the years 2000 and 2010. The computed flux from exposure corrected images over the entire remnant showed a 17% decline over the entire remnant and a slightly larger (21%) decline from regions along the remnant’s western limb. Spectral fits of the 4.2-6.0 keV emission across the entire remnant, forward shock filaments, and interior filaments indicate the remnant’s nonthermal spectral powerlaw index has steepened by about 10%, with interior filaments having steeper powerlaw indices. Since TeV electrons, which give rise to the observed X-ray synchrotron emission, are associated with the exponential cutoff portion of the electron distribution function, we have related our results to a change in the cutoff energy and conclude that the observed decline and steepening of the nonthermal X-ray emission is consistent with a deceleration of the remnant’s 5000 km s-1 forward shock of 10–40 km s-1 yr-1.
Subject headings:
acceleration of particles — ISM: individual objects (Cassiopeia A) — radiation mechanisms: non-thermal1. Introduction
Supernova remnants (SNRs) have long been considered to be the primary source of Galactic cosmic-rays (CRs) below the knee of the cosmic-ray spectrum, 1015 eV. TeV -ray observations of SNRs such as RX J1713.7-3946 and RX J0852.0-4622 provide evidence for the acceleration of ions (Aharonian et al., 2007a; Aharonian et al., 2007b). However the TeV emission can also be attributed to inverse-Compton scattering by the same electron population that produces the X-ray synchrotron emission.
Viewed in X-rays, the young ( 330 yr; Fesen et al. 2006) Galactic SNR Cassiopeia A (Cas A) consists of a shell whose emission is dominated by emission lines from O, Si, S, and Fe (e.g., Vink et al., 1996; Hughes et al., 2000; Willingale et al., 2002, 2003; Hwang & Laming, 2003; Laming & Hwang, 2003). Exterior to this shell are faint X-ray filaments which mark the location of the forward shock. The emission found here is nonthermal X-ray synchrotron emission from shock accelerated electrons (Allen et al., 1997; Gotthelf et al., 2001; Vink & Laming, 2003). These forward shock filaments are observed to expand with a velocity of 5000 km s-1 (DeLaney & Rudnick, 2003; Patnaude & Fesen, 2009), assuming a SNR distance of 3.4 kpc (Reed et al., 1995).
Nonthermal emission filaments are also observed in the interior of the SNR and are believed to be either forward shock filaments seen in projection (DeLaney et al., 2004; Patnaude & Fesen, 2009) or associated with efficient acceleration of electrons at the SNR reverse shock (Uchiyama & Aharonian, 2008; Helder & Vink, 2008). Fluctuations in both exterior and interior nonthermal filaments have also been reported (Patnaude & Fesen, 2007; Uchiyama & Aharonian, 2008; Patnaude & Fesen, 2009), and the variability is cited as evidence for rapid synchrotron cooling of TeV electrons in mG–scale fields. A two to four year timescale for variations is evidence for efficient diffusive shock acceleration in SNR shocks, or alternatively the variations are seen as evidence for magnetic field fluctuations due to plasma waves behind the shock (Bykov et al., 2008).
Emission from Cas A has been seen at energies up to 40 keV with the Suzaku HXD PIN detector (Maeda et al., 2009), up to 100 keV with CGRO OSSE and Integral IBIS (The et al., 1996; Renaud et al., 2006), and GeV emission has been detected using Fermi–LAT (Abdo et al., 2010). The Fermi observations do not rule out either a leptonic origin to the GeV emission from a combination of nonthermal bremsstrahlung and inverse–Compton emission or a hadronic origin from neutral pion decay. Finally, Cas A has been detected at even higher TeV energies with HEGRA, MAGIC and Veritas (Aharonian et al., 2001; Albert et al., 2007; Humensky, 2008). Interestingly, the centroids for the GeV–TeV emission are located in the western region of Cas A, where the nonthermal X-ray emission is brightest (Helder & Vink, 2008; Maeda et al., 2009).
Here we present Chandra ACIS-S3 observations of Cas A taken in 2009 and 2010 which, when compared to ACIS-S3 observations taken between 2000 and 2007, show the remnant’s nonthermal X-ray emission in the 4.2–6.0 keV band to have decreased at a rate of 1.5–2.0% yr-1. In § 2 we discuss our observations, data reduction, and spectral analysis and in § 3 we discuss our results and offer some conclusions about the current and future evolution of the nonthermal emission in Cas A.
2. Observations, Data Reduction, and Analysis
Cas A has been observed extensively with Chandra and we have made use of several GO observations taken between 2000 and 2010, including the 2004 VLP (PI: Hwang). We reprocessed each epoch dataset listed in Table 1 using CIAO111http://chandra.harvard.edu version and CalDB . The more recent observations taken in 2007, 2009, and 2010 were split due to spacecraft thermal constraints. We merged these split observations into a single event lists for each epoch.
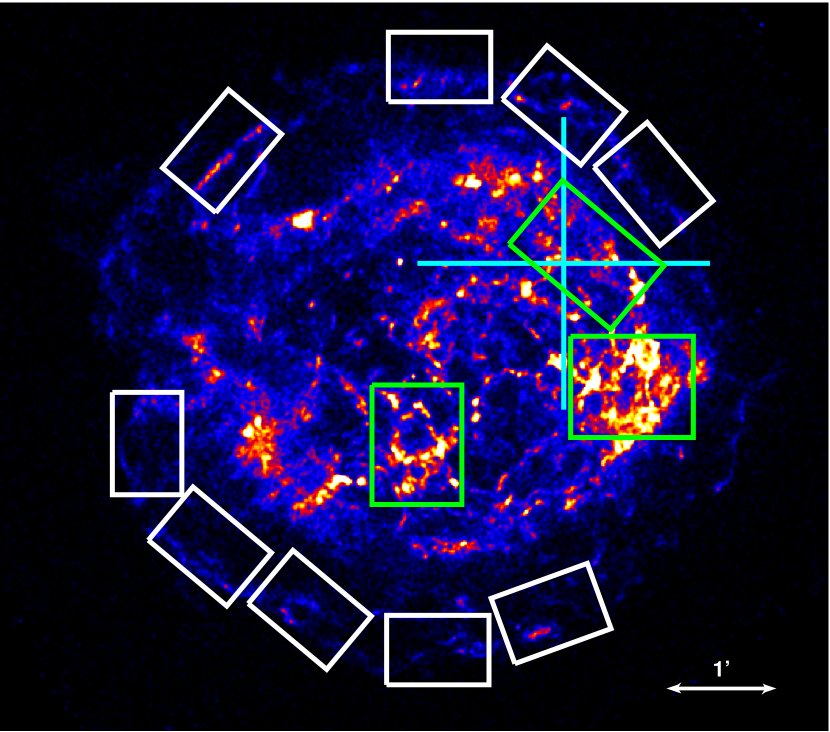
We filtered the event lists for those events with energies between 4.2–6.0 keV and performed an exposure correction assuming a monochromatic 5.1 keV source. The exposure corrected image is in units of photons cm-2 s-1 pix-1, so to compute the flux of 5.1 keV photons cm-2 s-1, we integrate over the number of pixels. The latest dataset, taken in November 2010, is shown in Figure 1.
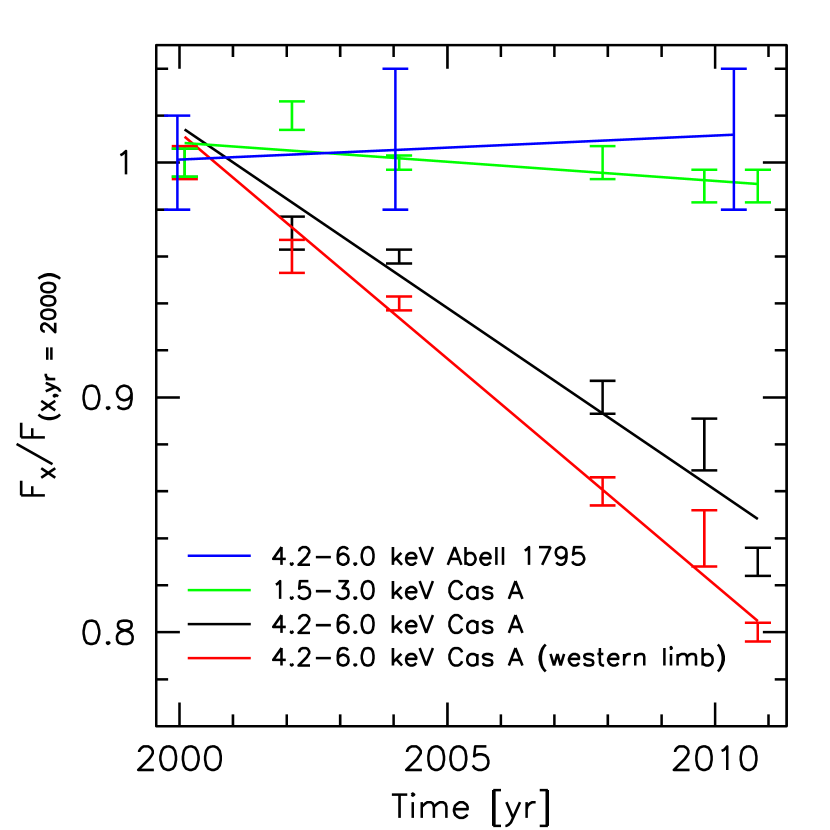
As seen in the black curve in Figure 2, there is a clear decrease in the overall 4.2–6.0 keV emission from Cas A. This decline does not appear to be an instrumental artifact. Several sources have been observed as Chandra calibration targets, including the galaxy cluster Abell 1795. In Figure 2, we also plot the 4.2–6.0 keV emission from Abell 1795, showing that the emission from this cluster has not varied by more than 1–2% over 10 years (Vikhlinin 2010, private communication). As a further check on whether our result for Cas A could be due to an instrumental or calibration artifact, we plot in Figure 2 the 1.5–3.0 keV emission (exposure corrected at 1.85 keV) and find that emission in that band has declined by less than 1% in 11 years. In addition, the Galactic SNR, G21.5–0.9, has been observed extensively with Chandra ACIS-S3 as a steady 2.0–8.0 keV continuum source, and changes in the flux from that source are not observed at the level which we report here (Tsujimoto et al., 2010). Finally, we note that Katsuda et al. (2010) reported no change in the X-ray synchrotron emission from SN 1006, and Heinke & Ho (2010) reported a decline in the temperature of the central point source in Cas A, and showed that the ACIS-S3 efficiency in the hard band is stable.
As an additional test of this flux decline, we fitted the 4.2–6.0 keV continuum emission in Cas A at each epoch to a powerlaw model in XSPEC222http://heasarc.gsfc.nasa.gov/docs/xanadu/xspec/ version . We find that the modeled flux does decrease with time in this energy band, consistent with our analysis of the exposure corrected images. As shown in Column 2 of Table 1, the fitted spectrum appears to steepen with time.
The results of our spectral fits listed in Column 2 of Table 1 are across the entire SNR and thus can include emission from electrons accelerated at the remnant’s forward shock, the reverse shock, or at the contact interface. To determine whether the changing emission is from the outer forward shock filaments, interior regions or possibly both, we extracted spectra from several regions marked with boxes in Figure 1 in all datasets and again fit the nonthermal emission to a powerlaw model. Galactic absorption has a negligible effect on 5.0 keV photons, so we did not model it here.
In Columns 4–6 of Table 1, we list the results from the spectral fits for the forward shock regions (the white boxes in Figure 1), the interior regions (green boxes in Figure 1), and then also just the interior regions that coincide with the Fermi centroid (Abdo et al., 2010). As can be seen in Table 1, the spectral shape of the forward shock filaments varies with time, with 2.3–2.6 between and . The interior filaments and the region associated only with the Fermi centroid in Figure 1 also show an increase in the powerlaw index over the same time period. Interior filaments show a steeper spectral shape than that seen for forward shock regions. We also examined changes in intensity in the western portion of Cas A and found that the emission from this region is also decreasing with time. This is shown as the red curve in Figure 2 and is seen to be steeper than the remnant’s overall nonthermal emission decline rate (black curve).
3. Discussion
As shown in Figure 2 and listed in Table 1, we find a decline in the 4.2–6.0 keV emission in Cas A over an approximately 11 year span. A linear least squares fit to the fractional change in 4.2–6.0 keV emission indicates a fairly steady decline in the nonthermal emission of (1.50.17)% yr-1 across the entire SNR. In western regions coincident with the Fermi centroid, the rate of decline appears to be slightly higher at (1.90.1)% yr-1.
A much slower decline in Cas A’s radio emission from GeV electrons has been known for some time (Shklovskii, 1960; Baars et al., 1977). Reichart & Stephens (2000) report that Cas A has generally been fading at a rate of –% yr-1 over a range of radio frequencies. The observed decline in Cas A’s radio emission has been interpreted to be a result of the adiabatic expansion of the supernova remnant since radio synchrotron emitting electrons have no appreciable radiative losses (Shklovskii, 1960; Anderson & Rudnick, 1996).
In contrast, the remnant’s X-ray synchrotron emission is the result of electrons accelerated within the last decade, as their radiative loss times are of the order ten years, or possibly less. Thus, X-ray synchrotron emission is much more sensitive to the present day acceleration time and radiative losses. For typical SNR parameters, synchrotron X-rays are produced in large part by the exponential tail of the electron distribution (e.g. Ellison & Cassam-Chenaï, 2005). Thus, any energy loss will result in a large drop in the emissivity, such as observed here in Cas A.
In order to interpret the 4.2–6.0 keV flux changes seen in Cas A’s X-ray continuum emission, we now examine how much of this change can be attributed to a change in the spectral properties alone. Zirakashvili & Aharonian (2007) considered the nonthermal X-ray spectrum when accounting for losses from diffusive shock acceleration and synchrotron radiation. In that case, the synchrotron emission can be approximated by (Zirakashvili & Aharonian, 2007):
| (1) |
where is the energy of the emitted photon, which here we assume to be 5.1 keV, is the cutoff energy in keV, and is the slope of the powerlaw well below the cutoff energy. We have split here the normalization constant into two factors, for reasons that we will explain below. One factor directly corresponds to the downstream magnetic field strength (c.f. Ginzburg & Syrovatskii, 1965, equation 3.31), where relates to the overall electron acceleration efficiency. Equation 1 implies that the spectral slope in X-rays is given by (Vink et al., 1999):
| (2) |
Thus, the measured spectral index can be related to the cutoff energy by:
| (3) |
For , we assume the value inferred from the radio spectral index, namely (Baars et al., 1977), or if nonlinear effects are important, may be as low as , corresponding to a particle spectral index of (Malkov & O’C Drury, 2001). For , = 1.0 – 2.0 keV, assuming = 2.6 – 2.3 and = 5.1 keV. Differentiating Equation 2 with respect to time under the assumption that only the cutoff energy varies leads to:
| (4) |
According to Table 1, we measure = 0.018 yr-1 in the western portion of Cas A, which translates to = (0.0320.008 – 0.0900.015) keV yr-1 for a = 1.0 – 2.0 keV. Likewise, from Table 1 for the forward shock, = 0.022 yr-1, which implies = (0.0390.004 – 0.1010.008) keV yr-1.
We can relate the cutoff energy to the shock velocity by (Zirakashvili & Aharonian, 2007):
| (5) |
where is the diffusion parameter, and equals one in the case of Bohm–diffusion. Therefore, the change in cutoff energy relates directly to a change in shock velocity as:
| (6) |
The forward shock of Cas A has been measured to be 5000 km s-1 (DeLaney & Rudnick, 2003; Patnaude & Fesen, 2009), so = (163 – 405) km s-1 yr-1. The nature of the reverse shock is, however, more uncertain. Helder & Vink (2008) have argued that the western region of Cas A has a velocity as high as 6000 km s-1, implying that the reverse shock in our frame is almost stationary. This could indeed be the case given a possible interaction with a molecular cloud in the west (Keohane et al., 1996). However, given the uncertainties in the nature of the interior filaments and the shock velocity of the reverse shock we defer a discussion on the changes in the western region of Cas A until more observations are completed.
So far we have only interpreted the change in spectral slope as due to a change in shock velocity. In addition, using the same framework, we can also interpret the observed flux changes. Differentiating Equation 1 with respect to time we obtain:
| (7) | |||||
where we made use of Equation 4 to rewrite the last term. In what follows we will estimate the influence of each term separately.
To start with the last term describing the flux change due to the evolution of cut-off energy, it is clear from Equation 7 that a change in alone will lead to a fractional change in flux of:
| (8) |
This directly connects the change in spectral slope to the related change in flux. For the values listed above, for both the forward shock and the western region, we expect a fractional change of 4% yr-1, which is about twice the value that is observed.
For the other two terms in Equation 7 we must make some additional assumptions about their dependence on time. Although this adds some uncertainty, it is nevertheless worthwhile for making order of magnitude estimates. We limit our discussion to the forward shock region as both its shock evolution and density structure are better understood.
For the normalization factor , we assume that to first order it corresponds directly to the amount of gas entering the forward shock per unit of time:
| (9) |
where we have used both the fact that the forward shock is likely to be moving through the progenitor wind of the supernova, hence , and also the idea that the forward shock evolution is self-similar with . Note also that this equation is only valid if synchrotron losses are large, otherwise would be proportional to the total amount of material swept up by the forward shock, rather than by what is being swept up now. Differentiating the above equation with respect to time shows that the fractional change in the flux due to a change in is estimated to be:
| (10) |
For this corresponds to a fractional flux change of % yr-1, much smaller than the flux changes due to a change in cut-off energy.
For estimating the effect of the second term in Equation 7 we make the assumption that , as suggested by (Völk et al., 2005), with (Völk et al., 2005) or (Vink, 2008; Bell, 2004). We therefore have:
| (11) |
for which we have again made use of the idea that the density structure falls off as and .
The fractional change in , and therefore, the expected fractional flux change is expected to be
| (12) |
corresponding to a flux change of -0.45% yr-1 for , and or -0.54% yr-1 for . These values are larger than those due to changes in the first term (), but still smaller than the fractional changes predicted from changes in the cut-off energy alone. It is important to note that these values are only valid for the forward shock, for which we have a reasonable estimate of both the preshock density and .
There are a number of caveats in the simple analysis above which may affect our result. For instance, Schure et al. (2010) point out that if non-steady state acceleration effects are considered, the exponential cutoff may have a dependence that is different than that in Eq. 2. Additionally, we are averaging over an ensemble of shock conditions over a span of ten years; the shock conditions and powerlaw spectra will undoubtedly vary from position to position, and a sum of powerlaw spectra does not yield a powerlaw (see also the discussion by Helder & Vink, 2008). In that respect, it is surprising that the hard X-ray spectrum of Cas A is best described by a powerlaw (Renaud et al., 2006) with little evidence for a gradual steepening of the hard X-ray spectrum with energy as predicted by Equation 1.
It is also possible that not all the emission arises from synchrotron emitting electrons. Helder & Vink (2008) point out that 50% of the emission in the west is from synchrotron emission, and the remainder is likely from thermal continuum. The loss time for thermal electrons is much greater than the 2–4 yr timescale seen in the TeV electrons. That is to say, over the timescales we are investigating, variations in thermal continuum emission will be much smaller than variations in the nonthermal emission and it is possible that the emission from the thermal component may increase over the approximately 11 yr time span of our observations.
4. Summary and Conclusion
Our analysis of the 4.2–6 keV flux of Cas A shows a decline of 1.5% yr-1 in the nonthermal X-ray emission across the entire SNR over 11 years, with a slightly larger decline rate of 1.9% yr-1 from regions along the remnant’s western limb. We find that qualitatively, the observed spectral steepening and decline in flux can be explained by a simple model for changes in the electron cutoff energy which are brought about by a natural deceleration of the shock. We estimate an average deceleration of Cas A’s forward shock velocity 10 – 40 km s-1 yr-1.
The predicted decline in the nonthermal X-ray emission is about 4% yr-1, which is nearly twice that observed. The difference between the predicted and observed decline might be explained by the fact that the 4.2–6.0 keV continuum emission is not entirely due to synchrotron emission from shock accelerated electrons, but some of it is from thermal continuum which does not evolve on the same timescale as the nonthermal emission. We have compared our results to models where the decline is a natural consequence of either a decrease in the number of particles entering the shock or a decrease in the efficiency of the shock to amplify the magnetic field, and find that these models predict a decline of 0.1–0.5% yr-1, which is significantly less than the observed decline of 1.5–1.9% yr-1.
References
- Abdo et al. (2010) Abdo, A. A., et al. 2010, ApJ, 710, L92
- Aharonian et al. (2001) Aharonian, F., et al. 2001, A&A, 370, 112
- Aharonian et al. (2007a) Aharonian, F., et al. 2007, A&A, 464, 235
- Aharonian et al. (2007b) Aharonian, F., et al. 2007, ApJ, 661, 236
- Albert et al. (2007) Albert, J., et al. 2007, A&A, 474, 937
- Allen et al. (1997) Allen, G. E., et al. 1997, ApJ, 487, L97
- Anderson & Rudnick (1996) Anderson, M. C., & Rudnick, L. 1996, ApJ, 456, 234
- Baars et al. (1977) Baars, J. W. M., Genzel, R., Pauliny-Toth, I. I. K., & Witzel, A. 1977, A&A, 61, 99
- Bell (2004) Bell, A. R. 2004, MNRAS, 353, 550
- Bykov et al. (2008) Bykov, A. M., Uvarov, Y. A., & Ellison, D. C. 2008, ApJ, 689, L133
- DeLaney & Rudnick (2003) DeLaney, T., & Rudnick, L. 2003, ApJ, 589, 818
- DeLaney et al. (2004) DeLaney, T., Rudnick, L., Fesen, R. A., Jones, T. W., Petre, R., & Morse, J. A. 2004, ApJ, 613, 343
- Ellison & Cassam-Chenaï (2005) Ellison, D. C., & Cassam-Chenaï, G. 2005, ApJ, 632, 920
- Fesen et al. (2006) Fesen, R. A., et al. 2006, ApJ, 645, 283
- Ginzburg & Syrovatskii (1965) Ginzburg, V. L., & Syrovatskii, S. I. 1965, ARA&A, 3, 297
- Gotthelf et al. (2001) Gotthelf, E. V., Koralesky, B., Rudnick, L., Jones, T. W., Hwang, U., & Petre, R. 2001, ApJ, 552, L39
- Helder & Vink (2008) Helder, E. A., & Vink, J. 2008, ApJ, 686, 1094
- Heinke & Ho (2010) Heinke, C. O., & Ho, W. C. G. 2010, ApJ, 719, L167
- Hughes et al. (2000) Hughes, J. P., Rakowski, C. E., Burrows, D. N., & Slane, P. O. 2000, ApJ, 528, L109
- Humensky (2008) Humensky, T. B. 2008, American Institute of Physics Conference Series, 1085, 357
- Hwang & Laming (2003) Hwang, U., & Laming, J. M. 2003, ApJ, 597, 362
- Katsuda et al. (2010) Katsuda, S., Petre, R., Mori, K., Reynolds, S. P., Long, K. S., Winkler, P. F., & Tsunemi, H. 2010, ApJ, 723, 383
- Keohane et al. (1996) Keohane, J. W., Rudnick, L., & Anderson, M. C. 1996, ApJ, 466, 309
- Laming & Hwang (2003) Laming, J. M., & Hwang, U. 2003, ApJ, 597, 347
- Maeda et al. (2009) Maeda, Y., et al. 2009, PASJ, 61, 1217
- Malkov & O’C Drury (2001) Malkov, M. A., & O’C Drury, L. 2001, Reports on Progress in Physics, 64, 429
- Patnaude & Fesen (2007) Patnaude, D. J., & Fesen, R. A. 2007, AJ, 133, 147
- Patnaude & Fesen (2009) Patnaude, D. J., & Fesen, R. A. 2009, ApJ, 697, 535
- Reed et al. (1995) Reed, J. E., Hester, J. J., Fabian, A. C., & Winkler, P. F. 1995, ApJ, 440, 706
- Reichart & Stephens (2000) Reichart, D. E., & Stephens, A. W. 2000, ApJ, 537, 904
- Renaud et al. (2006) Renaud, M., et al. 2006, ApJ, 647, L41
- Schure et al. (2010) Schure, K. M., Achterberg, A., Keppens, R., & Vink, J. 2010, MNRAS, 406, 2633
- Shklovskii (1960) Shklovskii, I. S. Soviet Ast.4, 355
- The et al. (1996) The, L.-S., Leising, M. D., Kurfess, J. D., Johnson, W. N., Hartmann, D. H., Gehrels, N., Grove, J. E., & Purcell, W. R. 1996, A&AS, 120, 357
- Tsujimoto et al. (2010) Tsujimoto, M., et al. 2010, arXiv:1009.2812
- Uchiyama & Aharonian (2008) Uchiyama, Y., & Aharonian, F. A. 2008, ApJ, 677, L105
- Vink et al. (1996) Vink, J., Kaastra, J. S., & Bleeker, J. A. M. 1996, A&A, 307, L41
- Vink et al. (1998) Vink, J., Bloemen, H., Kaastra, J. S., & Bleeker, J. A. M. 1998, A&A, 339, 201
- Vink et al. (1999) Vink, J., Maccarone, M. C., Kaastra, J. S., Mineo, T., Bleeker, J. A. M., Preite-Martinez, A., & Bloemen, H. 1999, A&A, 344, 289
- Vink & Laming (2003) Vink, J., & Laming, J. M. 2003, ApJ, 584, 758
- Vink et al. (2006) Vink, J., Bleeker, J., van der Heyden, K., Bykov, A., Bamba, A., & Yamazaki, R. 2006, ApJ, 648, L33
- Vink (2008) Vink, J. 2008, American Institute of Physics Conference Series, 1085, 169
- Völk et al. (2005) Völk, H. J., Berezhko, E. G., & Ksenofontov, L. T. 2005, A&A, 433, 229
- Willingale et al. (2002) Willingale, R., Bleeker, J. A. M., van der Heyden, K. J., Kaastra, J. S., & Vink, J. 2002, A&A, 381, 1039
- Willingale et al. (2003) Willingale, R., Bleeker, J. A. M., van der Heyden, K. J., & Kaastra, J. S. 2003, A&A, 398, 1021
- Zirakashvili & Aharonian (2007) Zirakashvili, V. N., & Aharonian, F. 2007, A&A, 465, 695
| Epoch | Faa4.2 – 6.0 keV flux | Faa4.2 – 6.0 keV fluxWest | ||||
|---|---|---|---|---|---|---|
| yr | 10-10 erg cm-2 s-1 | 10-10 erg cm-2 s-1 | ||||
| 2000.1 | 2.810.03 | 1.610.01 | 2.320.11 | 2.660.07 | 2.660.06 | 0.2290.001 |
| 2002.1 | 3.010.03 | 1.560.01 | 2.430.11 | 2.750.07 | 2.740.06 | 0.2230.001 |
| 2004.1 | 2.990.03 | 1.540.01 | 2.420.11 | 2.700.07 | 2.730.06 | 0.2150.001 |
| 2007.9 | 2.980.04 | 1.450.02 | 2.550.15 | 2.700.10 | 2.800.09 | 0.1970.002 |
| 2009.8 | 2.990.05 | 1.420.04 | 2.610.15 | 2.780.11 | 2.780.09 | 0.1950.004 |
| 2010.8 | 3.070.04 | 1.340.01 | 2.560.14 | 2.820.13 | 2.850.08 | 0.1830.002 |