Revealing O vii from stacked X-ray grating spectra of clusters, groups and elliptical galaxies
Abstract
We stack 4.6 Ms of high spectral resolution XMM-Newton Reflection Grating Spectrometer spectra from galaxy clusters, groups of galaxies and elliptical galaxies. For those objects with a central temperature of less than 1 keV, we detect O vii for the first time, with a probability of false detection of . The flux ratio of the O vii to Fe xvii lines is to of the emission expected for isobaric radiative cooling in the absence of heating. There is either a process preventing cooling below 0.5 keV, anomalous O/Fe abundance ratios, absorbing material around the coolest X-ray emitting gas or non-radiative cooling taking place. The mean N vii emission line is strong in the sub-keV sample. As the ratio of the hydrogenic N and O lines is largely independent of temperature, we measure a mean N/O ratio of . Although the continuum around the C vi lines is difficult to measure we can similarly estimate that the C/O ratio is .
keywords:
intergalactic medium — X-rays: galaxies: clusters1 Introduction
The intracluster medium (ICM) is the few to K X-ray emitting plasma which fills the potential wells of objects ranging in scale from galaxy clusters down to massive elliptical galaxies. The X-ray surface brightness profile of these objects is often steeply peaked (e.g. Stewart et al., 1984). The implied mean radiative cooling times are less than 1 Gyr. In the absence of heating 10s to 100s of solar masses per year should be cooling below K to form a cooling flow (Fabian, 1994).
The relative strength of X-ray emission lines is a good probe of the temperature distribution of the ICM. The major spectral lines in the Å spectral range can be observed in bright objects using the Reflection Grating Spectrometer (RGS) instruments on XMM-Newton.
The weak or missing Fe xvii emission lines, indicating material around keV, in RGS spectra showed that there is much less cool gas present in clusters than expected from cooling in the absence of heating (e.g. Peterson et al., 2001, 2003). However, these lines have been detected in several objects using deep observations (Sanders et al., 2008, 2009). There can be a wide range of in temperature, but less than 10 per cent of the emission expected for radiative cooling is seen. Active galactic nuclei (AGN) in the cores of clusters are believed to be the mechanism by which energy is supplied to the ICM to combat a large fraction of the radiative cooling (for reviews see Peterson & Fabian, 2006; McNamara & Nulsen, 2007).
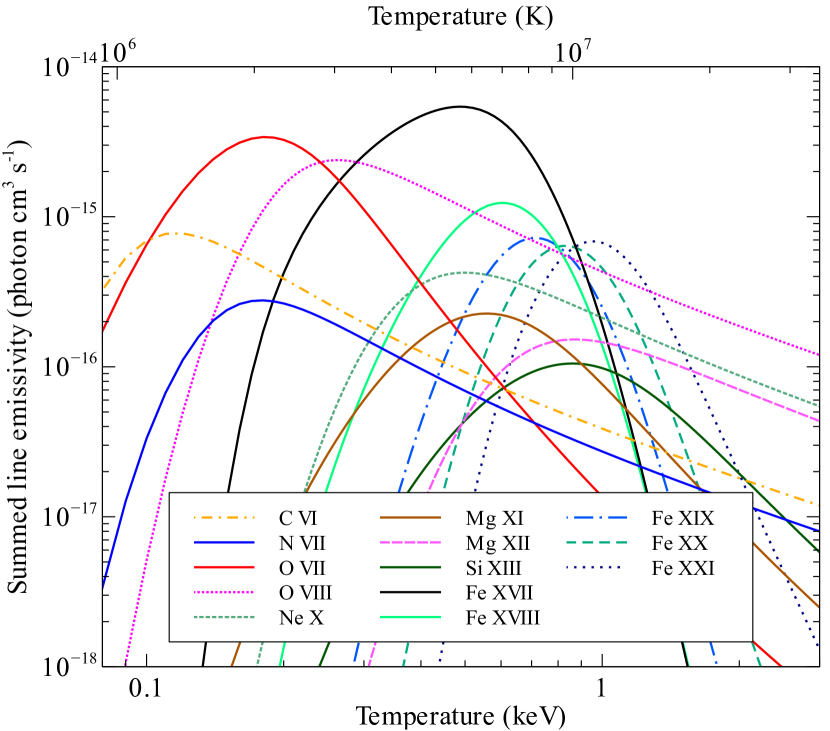
Fig. 1 shows the emissivity of emission lines from certain strong X-ray emitting ions as a function of temperature. To create this plot we summed the emissivity of strong lines in the RGS spectral range calculated using spex 2.00.11 (Kaastra & Mewe, 2000). The emissivity in Fe xvii emission peaks at a temperature of around 0.5 keV. To observe gas at lower temperatures requires the detection of O vii lines. No significant detections of O vii have been reported in clusters, groups or elliptical galaxies, implying there is little material below 0.5 keV temperature.
Very deep XMM observations of bright high-metallicity cool objects may detect the presence of O vii emission lines. The calorimeters planned for ASTRO-H and IXO should also be able to detect these lines. In the absence of any such observations at this time we conducted a stacking analysis of the best observations in the XMM-Newton archive.
In this paper we assume the relative Solar abundances of Anders & Grevesse (1989).
2 Spectral stacking
We took the processed RGS spectra from our analysis of the line broadening in 62 galaxy clusters, groups and elliptical galaxies (Sanders et al., 2010). These spectra were extracted from 90 per cent of the point spread function (PSF), a roughly 50 arcsec wide strip across the centre of the object, and included 90 per cent of the pulse height distribution. We removed from the sample the two objects, Klemola 44 and RX J1347.5-114, which showed significant line broadening.
We note that the sample is not complete and was originally chosen to contain objects with strong emission lines and a peaked surface brightness profile. The results are likely to be relevant for this sort of object, but perhaps not the average cluster, group or elliptical galaxy.
For each object we created a fluxed spectrum with rgsfluxer, combining the two first order and two second order spectra. A fluxed spectrum uses a fixed wavelength binning and is divided by the effective area of the telescope to be in units of photonÅ-1. We used a bin size of 0.01Å when fluxing the spectra. We background-subtracted the spectra using a background extracted from beyond 98 per cent of the RGS PSF (as in Sanders et al., 2010). The rgsfluxer tool is not normally used in the quantitative analysis of spectra because it does not take account of the redistribution into neighbouring channels. For the low resolution spectra we examine here and because we only fit the emission lines with simple Gaussian functions, this is not a serious issue.
The wavelength bins of the fluxed spectra were corrected for redshift (note that we did not change the flux, which is still the flux in the observed frame). We rebinned and added these spectra to make a stacked spectrum with 0.04Å resolution. For each output bin we divided by the total number of input bins and spectra which were added for that bin, to construct an average spectrum.
| Temperature range (keV) | Number | Exposure (ks) | |
|---|---|---|---|
| 9 | 0.0063 | 1240 | |
| 9 | 0.012 | 1329 | |
| 8 | 0.027 | 1847 | |
| 34 | 0.13 | 4831 |
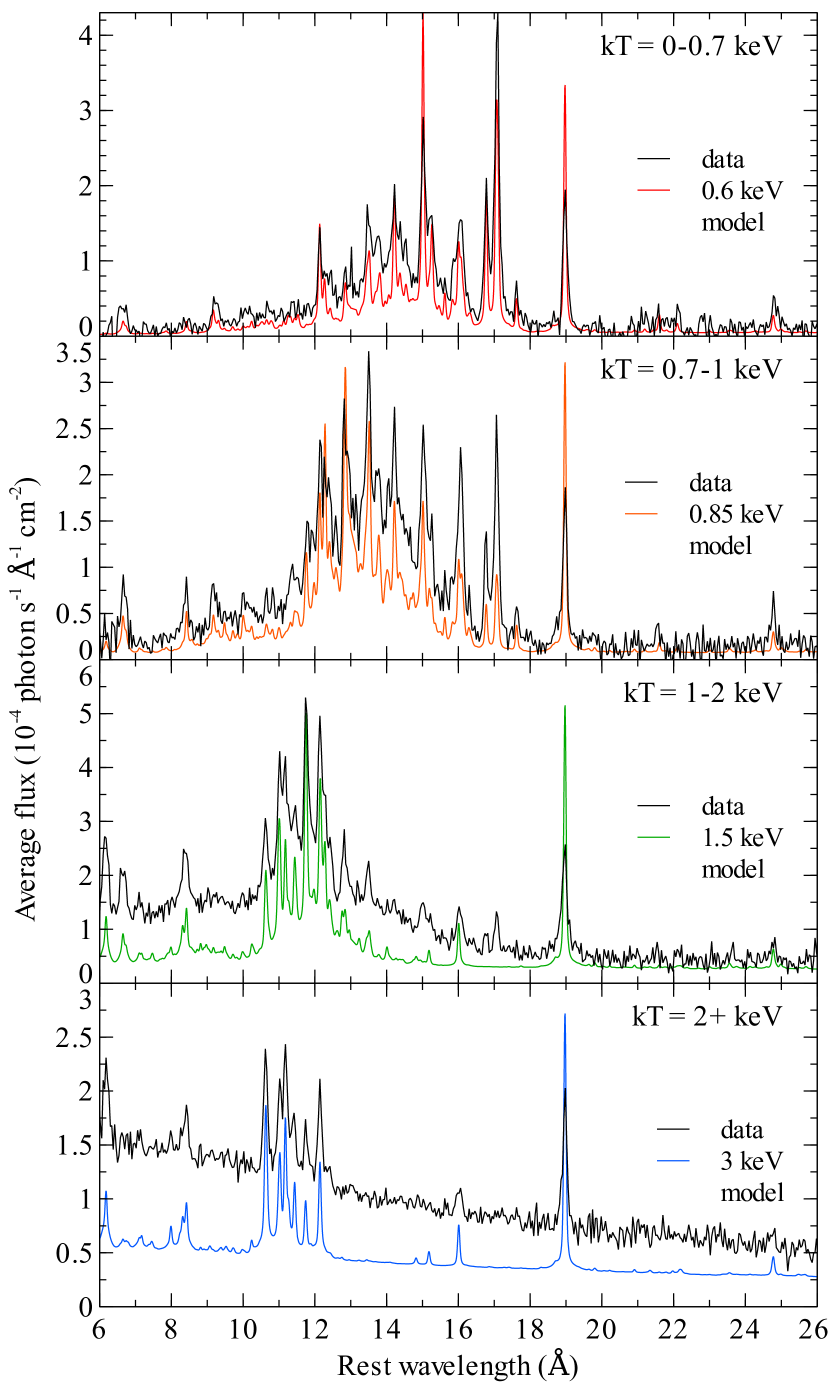
We constructed stacked spectra for the clusters in four different temperature bins using the average temperature measured from the RGS spectra (values are listed in Sanders et al., 2010). Table 1 shows details about the temperature bins. The average spectra for the objects in the temperature bins are shown in Fig 2 with Solar metallicity model spectra (computed using apec; Smith et al. 2001) at a representative temperature and spectral resolution. The panels show that as the temperature increases we see increasingly higher ionization states of iron at shorter wavelengths. There are no obvious lines in the data that are not accounted for in the model spectra. We see no evidence for any lines that may come from, for example, dark matter decay (e.g. Abazajian et al., 2001).
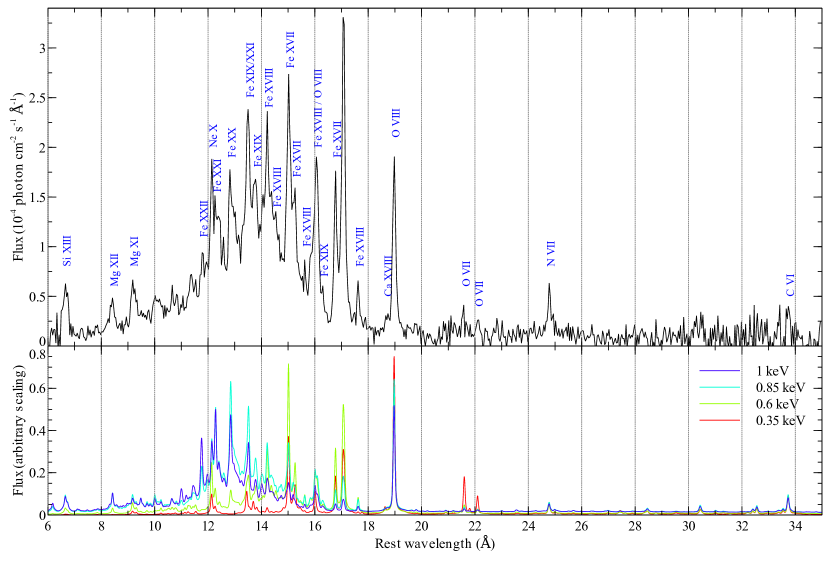
The spectra for the cooler objects are line-rich. To examine the lines in more detail we combine the two lower temperature bins. The mean spectrum for the objects with temperatures less than 1 keV is shown in Fig. 3. On the plot we label the major lines and in the lower panel show model spectra at a range of temperatures. In this stacked spectrum we detect the recombination and forbidden lines of the O vii triplet at 21.6 and 22.1Å, respectively. O vii is a good indicator of material below 0.5 keV (Fig. 1). In addition we find the C vi lines at 33.7Å, although this part of the spectrum is noisy and the continuum uncertain. C vi has been seen previously in M87 (Werner et al., 2006).
Due to the rebinning and fluxing process we cannot propagate the error bars robustly from the original spectra. Instead, we used the standard deviation of the data points in the spectral region around around the O vii lines (20.8 to 24.5Å, excluding the lines themselves) to estimate the error bars on each spectral point. A constant model fit over this region gives a of 108.4 with 92 degrees of freedom. If we add to the model two Gaussian components of the same width at the wavelengths of the O vii lines, the reduces to 87.4 with 89 degrees of freedom (a reduced of 0.98). An F-test suggests that the probability of of this improvement in fit happening by chance is . The separate probability for the 21.6Å line is and for the 22.1Å line. Similarly, the probability of false detection of the C vi line is 0.02.
3 Discussion
The detection of O vii emission shows that there is material below keV in the X-ray waveband, at least in objects with a mean central temperature below 1 keV. The signal does not seem to be stronger when the sample is split into two bins (Fig. 2), which implies that it is unlikely that there is a single dominating object or that only the cooler objects show O vii emission.
The flux of the O vii recombination and forbidden lines for the sub-1 keV temperature sample, as obtained from the Gaussian model fit, are shown in Table 2. The Fe xvii lines at 16.78 and 17.08Å were also fitted and the flux calculated (the second line is actually two unresolved lines at 17.055 and 17.1Å). For this fit, we fixed the continuum at the value obtained from the O vii lines due to the proximity of neighbouring lines. We did not measure the fluxes for the Fe xvii lines around 15Å because it is difficult to separate the continuum and these lines.
| Line | Observed | Model (APEC) | Model (SPEX) |
|---|---|---|---|
| Fe xvii 16.78 | 1.1 | 1.8 | |
| Fe xvii 17.08 | 2.5 | 4.1 | |
| O vii 21.6 | 1.2 | 1.0 | |
| O vii 22.1 | 0.63 | 0.67 |
We calculated a model spectrum where gas is cooling isobarically at a rate of at a redshift of 0.01, from a temperature of 1.5 keV to 0.08 keV (assuming ). The spectrum is absorbed photoelectrically at an equivalent Hydrogen column of , for both the apec and spex models. The flux values for the same lines are shown in Table 2. For the apec model the Fe xvii to O vii flux ratio is 2.0 (summing the pairs of lines) and 3.5 for the spex model. In our average spectrum the ratio is 16. Therefore if the Fe xvii and O vii emission is caused by cooling, assuming Solar metallicity ratios and no extra absorption on the coolest gas, there is to of the emission below 0.5 keV temperature than expected from the emission above those temperatures.
There may be more material cooling to a low temperatures if the cooler gas is surrounded by absorbing material. The edge for oxygen absorption occurs over a wavelength range 22.6 to 23.7Å (seen in the tbnew absorption model of Wilms et al. 2000). This edge is at longer wavelengths than the O vii triplet. If the oxygen metallicity is low in the cooling regions, this may lead to weak O vii emission. Oxygen lines are the main coolant in the RGS waveband but iron emission is substantial at longer wavelengths in the far UV. The abundances in the central parts of these objects is likely to be unusual, particularly because of depletion onto dust grains (e.g. Canning et al., 2010). Non-radiative cooling of the ICM may also lead to there being less emission from cooler temperatures than expected, for example, because of the mixing of X-ray emitting material with colder gas (Fabian et al., 2002).
The average metallicities can also be estimated for the sample. Note from Fig. 1 that the ratios between the hydrogenic O viii, N vii and C vi emissivities are the same above a temperature of 0.25 keV. If there is little material below this temperature (as is indicated by the lack of O vii emission) then the ratios of these lines should be good indicators of metallicity. The Mg xii hydrogenic lines around 8.4Å could be used for abundance measurements above 1 keV temperature but they are unfortunately blended with Fe xxiv.
| Line | Observed | Model (APEC) | Model (SPEX) |
|---|---|---|---|
| O viii 19.0 | 17 | 17 | |
| N vii 24.8 | 1.2 | 1.4 | |
| C vi 33.7 | 2.3 | 2.1 |
Table 3 lists the line strengths for the hydrogenic lines in the mean spectrum. The error bars on the spectral data points for the N vii and C vi lines were estimated from the standard deviation of the data points around each line. When measuring the flux in the the O viii line we assumed the same continuum level that we measured for the O vii lines. We fitted separate continuum levels for N vii and C vi (which are lower by 3 and 20 per cent from the O vii continuum level, respectively).
We also tabulate in Table 3 the line strengths for a simulated 0.5 keV spectrum at Solar metallicity, absorbed by a column density of . The apec and spex models show similar fluxes for the lines. At Solar metallicity there should be a O/N flux ratio of . We observe a ratio of 3.5, which implies that the average nitrogen abundance relative to oxygen is . We note that the O viii emission line is resonantly scattered which could lead to an underestimation of the O/N ratio, although this effect is relatively small for an elliptical galaxy like NGC 4636 (Werner et al., 2009).
The N vii to O viii line ratio appears to be largest in the 0.7-1 keV temperature range (Fig. 2). The strength of the N vii line relative to O viii decreases with increasing temperature. This could either be due to real abundance changes with temperature, or it may be due to the fact that we are sampling larger regions for objects at higher redshifts.
We also applied spectral fitting to the combined spectrum for objects with temperatures of less than 1 keV. Although there are difficulties in interpreting the results from such a spectral fit, we confirmed that nitrogen to oxygen ratio is greater than 3 times the solar value. As the continuum at long wavelengths is uncertain, it is unclear whether O/H metallicities are low or whether the N/H values are high. The N/Fe ratio is around 1.7, although the Fexvii lines are poorly fit. The two temperature component model gives temperatures of 0.34 and 0.71 keV, with the emission measure of the lower temperature component 14 per cent of the emission measure of the hotter component.
Nitrogen abundances appear to vary considerably in detailed observations of individual objects, although the exact values are dependent on modelling. Xu et al. (2002) found that NGC 4636, a relatively cool elliptical galaxy at keV, does not have strong N vii emission, with N/Fe at approximately Solar ratios. Werner et al. (2009), however, found N/Fe in the core of this object and high nitrogen abundances in four other elliptical galaxies. In Centaurus the N/Fe ratio is around (Sanders et al., 2008). Centaurus has a mean RGS temperature of 1.6 keV. The N/Fe ratio in Sérsic 159 is (de Plaa et al., 2006), with a mean 3 keV temperature. M87, which has a mean temperature of 1.8 keV shows a N/Fe ratio of (Werner et al., 2006). The N/Fe ratios for Abell 262, Abell 3581 and HCG 62 (relatively cool objects with RGS temperatures less than 1.5 keV), are close to Solar values (Sanders et al., 2010). It is unclear why there is such a wide range of N/Fe values. A future study of a sample of bright objects using the ratio of the N vii to O viii lines would be less model dependent than using N/Fe.
Possible other observational evidence for high nitrogen abundances are the high [N ii]6584/H ratios in the nebulae surrounding some central cluster galaxies, which can be as much as 3 (Hatch et al., 2007). Ratios as high as this are difficult to achieve in models without super-Solar nitrogen metallicities.
Examining the carbon metallicity, the C/O flux ratio implies an carbon to oxygen abundance ratio of .
Nitrogen and carbon metallicities are useful to measure because these elements are not created by supernova explosions (unlike the other elements detected in the X-ray waveband) and are typically created in low to intermediate mass stars (for a discussion see Mollá et al., 2006). Nitrogen can be made in a primary process in intermediate mass stars, where oxygen and carbon generated before CNO cycling is converted to nitrogen. This should give a nitrogen enrichment which is independent of the initial metallicity of the star. In addition, nitrogen can be created by a secondary process, where carbon and oxygen present at the birth of the star is transformed into nitrogen. This should give a nitrogen enrichment proportional to the initial abundance. Oxygen enrichment is thought to be mostly due to Type II supernovae, produced from massive stars.
The high average value of N/O observed in the sub-keV temperature sample is at the extreme end of the distribution of H ii regions and stars in late-type galaxies shown in Henry et al. (2000). However, N/Fe has been found to be slightly supersolar in a sample of early-type galaxies (Toloba et al., 2009). The high N/O values we observe may either be due to enhanced nitrogen abundances or low oxygen abundances.
4 Conclusions
We examine the mean RGS spectrum of objects from the XMM-Newton archive in different temperature bins. For those objects with a RGS-measured temperature of less than 1 keV we detect for the first time O vii emission. This is indicative of material below 0.5 keV.
If the gas in the objects is cooling without any heating, there is to of the expected O vii emission compared to the 16.8 and 17.1Å Fe xvii flux. This may imply that a small fraction of the gas is cooling in these objects, the abundance ratios of O and Fe are anomalous, or that there is absorbing material around the coolest gas. An alternative explanation is non-radiative cooling of the coolest gas.
The ratio of the hydrogenic lines in the spectrum are independent of temperature, allowing estimates of the mean N/O and C/O ratios. In the sample of objects below 1 keV the N/O ratio is . The C/O ratio is .
Acknowledgements
ACF thanks the Royal Society for support.
References
- Abazajian et al. (2001) Abazajian K., Fuller G. M., Tucker W. H., 2001, ApJ, 562, 593
- Anders & Grevesse (1989) Anders E., Grevesse N., 1989, Geochim. Cosmochim. Acta, 53, 197
- Canning et al. (2010) Canning R. E. A., Fabian A. C., Johnstone R. M., Sanders J. S., Crawford C. S., Hatch N. A., Ferland G. J., 2010, MNRAS, in press, arXiv:1009.2581
- de Plaa et al. (2006) de Plaa J. et al., 2006, A&A, 452, 397
- Fabian (1994) Fabian A. C., 1994, ARA&A, 32, 277
- Fabian et al. (2002) Fabian A. C., Allen S. W., Crawford C. S., Johnstone R. M., Morris R. G., Sanders J. S., Schmidt R. W., 2002, MNRAS, 332, L50
- Hatch et al. (2007) Hatch N. A., Crawford C. S., Fabian A. C., 2007, MNRAS, 380, 33
- Henry et al. (2000) Henry R. B. C., Edmunds M. G., Köppen J., 2000, ApJ, 541, 660
- Kaastra & Mewe (2000) Kaastra J. S., Mewe R., 2000, in Bautista M. A., Kallman T. R., Pradhan A. K., ed, Atomic Data Needs for X-ray Astronomy, p. 161
- McNamara & Nulsen (2007) McNamara B. R., Nulsen P. E. J., 2007, ARA&A, 45, 117
- Mollá et al. (2006) Mollá M., Vílchez J. M., Gavilán M., Díaz A. I., 2006, MNRAS, 372, 1069
- Peterson & Fabian (2006) Peterson J. R., Fabian A. C., 2006, Phys. Rep., 427, 1
- Peterson et al. (2003) Peterson J. R., Kahn S. M., Paerels F. B. S., Kaastra J. S., Tamura T., Bleeker J. A. M., Ferrigno C., Jernigan J. G., 2003, ApJ, 590, 207
- Peterson et al. (2001) Peterson J. R. et al., 2001, A&A, 365, L104
- Sanders et al. (2008) Sanders J. S., Fabian A. C., Allen S. W., Morris R. G., Graham J., Johnstone R. M., 2008, MNRAS, 385, 1186
- Sanders et al. (2010) Sanders J. S., Fabian A. C., Frank K. A., Peterson J. R., Russell H. R., 2010, MNRAS, 402, 127
- Sanders et al. (2010) Sanders J. S., Fabian A. C., Smith R. K., 2010, MNRAS, in press, arXiv:1008.3500
- Sanders et al. (2009) Sanders J. S., Fabian A. C., Taylor G. B., 2009, MNRAS, 393, 71
- Smith et al. (2001) Smith R. K., Brickhouse N. S., Liedahl D. A., Raymond J. C., 2001, ApJ, 556, L91
- Stewart et al. (1984) Stewart G. C., Fabian A. C., Jones C., Forman W., 1984, ApJ, 285, 1
- Toloba et al. (2009) Toloba E., Sánchez-Blázquez P., Gorgas J., Gibson B. K., 2009, ApJ, 691, L95
- Werner et al. (2006) Werner N., Böhringer H., Kaastra J. S., de Plaa J., Simionescu A., Vink J., 2006, A&A, 459, 353
- Werner et al. (2009) Werner N., Zhuravleva I., Churazov E., Simionescu A., Allen S. W., Forman W., Jones C., Kaastra J. S., 2009, MNRAS, 398, 23
- Wilms et al. (2000) Wilms J., Allen A., McCray R., 2000, ApJ, 542, 914
- Xu et al. (2002) Xu H. et al., 2002, ApJ, 579, 600