Trapping colloids near chemical stripes via critical Casimir forces
Abstract
We study theoretically and experimentally the solvent-mediated critical Casimir force
acting on colloidal particles immersed in a binary liquid mixture of water and 2,6-lutidine
and close to substrates which are chemically patterned
with periodically alternating stripes of antagonistic adsorption preferences.
These patterns are experimentally realized via microcontact printing.
Upon approaching the critical demixing point of the solvent, normal and lateral critical Casimir forces
generate laterally confining effective potentials for the colloids.
We analyze in detail the rich behavior of the spherical colloids close to such substrates.
For all patterned substrates we investigated, our measurements of these effective potentials
agree with the corresponding theoretical predictions.
Since both the directions and the strengths of the critical Casimir forces can be tuned by minute
temperature changes, this provides a new mechanism for controlling colloids as model systems, opening
encouraging perspectives for applications.
keywords:
Solvation forces, critical Casimir effect, colloidal suspension, chemically patterned substrates1 Introduction
The structures and the dynamics of colloidal suspensions are to a large extent determined by the effective interactions among the mesoscopic colloids which are mediated by the solvent surrounding them. A rather intriguing example of such solvation forces is the critical Casimir effect [1] which occurs close to a critical point of the solvent. As a soft-matter analogue of the quantum-electrodynamic Casimir effect [2, 3], the confinement of the concentration fluctuations within a near-critical binary liquid mixture by the surfaces of the colloidal particles results in an attractive or repulsive effective interaction [4, 5, 6]. Upon approaching the bulk critical demixing point of the mixture at temperature the critical fluctuations become long-ranged so that the resulting effective interaction among colloids can extend well beyond the molecular scale of the solvent; it may act even at distances comparable to the size of the colloids. The strength and the spatial range of the critical Casimir force depend sensitively on temperature because the correlation length , which characterizes the extension of the spatial correlations of the critical fluctuations and therefore sets the interaction range, diverges as upon approaching the critical point, , where is a standard bulk critical exponent111Here we quote the value of within the Ising universality class, which is relevant for the interpretation of experimental data concerning classical binary liquid mixtures. and is a solvent-specific microscopic length. The critical Casimir effect is universal in the sense that all quantities related to it, such as the various components of the force and the associated potentials, can be suitably expressed in terms of scaling functions which are identical for all those fluids undergoing the same kind of transition, irrespective of their molecular details and material properties, which actually enter only via two independent non-universal amplitudes, such as , and the value of .
Besides some indirect quantitative experimental determinations of the critical Casimir force acting within wetting films [7, 9, 8], its direct effect on a spherical colloid close to a substrate and immersed in a critical water-lutidine mixture was measured only recently [10]. These experiments clearly demonstrated that, upon approaching the critical point, the critical Casimir force can modify the effective interaction between the colloid and the substrate by several multiples of . Moreover, depending on the preference of the confining surfaces for lutidine or water — denoted as and effective boundary conditions (BC) for the order parameter, respectively — the critical Casimir force between the colloid and the substrate is attractive [for boundary conditions] or repulsive [for boundary conditions] [10]. In addition, these critical Casimir forces depend strongly on the geometrical shape of the confining surfaces so that topographically structured surfaces experience also a component of the force which is parallel to the walls [11], whereas nonspherical particles are subject to a torque [12].
One can combine these features of the critical Casimir effect by using surfaces which are chemically patterned on the micron-scale in order to obtain also lateral critical Casimir forces [13]. The critical Casimir interaction between a colloid and a substrate which is chemically patterned with stripes of alternating adsorption preferences results in a laterally confining potential for the colloid, which can be controlled and reversibly switched on and off by varying the temperature of the near-critical solvent [14, 15, 16]. Recently, such a substrate has been realized by removing via a focused ion beam a regular pattern of equally spaced stripes from the hydrophobic HMDS-coating of a glass surface [14]. The effective interaction between this chemically patterned substrate and a colloidal particle has then been measured by monitoring via digital video microscopy the behaviour of a dilute solution of colloidal particles as the demixing critical point of the binary mixture of water and lutidine is approached [14]. In comparing these data with the corresponding theoretical predictions [15] it turned out that the critical Casimir potential resulting from a chemical pattern depends rather strongly on its geometrical details and it actually provides a sensitive tool to probe these microscopic features, which might not be easily accessible otherwise [15]. Indeed agreement between the theoretical predictions of Ref. [15] and the experimental data of Ref. [14] for the spatially varying effective potential was found only by assuming that the chemical steps between two subsequent stripes within the pattern were not microscopically sharp due to fluctuations inherent to the preparation process of the structures [15]. However, in spite of this improvement in the comparison between the shapes of the theoretical and experimental potentials, the analysis of the temperature dependence of the corresponding potential depths renders an amplitude of the correlation length (treated as a fitting parameter) which is about twice as large [15] as the one known from independent previous measurements. This persisting discrepancy, together with the necessity to test independently the aforementioned assumption used in Ref. [15], calls for a more detailed experimental study of the critical Casimir force acting in the presence of patterned substrates.
Colloidal suspensions are not only relevant as model systems in soft-matter physics but they may find also applications in integrated micro- and nano-devices. Since critical Casimir forces provide a tool to exert active control over the strength and the direction of interactions between colloids in such devices, a thorough quantitative understanding of the underlying physics is essential. Recently, it was theoretically predicted that for suitable geometrical parameters colloids can levitate in a stable position above chemically patterned substrates [16]. Such a “critical Casimir levitation” may even help in overcoming the problem of stiction which hampers the functioning of currently available micro- and nano-electromechanical devices. Therefore, in order to benefit from this wide range of possibilities, a theoretical understanding of the phenomenon and the experimental demonstration of its applicability are essential.
Here, we report on experimental studies of the critical Casimir interaction between a colloid and substrates which are chemically structured by microcontact printing of alkanethiols. We shall see below that, in the present context the substrates prepared by this technique turn out to exhibit higher chemical and geometrical resolution than those prepared via focused ion beam, which was used in previous experiments [14]. A dilute suspension of hydrophilic spherical colloids of radius which impose boundary conditions to a near-critical water-lutidine mixture is exposed to patterned substrates consisting of alternating and periodically repeating stripes of width with boundary conditions so that the periodicity is along the -direction, whereas the pattern is translationally invariant along the orthogonal -direction. In order to extend previous investigations [14, 15] to a wider range of chemical patterns, we consider here sequences of stripes with various periodicities and stripe widths . In particular this allows us to investigate the case in which the effects of neighboring chemical steps interfere, which strongly affects the resulting forces acting on the colloid. As in Ref. [14] we measure the laterally varying equilibrium spatial distribution of the colloids by digital video microscopy and define an effective potential on the basis of the equilibrium number density of the colloids projected along the vertical -direction (orthogonal to and ). We analyze theoretically this potential and the ensuing surface-to-surface distance of the colloid from the substrate and compare our findings with the experimental data. Our theoretical analysis provides accurate information also about the vertical probability distribution of the positions of the colloidal particles which, however, cannot be resolved by the kind of video microscopy used in the current experiment. For all stripe widths and temperatures studied we find quantitative agreement between the measurements and the theoretical predictions. Both the shapes and the depths of the measured potentials agree very well with the theoretical analysis. Moreover, the uncertainty of the actual position of the subsequent chemical steps is significantly reduced by using the present microcontact printing in order to structure the substrate. The amplitude of the bulk correlation length, which we estimate by comparing the depth of the measured potentials with the theoretical predictions, turns out to be in quantitative agreement with previous, independent estimates. Thus, our detailed comparison of experimental data and theory demonstrates that indeed the full benefits of the critical Casimir force can be reaped reliably and may be utilized in potential applications, opening a new route for using colloids as model systems or in micro- and nano-devices.
2 Theory
2.1 Critical Casimir potential
According to renormalization group theory, in the vicinity of the critical point at the normal and lateral critical Casimir forces as well as the corresponding potential can be described by universal scaling functions (see, e.g., Refs. [4, 5, 17]). These scaling functions are universal in the sense that they do not depend on molecular details but only on the gross features of the system and of the confining surfaces. These gross features, among which there are the spatial dimension , the symmetries of the system, and the geometry of the boundaries, determine the so-called bulk [4, 5] and surface [18, 19, 20, 4] universality classes of the associated critical point. The relevant thermodynamic properties which emerge upon approaching the point of the continuous phase transition can be understood and analyzed in terms of the fluctuations of the so-called order parameter of the phase transition. For the consolute point of phase segregation of a binary liquid mixture is given by the difference between the local and the mean concentration of one of the two components of the mixture; thus, it is a scalar quantity and the bulk universality class is of the so-called Ising type (see, e.g., Refs. [21, 10]). For classical binary liquid mixtures, the surfaces generically exhibit preferential adsorption for one of the two species of the mixture, which results in a local enhancement of the order parameter close to the surface. This enhancement is effectively described by symmetry-breaking surface fields [18, 19, 20, 4] and it is usually denoted by and boundary conditions (BC) corresponding to having a preference for and , respectively, at the surface. For the water-lutidine mixture we are interested in, one conventionally indicates the preferential adsorption for lutidine and water as and BC, respectively (see also Refs. [10, 21]). In the experimental setup described below, the lower critical demixing point of the water-lutidine mixture is always approached from the homogeneous (mixed) phase at temperatures upon increasing at fixed critical composition of the mixture. From the experimental point of view it is rather difficult to quantify the strength of the adsorption preference exhibited by the different portions of the surfaces. Therefore the comparison with theoretical predictions requires assumptions, which can be verified a posteriori. In the present case we have qualitative experimental evidence that the chemical treatment of the surfaces results in rather pronounced adsorption preferences and therefore we shall assume that the surfaces are characterized by the so-called strong critical adsorption fixed point [18, 19]. We consider here neither the opposite case of weak adsorption at the surfaces (see, e.g., Refs. [22, 23]) nor the effects due to off-critical compositions of the mixture, which might lead to a bridging transition analogous to capillary condensation (see, e.g., Refs. [21, 24, 25, 26, 27, 28, 29]).
For the film geometry — in which the binary liquid mixture is confined between two parallel, planar, and macroscopically extended walls at a distance — the normal critical Casimir force per unit area is given by [17]
| (1) |
where the index denotes the combination of BC and at the two walls. (In the absence of a symmetry-breaking bulk field within the film, which would correspond to an off-critical concentration of the mixture, one has .) The universal scaling functions depend only on the scaled variable , i.e., on the film thickness in units of the bulk correlation length . The functions have been calculated exactly in [30], for using perturbative field-theoretical methods [31] or effective theories [32], and in numerically via Monte Carlo simulations [33, 34, 35]. At present, a quantitatively reliable theoretical determination of both and in is provided only by Monte Carlo simulations. For a chemically structured wall opposing another planar wall forming a film geometry, the critical Casimir force has been obtained within mean-field theory (MFT) [13] and from Monte Carlo simulations [36, 37].
For a spherical colloid with BC opposite to a chemically patterned substrate with alternating and BC the critical Casimir potential has been calculated both numerically within full mean-field theory (corresponding to ) and by resorting to the so-called Derjaguin approximation exploiting the full knowledge of in the film geometry for [16]. Accordingly, the critical Casimir force and the critical Casimir potential for a colloid close to a chemically patterned wall can be expressed in terms of universal scaling functions which take the geometry into account and which depend on the following scaled quantities:
-
•
, where is the surface-to-surface distance between the colloid and the substrate,
-
•
, where is the radius of the spherical colloid,
-
•
, where is the lateral coordinate of the center of the colloid such that corresponds to the colloid being located opposite to the center of a stripe with BC,
-
•
, where is the periodicity of the stripe pattern along the -direction,
-
•
, where is the width of the stripes with BC.
In particular in the critical Casimir potential can be written as [16]
| (2) |
where is a universal scaling function. The realization of the present geometrical setup of a sphere facing a plane still represents a challenge for lattice based Monte Carlo simulations. Accordingly, up to now it is not possible to obtain accurate numerical data for this three-dimensional geometry and therefore one has to rely on the Derjaguin approximation (DA), based on the assumption of additivity, in order to calculate approximately the critical Casimir potential (see Ref. [16]). Within the Derjaguin approximation, the scaling function [Eq. (2)] can be expressed in terms of the known scaling functions for the film geometry [16]:
| (3) |
where
| (4) |
are the scaling functions of the critical Casimir potential of a colloid in front of a homogeneous wall as calculated within the Derjaguin approximation [10], and
| (5) |
with given by
| (6) |
where . For and there are analytic expressions for (see Eqs. (6) and (7) in Ref. [15], respectively). The accuracy of the Derjaguin approximation has been checked numerically within mean-field theory and it has turned out that this approximation describes quantitatively the actual behavior of those numerical data which correspond to for and , as well as to with and [16]. In the experiments discussed further below the corresponding values of , , and vary within these ranges so that, assuming that the previous quantitative conclusions extend to , we expect the Derjaguin approximation to be quantitatively reliable.
2.2 Background forces
In addition to the critical Casimir force due to the critical fluctuations of the solvent, the colloidal particles of the suspension are subjected to additional effective forces which are characterized by a smooth and rather mild dependence on temperature. Typical background forces acting within the colloidal suspensions of present interest are due to (screened) electrostatic and dispersion interactions and to the gravitational field. In a first approximation, which neglects possible mutual influences of these forces, their total potential is given by the sum of the corresponding contributions: (i) the electrostatic potential , (ii) the gravitational potential , (iii) the van der Waals interaction , and (iv) the effective critical Casimir potential .
Electrostatics — This interaction originates from the fact that, due to the formation of charge double-layers, the surface of the colloids and of the substrate acquire a surface charge once immersed in the liquid solvent. As a result, the polystyrene colloids of radius m and BC immersed in water-lutidine mixtures experience an electrostatic repulsion from the substrate. The screened electrostatic potential of the colloid at a surface-to-surface distance from a homogeneous substrate with BC is well approximated by
| (7) |
where is the screening length and describes the strength of the electrostatic repulsion from the substrate with BC. Although the values of these parameters are determined by the surface charge of the colloid, the dielectric constant of the mixture etc. [38], here they will be treated as fitting parameters of the actual experimental data for . In experimental conditions similar to the present ones as far as the mixture and the colloids are concerned, one finds nm [10, 23, 21] and m [10, 23, 21, 15] as typical values at . In view of a possible difference between and , the resulting electrostatic potential of a colloid close to a patterned substrate such as the one described above depends on the lateral position of the colloid. Such a dependence can be accounted for theoretically within the Derjaguin approximation (by repeating the calculations described in Appendices A.2, B, and C in Ref. [16] for ), which is expected to be particularly accurate due to the exponential decay of in Eq. (7) as a function of the distance from the substrate. For this electrostatic potential one therefore finds (for a colloid facing the center of a stripe at )
| (8) |
where
| (9) |
with m. and depend on the geometric parameters and describing the pattern.
Dispersion forces — For the particular choice of materials and conditions used in the present experiments, van der Waals forces turn out to be negligible compared with the other contributions [10, 21, 39, 15]. In addition, the temperature dependence of the dielectric permittivity of the water-lutidine mixture is negligible (see footnote 4 in Ref. [15]) and therefore no significant changes are expected to occur in and within the range of temperatures explored experimentally.
Gravity — Due to buoyancy the colloid immersed in the solvent above the patterned substrate experiences a gravitational potential given by
| (10) |
where g/cm3 and g/cm3 [40] are the mass densities of the polystyrene colloid and of the water-lutidine mixture at the critical composition and near , respectively, and m/s2 is the gravitational acceleration. Accordingly, at K one has m and therefore, compared to the other contributions, it turns out that the gravitational potential depends rather mildly on the distance because it varies only over a few on the relevant length scale of a few microns. The expression in Eq. (10) assumes that the colloidal particle of mass density is floating in a homogeneous medium of mass density . However, the laterally varying adsorption preferences of the substrate induce the formation of alternating water-rich or lutidine-rich regions close to the surface of the patterned substrate, which laterally alter the resulting mass density of the solvent as a consequence of water and lutidine having different mass densities. This implies that the effective gravitational constant acquires a dependence on . In addition, the preferential adsorption of the colloid, with the ensuing formation of an adsorption profile around it, can lead to a modification of the effective density of the colloid itself. However, on the basis of our estimates, we expect all these effects to be negligible for the present experimental conditions [15].
2.3 Total potential
The total potential of the sum of the forces acting on the colloid is given by
| (11) |
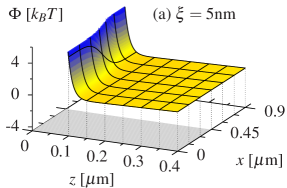
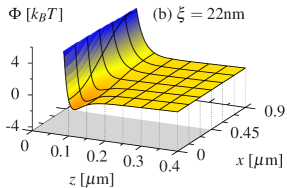
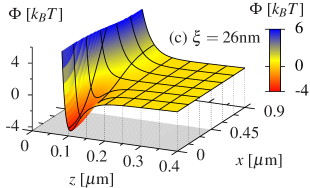
where the theoretical expressions for the individual contributions are given by Eqs. (2), (8), and (10). Here and in the following we do not indicate the dependence of on , , and , because the values of these parameters are fixed for each individual experiment. Figure 1 shows the total potential of a single colloid with BC opposite to a chemically patterned substrate, as a function of both and and for three values of the temperature close to the critical value . These three values correspond to different correlation lengths , as indicated in the figure. The gray area in the - plane indicates the vertical projection of the stripe with BC, the center of which corresponds to . In Fig. 1 the white part of the - plane corresponds to the projection of the stripe with BC, the center of which is located at m. The potential of the forces acting on the colloid is translationally invariant along the -direction which is not shown in Fig. 1. in Fig. 1 has been calculated by using geometrical and interaction parameters which mimic the actual experimental conditions and by using values of the correlation length which are experimentally available. As anticipated above, Fig. 1 clearly shows that the gravitational tail of the potential, which characterizes at large values of , is indeed rather flat on the scales of and of hundreds of nm. As a consequence of thermal fluctuations — which cause the colloid to explore a region of space within which the total potential differs from its minimum by a few — the particle is expected to display large fluctuations along the vertical direction. At small particle-substrate distances electrostatic forces are responsible for the strong repulsion of the colloid from the substrate. In Fig. 1 we allowed for a lateral inhomogeneity of the electrostatic potential (i.e., ), which might occur due to different surface charges on the different stripes. This is clearly visible in panel (a) of Fig. 1, which corresponds to a rather small value of the correlation length so that, within the range m Fig. 1(a) refers to, the contributions of the critical Casimir force are negligible. In this case, the -dependent electrostatic contribution dominates at small values of , whereas the laterally homogeneous gravitational potential dominates at larger distances. However, upon approaching the critical point [Figs. 1(b) and 1(c)], the correlation length increases and the critical Casimir force acting on the colloid builds up; it is repulsive within the region with BC whereas it is attractive within the region with BC. In the latter case the behavior of the colloid is eventually determined by the electrostatic repulsion and the attractive critical Casimir force, whereas in the former case it is determined by gravitation and the repulsive Casimir effect. Above a certain threshold value of , which depends on the specific choice of the various geometrical and physical parameters, a very deep and steep potential well develops rapidly close to the stripe with BC, which therefore confines the vertical motion of the colloid at much smaller values of than before with very limited thermal fluctuations of the particle-wall distance. In contrast, the vertical repulsive critical Casimir force, which the colloid experiences above the stripe with BC, pushes it further away from the surface, but the corresponding fluctuations of the vertical position (still limited only by the gravitational tail) are not significantly affected. Thus, the full theoretical analysis of the various forces at play reveals a rather interesting energy landscape which is strongly temperature dependent.
2.4 Measured potential
In order to measure experimentally the total potential of the forces acting on a colloid a very effective approach consists in monitoring the equilibrium Brownian motion of a single particle and inferring from the sampled probability distribution function the potential as , where and are the lateral coordinates of the projection of the colloid center onto the substrate surface. This approach forms the basis of total internal reflection microscopy, which has been used in Refs. [10, 23, 21] to study critical Casimir forces. Alternatively, one can study a colloidal suspension which is sufficiently dilute so that the inter-particle interaction is negligible. In this case, the mean equilibrium number density of the colloids at position is proportional to the single-colloid probability distribution function and therefore it is again given by . In the experimental setup described below, the positions of the centers of the colloids are monitored via a digital video camera positioned below the substrate. Accordingly, the surface-to-surface distances of the colloids from the substrate are not resolved and the camera records only the projected number density . Due to the translational invariance of the chemical pattern along the direction of length , the density can be conveniently projected further onto the -axis, resulting in an effective number density , which depends only on . This projection increases the statistics and therefore the accuracy with which this projected density can be determined experimentally. Subsequently, an effective potential (up to an irrelevant additive constant) can be associated with such that . (Note that due to the thermal fluctuations of the colloids along the vertical direction, even if one knows the average distance of the colloid from the substrate at a certain lateral position , the effective potential is not simply given by , as it was implicitly assumed in Ref. [14].) The measured potential
| (12) |
is eventually defined such that it vanishes for a colloid opposite to the center of a repulsive stripe at . We emphasize that contains universal ingredients stemming from the scaling function associated with (see Eq. (11)) as well as nonuniversal contributions due to and .
2.5 Non-ideal stripe patterns
Due to the preparation process (see below) the actual position of each chemical step separating two adjacent stripes might vary smoothly along the -axis. This variation affects the measured effective potential of the colloids as long as it occurs on a length scale which is comparable to or smaller than the typical distance along the -axis which each particle explores during the acquisition of the images by the camera. The images aquired during the experiments allow one to estimate such a mean-square displacement to be of the order of tens of m [41, 15, 14]. The projection along the -axis, which yields the density , effectively causes a broadening of compared to the case of straight (ideal) chemical steps with . In addition, locally a smooth intrinsic chemical gradient of the step leads to such an effect, too. For illustration purposes, we first consider a single chemical step, which is ideally located at and which generates a potential . (This reasoning can be extended to the periodic chemical pattern we are presently interested in by assuming additivity of the forces, see Ref. [16] for details.) In order to estimate the effect of these variations of the actual position of the step along the -axis, we assume that the local position of the step does not change significantly along the -axis on the scale of the radius of the colloid, so that on this scale it can be considered as ideal and therefore generates a potential . For we assume an effective Gaussian distribution along the -axis, with zero average and standard deviation . Accordingly, the projection along the -axis turns into and affects the resulting projected density and the resulting potential [see Eq. (12)].
2.6 Particle-substrate distance
The theoretical knowledge of the total potential [see Eq. (11)] allows one to predict the particle-substrate distance as a function of the lateral variable and temperature, a quantity which is not accessible to the experiments discussed below. As anticipated above, the rather small value of in Eq. (10) is responsible for rather large fluctuations of the particle-substrate distance around the position at which the potential has a minimum as a function of for a fixed lateral position of the particle and which corresponds to the position of mechanical equilibrium. In the presence of these large fluctuations it is convenient to consider the -dependent mean particle-substrate distance , which is determined by the probability distribution function of the colloid, i.e., by the total potential as222Note that the Derjaguin approximation holds only for distances which are small on the scale of the particle size (a detailed analysis of its applicability for the system under consideration is given in Ref. [16]). However, in Eq. (13) also large values of occur. But at these large particle-wall distances the critical Casimir force as well as the electrostatic force are negligibly small compared to the gravitational force, so that using this approximation is nonetheless not detrimental. In principle, the integration in Eq. (13) is limited by the vertical extension of the experimental sample cell of around m. However, due to the gravitational contribution to the potential, de facto no colloidal particle moves out of the vertical field of view of the imaging objective. Thus the integration in Eq. (13) can be taken to run up to infinity without quantitatively relevant consequences because contributions from large are strongly suppressed.
| (13) |
where is the normalization. In order to describe the thermal fluctuations of the vertical position of the colloid it is convenient to consider the probability that for a fixed lateral position the colloid has a surface-to-surface distance from the substrate smaller than a given :
| (14) |
In order to generalize the notion of “standard deviation” to the present case of an asymmetric distribution of the particle-substrate distances at fixed lateral position, we define a lower value and an upper value of the particle-substrate distances such that
| (15) |
so that the probability of the colloid to be at a distance with is , whereas the probability to find it at distances smaller (larger) than () is ; these two properties define the standard deviation for a Gaussian distribution.
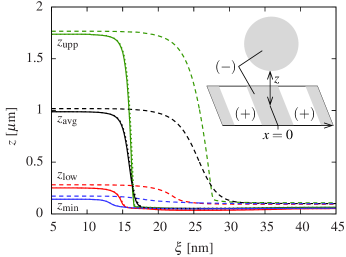
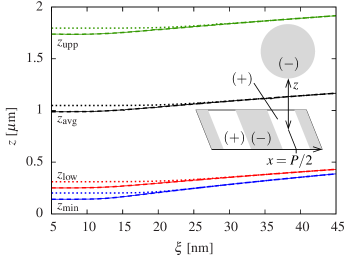
Figure 2 shows the behavior of the colloid with BC above a chemically patterned substrate for the two lateral positions (a) and (b) at which the colloid is floating above the center of a and of a stripe, respectively, as a function of the correlation length . In Fig. 2 the values of the geometrical parameters (, , ) are chosen to correspond to the actual experimental conditions, whereas the parameters governing the electrostatic repulsion from the substrate are varied within a range which was determined by previous independent experiments. Panel (a) clearly demonstrates that the fluctuations of for a colloid opposite to an attractive stripe decrease significantly upon increasing the correlation length above a certain threshold value which depends on . This reflects the emergence of the deep potential well shown in Fig. 1 which results from the competition between an increasingly attractive critical Casimir force and a repulsive electrostatic repulsion, the former being always overwhelmed by the latter around . Indeed, for small values of the average position is typically determined by the competition between the electrostatic repulsion and the gravitational part, such that m with fluctuations of the order of m. On the other hand, for larger values of , one has and there are only very small thermal fluctuations of the particle-substrate distance, at most a few tens of nm. Depending on the relative strength of the electrostatic repulsion and the critical Casimir attraction, one can have if the former dominates the latter, i.e., at small values of or the opposite at large values of . From Fig. 2(a) one concludes that the choice of strongly affects the behavior of the particle, both in determining the values of and in setting the threshold value of above which the particle becomes strongly confined, whereas the dependence on is negligible for the behavior at , because controls the electrostatic interaction with the adjacent stripe. Analogously, the behavior of a colloid at as shown in Fig. 2(b), i.e., opposite to a repulsive stripe is not affected by the choice of . However, for this configuration, also the actual value of does not affect significantly the resulting behavior of the particle-substrate distance at , in particular for large values of . Indeed, due to the repulsive nature of both the electrostatic and the critical Casimir force and the weak gravitational attraction, the average position is typically of the order of (with an additional linear contribution for large values of ) allowing fluctuations of the order of m.
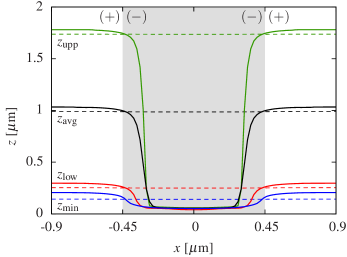
In Fig. 3 the particle-substrate distance (characterized via ) and the position of mechanical equilibrium are reported as functions of the lateral coordinate of the colloid within the period and for two different temperatures, i.e., two different values of . In Fig. 3, the choice of the parameters corresponds to actually experimentally accessible values. Figure 3 clearly shows that for nm (dashed lines) the particle-substrate distance is laterally constant and the colloid does not react to the presence of the chemical pattern on the substrate, apart for a possible effect due to a change in the electrostatic interaction (which here is taken to be the same on the different stripes). On the other hand, for nm (solid line) the colloid is strongly attracted to that part of the substrate with the same preferential adsorption (in Fig. 3 indicated by a shaded background), as a consequence of the emerging critical Casimir forces. Indeed for the particle is abruptly localized at a distance , which is primarily set by the electrostatic repulsion and which corresponds to the position of the minimum of the potential, with almost no thermal fluctuations. In the region above the repulsive stripes (in Fig. 3 indicated by a white background) and within the temperature range considered here, instead, the repulsive critical Casimir force pushes the colloid only slightly further away from the substrate, by a distance of the order of the increasing correlation length . But the amplitude of the thermal fluctuations of the particle-substrate distance are barely affected by the onset of the repulsive critical Casimir force.
The analysis of the particle-substrate distance shows that the behavior of the colloidal particle and the resulting potential are drastically influenced by the strong attraction of the colloid close to an attractive stripe. Accordingly, the electrostatic repulsion from this stripe, i.e., the value of , affects significantly the total potential and has therefore to be considered carefully in the comparison between theoretical predictions and the experimental data. On the contrary, the actual value of as well as the actual value of do not significantly affect the resulting behavior of the potentials as long as they are within the range appropriate for the present experiment which can be inferred from previous, independent measurements [21].
3 Experimental setup
In the present context of critical Casimir forces, surfaces with a periodic pattern of alternating stripes with opposite adsorption preferences for the two components of the binary mixture of water and lutidine were obtained by micro-contact printing (CP) of alkanethiols. Since there is a vast literature covering this technique [44, 43, 42] here we shall describe it only briefly. Stamps were prepared by casting poly(dimethylsiloxane) (PMDS) onto a master which was topographically structured by a lithographic process. After the PMDS is cured one obtains an elastic stamp which exhibits the negative structure of the master. In the next step the stamp is wetted with a 1mM ethanolic solution of nonpolar thiol. When the excess liquid is removed, the stamp is brought into mechanical contact for several seconds with a glass substrate coated by a nm layer of gold. This results in hydrophobic regions the geometry of which corresponds to the protruding parts of the stamp. Finally, the substrate is dipped into a 1mM ethanolic solution of polar thiol for several minutes in order to render the remaining bare gold surface hydrophilic. With this technique we were able to produce periodic arrays of hydrophilic and hydrophobic stripes of widths between m and m over a typical total extension of cm2. The typical lateral edge resolution of the chemical structures is of the order of nm. In previous studies [14] the chemical patterns were created by removing locally a hydrophobic monolayer from a hydrophilic surfaces with a focused ion beam (FIB). Although under ideal conditions the resolution of FIB is within the range of several nanometers, in the case of non-conducting surfaces we observed distortions/deflections of the ion beam due to an electrostatic charging of the glass surface, leading to deviations of the chemical steps from straight lines. This causes considerable discrepancies between the measured critical Casimir forces acting on particles near such surfaces and the corresponding theoretical predictions, which assume straight and sharp boundaries for the stripes [15]. Since such charging effects are basically absent in CP, here we have an improved control of the geometrical structure of the imprinted chemical pattern and therefore much better agreement with theory (see below).
In order to probe the critical Casimir forces which act on a colloidal particle exposed to the patterned substrates prepared as described above, we used polystyrene (PS) probe particles with radius m. Their surface charge, as provided from the manufacturer, is C/cm2 which renders them hydrophilic, realizing boundary conditions. The particles were dissolved in a critical water-2,6-lutidine mixture which has a lower critical demixing point at a lutidine mass fraction of and a critical temperature of K. Particle positions were monitored by digital video microscopy which allows one to track the projection of their centers onto the substrate plane with a spatial resolution of about 50 nm. For each measurement the particle trajectories were recorded for 40 minutes with a frequency of 4 frames per second. Within the field of view of mm around 20 to 40 particles have been monitored, corresponding to a projected density of one particle per square of the size of 2525 to 1717 particle diameters. Thus, the particle density was sufficiently small to exclude the presence of critical Casimir forces among neighboring colloids, such that only their interaction with the patterned substrate is probed during the measurements.
The temperature of the sample was controlled by the procedure described in detail in Ref. [14]. With this setup, temperatures close to could be stabilized within over several hours. In contrast to temperature changes, which could be resolved within mK accuracy, larger errors in the determination of absolute temperatures (in particular the measured critical temperature) occur. This is due to the fact, that the metal-resistance thermometer (Pt100) could not be placed within the sample cell but it was instead attached outside but close to the field of view. Indeed, the thermometer measures a temperature lower than the actual temperature inside the sample cell. We associate the temperature with the critical temperature of the solvent in the sample at that particular temperature for which critical opalescence is observed when shining a laser beam into the sample cell. This leads to systematic errors on the absolute temperature of and of the order of . Using the assumption that (this constant could not be determined and is inter alia dependent on the ambient temperature), we have measured the temperature difference and identified it with . Since the comparison with the theoretical predictions depends crucially on the actual value K of the critical temperature, in the analysis below we account for such a possible systematic error by considering as an additional fitting parameter, where K is the actual critical temperature of the water-lutidine mixture.
4 Comparison of theory with experiments
The total potential of the forces [Eq. (11)] acting on the colloidal particle has been calculated on the basis of the Derjaguin approximation with [see Eqs. (1) and (6)] obtained from Monte Carlo simulations. In the following we shall use for the scaling functions of the critical Casimir force between two planar walls with BC the numerical estimate referred to as “approximation (i)” in Figs. 9 and 10 of Ref. [34]. We have checked that different [34] or more recent and accurate [35] estimates for actually lead to essentially the same effective potentials, the only difference being a small additional overall shift of the resulting fitted value of the critical temperature (see further below). A detailed analysis in spatial dimension suggests that the Derjaguin approximation we have used in our theoretical predictions for should be rather accurate in describing the actual potential of the colloid within the range of parameters experimentally studied here [16]. As anticipated above, in order to predict the effective potential we need to fix also the value of the parameters which determine the electrostatic interaction. For the comparison between theory and experiment we fix the screening length to the value nm which has been reported from independent measurements on the same system (see, e.g., Ref. [21]). In order to fit our theoretical predictions to the experimental data, we vary instead the unknown values of the parameters [Eqs. (7) and (8)] within the range m, which can be reasonably expected on the basis of previous measurements on homogeneous substrates [21]. However, the results for are hardly affected by the particular choice of so that in the following we keep it fixed at m. The amplitude of the correlation length has been determined by independent experiments as nm (see, e.g., Tab. III in Ref. [21]) so that we vary within the range nm in order to obtain the best fit to the experimental data by the theoretical scaling functions. Moreover, as mentioned above, the experimental uncertainty in the determination of the absolute value of the critical temperature is taken into account by considering as an additional fitting parameter the shift (see the end of Sec. 3) of up to mK. (The values of may be different for the individual stripe widths which characterize the substrates investigated in independent experimental runs.) However, the relative uncertainty in the determination of the temperature within a single experimental run for a given stripe width is smaller than mK (see above). Thus, for the comparison carried out below, we are left with , , , and (see Subsec. 2.5) as fitting parameters which, however, are all limited to rather small ranges of values in order to be in accordance with independent and previous experimental results.
4.1 Depth of the potential
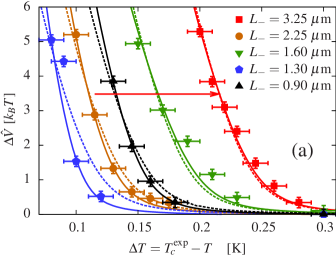
The depth of the measured laterally confining potential is given by [see Eq. (12)]. Figure 4(a) shows as a function of the deviation of the temperature from the experimentally determined critical demixing temperature , for various stripe widths and measured in independent experimental runs as described above. The periodicities of the various patterns the stripes belong to are determined from the photolithography mask and are given in Tab. 4.1. The potential depth is determined as the difference of the potential between its value at the center of a repulsive stripe and at the center of an attractive stripe, carrying an uncertainty of near the critical temperature K. Upon approaching , for a stripe width m the effects of two adjacent chemical steps interfere, which results in an effectively reduced potential depth compared to the case of a very wide stripe (see the dashed curves in Fig. 4(b); in Fig. 4(a) the experimental uncertainty in determining the critical temperature is responsible for the relative displacements among the various curves).
The effect of non-ideal chemical steps may result in an effectively reduced potential depth as well (see, for example, Fig. 4(b) and, c.f., Fig. 6(b)). Accordingly, in comparing the experimental data for with the theoretical predictions we allow for an uncertainty in the local position of the boundary between adjacent stripes, as described in Subsec. 2.5. However, as will be shown below, we are able to determine rather precisely from the lateral variation of the potential. The values of , which yield the best agreement and which are used for the comparison shown in Fig. 4, are given in Tab. 4.1. On the basis of our theoretical analysis, it turns out that the temperature dependence of the potential depth becomes independent of the stripe width when the latter is sufficiently large. Adopting for the geometrical and physical parameters the values corresponding to the present experimental conditions, this is expected to occur for m. From Fig. 4 one can see, however, that the experimentally determined data for individual experimental runs are shifted along the temperature axis with respect to each other, which reflects the uncertainty of up to 100mK in measuring the absolute value of the critical temperature. On the other hand, within a single individual experimental run corresponding to a certain stripe width, the temperature difference between the various data points can be measured with the high accuracy of less than mK. Upon comparing the experimental data shown as symbols in Fig. 4 with our theoretical predictions we take this into account by introducing, for each value of , a possible shift between the actual critical temperature and the value determined in that particular experiment. Accordingly, for the data corresponding to a certain , the actual distance from the critical point is given by .
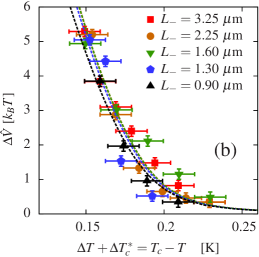
The dashed curves in Fig. 4 correspond to the common fit to all experimental data which leads to the fitting parameters and taking the same values nm and m for all as obtained from the least-square method. On the other hand, the individual temperature shifts are given in Tab. 4.1 for each data set corresponding to a single value of . The values of and are both in agreement with independent previous findings [21]. Figure 4(b) shows the depth of the potentials as a function of , i.e., shifted along the temperature axis by as given in Tab. 4.1. This accounts for the uncertainty in determining experimentally the absolute value of the temperature (see the discussion at the end of Sec. 3), and indeed, as expected for significantly wide stripes , the data overlap with each other within the error bars, reflecting that in this limit is independent of .
The solid lines in Fig. 4(a) correspond to fits of the theoretical predictions to each individual experiment dealing with a specific stripe width. Distinct from the previous common fit, here for each stripe width we allow for a variation of the values of and in addition to and . On the basis of a least-square fit, best agreement is obtained for the values given in Tab. 4.1, which agree with those obtained in independent previous studies [21] within the corresponding experimental accuracy.
Values of the parameters for which best agreement is obtained between theory and the data for for each individual experimental run, corresponding to a single value of (see Fig. 4(a)). The values nm and m are fixed because their choice does not affect significantly the resulting theoretical curves in Fig. 4. \toprule[m] a [m] b [m] c [nm] [m] [mK] [m] d \colrule6.0 3.0 3.25 0.22 0.103 86 0.15 5.4 2.7 2.25 0.21 0.128 -5 0.10 4.2 2.1 1.60 0.22 0.095 88 0.22 3.6 1.8 1.30 0.19 0.140 -18 0.19 1.8 0.9 0.90 0.20 0.121 -28 0.09 \botrule \tabnoteaMost of the experimental data for the potential discussed here are not influenced by the actual value of as long as . Accordingly, we assume the periodicity to be the one determined by the inscribed photolithographic mask pattern reported here. \tabnotebWidth of the stripes of the photolithographic mask pattern. Due to the CP stamping process we estimate the uncertainty of the actual width of the thiol stripes to be up to m. \tabnotecValue of the stripe width for which best agreement between theory and experiment is obtained. \tabnotedValue of for which best agreement between theory and experiment is obtained (see Figs. 5 and 6).
Values of the parameters for which best agreement is obtained between theory and all experimental data together (see Fig. 4(b)), so that the values of and are the same, and (in addition to determined from the shape of the potentials; see below) is the only parameter allowed to vary for the various stripe widths . As in Tab. 4.1, the values of nm and m are fixed. (For a description of the parameter values , , and see the footnotes in Tab. 4.1.) \toprule[m] a [m] [m] [nm] [m] [mK] [m] \colrule6.0 3.0 3.25 0.22 0.110 49 0.15 5.4 2.7 2.25 0.22 0.110 54 0.10 4.2 2.1 1.60 0.22 0.110 0 0.22 3.6 1.8 1.30 0.22 0.110 72 0.19 1.8 0.9 0.90 0.22 0.110 29 0.09 \botrule
4.2 Shape of the potentials
Figures 5 and 6 show the total potential of the forces acting on the colloid as a function of its lateral position for various temperatures and for two stripe widths. Symbols represent the experimental data, whereas the solid and dashed lines are the corresponding theoretical predictions with , , and fixed to the values reported in Tab. 4.1, which have been determined from the fit of the depth of the potential. In addition, for a few cases and as indicated in the figure captions, we use the leeway provided by the experimental uncertainty of mK for the temperature value. The dashed lines in Figs. 5 and 6 are based on the assumption that the stripe patterns are ideal whereas the solid ones refer to non-ideal patterns for which we fitted the parameters (see Subsec. 2.5) in order to obtain the best agreement between theoretical predictions and the set of experimental data at distinct temperatures. The resulting values of for the various widths of the pattern are reported in Tab. 4.1. In fact, the broadness of the transition regions across the chemical steps of between its extremal values is affected practically exclusively by among the fitting parameters. We have checked that the other parameters and potential additional effects such as polydispersity and weak adsorption cannot account for the discrepancies of the slopes of the dashed curves and the experimentally determined ones (see also Ref. [15]). Thus, and are determined de facto independently of the choice of , , and and in the following they can be regarded fixed upon variation of the values of these latter parameters. In particular, this is important for narrow stripes as shown in Fig. 6, where even the depth of the potential depends on and , in contrast to broader stripes.
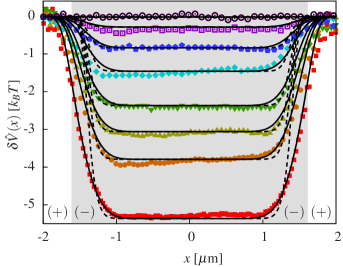
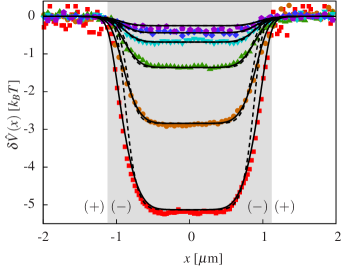
As anticipated, in the case of rather large stripe widths m and m shown in Fig. 5 and for the temperatures considered here the effects of two neighboring chemical steps do not interfere and the resulting potential across the center of the attractive chemical stripe is flat. Accordingly, from the comparison between the experimental data for the shapes of the potentials and the corresponding theoretical prediction we can infer the width of the stripes — now treated as a fitting parameter — independently of its initially assumed value determined by the width of the photolithography mask. Indeed, the actual width of the stripe imprinted by the mask may differ by up to m from characterizing the mask itself. It is only which is controlled during the preparation process [41]. On the other hand, the actual value of is the same as the one of the photolithography mask because the periodicity is not affected by the stamping process. (Note that, within the parameter range investigated in Fig. 5, the effects of neighboring chemical steps do not influence each other and therefore the actual value of the periodicity of the pattern does not affect the determination of .) In agreement with this observation, the comparison with the theoretical predictions leads to fitted values which are within the aforementioned range indicated in Tab. 4.1. From Fig. 5 we find that the experimental techniques described above lead to rather sharp chemical steps between two stripes with an uncertainty of only m.
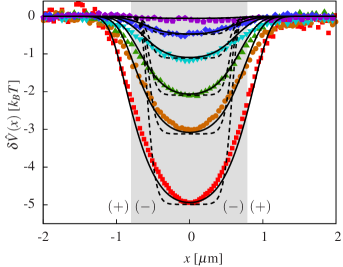
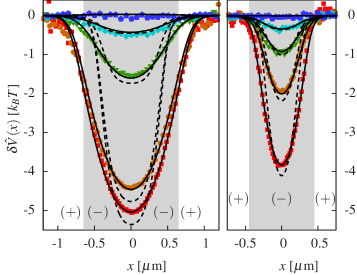
The comparison for narrower stripe widths m is shown in Fig. 6. Even for these cases, in which the effects of two neighboring chemical steps do interfere, the experimental data agree very well with the theoretical predictions obtained from the Derjaguin approximation. Whereas for m and m we have to take into account an uncertainty of the position and associated with the shape of the chemical steps of about m, for the smallest stripe width m the chemical pattern turns out to be almost ideal with m (see Tab. 4.1).
5 Conclusions and Outlook
5.1 Summary
We have presented a detailed theoretical and experimental study of the effective solvent-mediated forces acting on colloids suspended in a near-critical binary liquid mixture of water and 2,6-lutidine and close to chemically patterned substrates. In contrast to earlier investigations [14] we have obtained a chemical pattern of stripes of different widths and with laterally alternating adsorption preferences for either lutidine [ boundary condition] or water [ boundary condition] by monolayers of thiols deposited on gold-coated substrates via microcontact printing. The solute colloidal particles — m diameter polystyrene spheres — were rendered hydrophilic, corresponding to boundary conditions, due to their surface charge. Based on digital video microscopy our main experimental findings are the following.
-
1.
At the fixed critical composition of the water-lutidine mixture, upon raising the temperature towards its lower critical demixing point at , lateral forces acting on the colloidal particles arise gradually. These critical Casimir forces cause the colloidal particles to be attracted to those chemical stripes which have the same adsorption preference as the particles and to be repelled from those stripes with the opposite adsorption preference.
-
2.
These lateral and normal contributions to the total effective forces (compare Subsec. 2.2) are negligible at temperatures more than a few hundred mK away from the critical value but they increase significantly upon approaching . Eventually, they lead to laterally confining potentials for the colloidal particles with potential depths of several (see Fig. 4). These potentials can be reversibly tuned by minute temperature changes.
-
3.
Across a chemical step the critical Casimir potentials vary rather abruptly between two plateau values on a length scale of m (see Fig. 5). This indicates that the microscopic structures of the chemical steps formed by imprinted layers of alkanethiols with different endgroups are much sharper than those created previously by a focused ion beam [14].
-
4.
For rather narrow stripes of widths m the effects of two neighboring chemical steps interfere and consequently reduce the potential depth and lead to rounded shapes of the effective potentials (see Fig. 6).
These experimental observations can be consistently interpreted in terms of the occurrence of the critical Casimir effect, and it is possible to quantitatively compare the measured potentials with the corresponding theoretical predictions. We have derived the effective potentials within the Derjaguin approximation (see Subsec. 2.1 and Ref. [16]) based on universal scaling functions for the critical Casimir force between two plates with or boundary conditions as obtained from Monte Carlo simulation data. (Differences in estimates for these scaling functions as obtained from various Monte Carlo simulations do not affect our results significantly.) In contrast to the present experimental measurements we are able to theoretically analyze the spatially fully resolved critical Casimir potential acting on a colloid. The resulting energy landscape for a colloidal particle is rather rich due to the interplay of several relevant forces, which we have taken into account (see Fig. 1). Typically, thermal fluctuations lead to large fluctuations of the lateral position and the distance between the colloidal particles and the substrate (see Fig. 2). Upon approaching , however, strong normal and lateral critical Casimir forces abruptly localize the colloids very close to and above stripes exhibiting the same adsorption preference as the particles (see Fig. 3). In calculating the effectively one-dimensional, projected potentials for a single colloid, as they are obtained experimentally, we also take into account the possibility that the chemical pattern is not ideal, in addition to other experimental uncertainties. Not only the theoretical predictions for the potential depths agree with the experimental data (see Fig. 4) but also the correlation length , as determined from our comparison, follows rather well the expected universal power-law behavior and the associated non-universal amplitude is in agreement with previous independent experimental determinations (see Tab. 4.1). Moreover, the shapes of the potentials as a function of the lateral position of the colloid show good agreement between the theory and the experiments (see Figs. 5 and 6). Since critical Casimir forces probe rather sensitively the details of the geometry of the patterns [15], we find that the chemical steps obtained by the experimental method used here are sharp, with deviations of only a few percent in terms of the stripe width. From the detailed comparison with rather narrow chemical stripes (see Fig. 6(b)) we infer that even for such cases the Derjaguin approximation describes the actual behavior quite well, as expected from a corresponding theoretical analysis within mean-field theory [16]. We conclude that the quantitatively successful comparison between the experimental data and the theoretical predictions demonstrates the significance and reliability of the critical Casimir effect for colloidal suspensions and reveals a new means of using them as model systems in soft-matter physics or in applications in integrated micro- or nano-devices.
5.2 Perspectives
“After many failures, involving many fluid samples, I did succeed in levitating a hard platelet.”
— Robert Evans.
Since quantum-electrodynamic Casimir forces acting on the scale of nm and m are typically always attractive, they are responsible for stiction occurring in micro- and nano-mechanical devices. According to a generalization of the Earnshaw theorem, for quantum Casimir forces acting on conventional materials in vacuum, stable levitation is not possible [45]. Therefore, in order to overcome the problem of stiction using the quantum-electrodynamic Casimir effect the system must be immersed in a fluid and the bodies have to be designed very specifically [46, 47]. Obviously however, for a system immersed in a fluid it is natural to use solvent-mediated forces such as the critical Casimir forces to control its behavior. Since one can obtain attractive and repulsive critical Casimir forces by suitable surface treatments as discussed here, a properly chosen combination of chemical substrate patterns may easily lead to levitation of a colloidal particle at a stable height above the substrate [16]. One finds that this critical Casimir levitation not only can be achieved without involving any other additional force but that the stable equilibrium distance between the wall and the colloid can be tuned steeply by varying the temperature [16]. Recently [16] it was predicted that the ranges of geometrical parameters for a pattern of laterally alternating stripes (as discussed here), which allow for critical Casimir levitation of colloidal particles, are rather large. Moreover, critical Casimir levitation is robust even in the presence of other forces and of thermal fluctuations [16] as they occur typically in colloidal suspensions, so that an experimental realization of this effect appears to be possible. These results show that chemical patterning of substrates allows one to design the critical Casimir effect over a wide range of properties.
“Ions are the invention of the devil.”
— Robert Evans.
By adding salt to the solvent of the colloidal suspension the electrostatic repulsion between the substrate and a colloid is strongly screened; this provides the possibility to explore the spatial variation of critical Casimir forces over a much wider range of distances and correlation lengths of the fluid. Moreover, a rather complex behavior of the resulting forces acting on the colloid can be expected because electrostatic forces induced by ions lead to rather delicate physical features. Recently, preliminary measurements have shown a rich and novel behavior of a colloid immersed in a salt-rich solvent upon approaching the critical point [48]. The onset of strong attractive forces even several K below the critical temperature is observed and, in addition, these forces are found to remain attractive, independent of the boundary conditions, or , throughout a large temperature range. Currently it is not clear whether these observations can be entirely attributed to critical Casimir forces or whether, e.g., the coupling between electrostatic interactions and critical fluctuations has to be considered. Thus, using these intriguing effects together with a chemical patterning of substrates may open a new field of phenomena with potential applications in colloid science.
Acknowledgement
It is a great pleasure for the authors to dedicate this paper to Bob Evans on the occasion of his 65th birthday in view of his long lasting inspiration and encouragement across many fields of statistical physics.
References
- [1] M.E. Fisher and P.G. de Gennes, C. R. Acad. Sci., Paris, Ser. B 287, 207 (1978).
- [2] H.G.B. Casimir, Proc. K. Ned. Akad. Wet. 51, 793 (1948).
- [3] M. Kardar and R. Golestanian, Rev. Mod. Phys. 71, 1233 (1999).
- [4] M. Krech, The Casimir Effect in Critical Systems (World Scientific, Singapore, 1994).
- [5] J.G. Brankov, D.M. Danchev and N.S. Tonchev, Theory of critical phenomena in finite size systems (World Scientific, Singapore, 2000).
- [6] A. Gambassi, J. Phys.: Conf. Ser. 161, 012037 (2009).
- [7] R. Garcia and M.H.W. Chan, Phys. Rev. Lett. 83, 1187 (1999); ibid 88, 086101 (2002).
- [8] A. Ganshin, S. Scheidemantel, R. Garcia and M.H.W. Chan, Phys. Rev. Lett. 97, 075301 (2006).
- [9] M. Fukuto, Y.F. Yano and P.S. Pershan, Phys. Rev. Lett. 94, 135702 (2005).
- [10] C. Hertlein, L. Helden, A. Gambassi, S. Dietrich and C. Bechinger, Nature 451, 172 (2008).
- [11] M. Tröndle, L. Harnau and S. Dietrich, J. Chem. Phys. 129, 124716 (2008).
- [12] S. Kondrat, L. Harnau and S. Dietrich, J. Chem. Phys. 131, 204902 (2009).
- [13] M. Sprenger, F. Schlesener and S. Dietrich, J. Chem. Phys. 124, 134703 (2006).
- [14] F. Soyka, O. Zvyagolskaya, C. Hertlein, L. Helden and C. Bechinger, Phys. Rev. Lett. 101, 208301 (2008).
- [15] M. Tröndle, S. Kondrat, A. Gambassi, L. Harnau and S. Dietrich, EPL 88, 40004 (2009).
- [16] M. Tröndle, S. Kondrat, A. Gambassi, L. Harnau and S. Dietrich, J. Chem. Phys. 133, 074702 (2010).
- [17] M. Krech and S. Dietrich, Phys. Rev. Lett. 66, 345 (1991); Phys. Rev. A 46, 1886 (1992); ibid 1922 (1992).
- [18] K. Binder, Critical Behavior at Surfaces, in Phase Transitions and Critical Phenomena, edited by C. Domb and J. L. Lebowitz, Vol. 8 (Academic, London, 1983), p. 1.
- [19] H.W. Diehl, Field-theoretical Approach to Critical Behaviour at Surfaces, in Phase Transitions and Critical Phenomena, edited by C. Domb and J. L. Lebowitz, Vol. 10 (Academic, London, 1986), p. 75.
- [20] H.W. Diehl, Int. J. Mod. Phys. B 11, 3503 (1997).
- [21] A. Gambassi, A. Maciołek, C. Hertlein, U. Nellen, L. Helden, C. Bechinger and S. Dietrich, Phys. Rev. E 80, 061143 (2009).
- [22] T.F. Mohry, A. Maciołek and S. Dietrich, Phys. Rev. E 81, 061117 (2010).
- [23] U. Nellen, L. Helden and C. Bechinger, EPL 88, 26001 (2009).
- [24] F. Schlesener, A. Hanke and S. Dietrich, J. Stat. Phys. 110, 981 (2003).
- [25] A. Drzewiński, A. Maciołek and R. Evans, Phys. Rev. Lett. 85, 3079 (2000).
- [26] A. Maciołek, A. Drzewiński and R. Evans, Phys. Rev. E 64, 056137 (2001).
- [27] R. Evans, J. Phys. Cond. Mat. 2, 8989 (1990).
- [28] T. Bieker and S. Dietrich, Physica A 252, 85 (1998).
- [29] C. Bauer, T. Bieker and S. Dietrich, Phys. Rev. E 62, 5324 (2000).
- [30] R. Evans and J. Stecki, Phys. Rev. B 49, 8842 (1994).
- [31] M. Krech, Phys. Rev. E 56, 1642 (1997).
- [32] Z. Borjan and P.J. Upton, Phys. Rev. Lett. 101, 125702 (2008).
- [33] O. Vasilyev, A. Gambassi, A. Maciołek and S. Dietrich, EPL 80, 60009 (2007).
- [34] O. Vasilyev, A. Gambassi, A. Maciołek and S. Dietrich, Phys. Rev. E 79, 041142 (2009); ibid 80, 039902(E) (2009).
- [35] M. Hasenbusch, Phys. Rev. B 82, 104425 (2010).
- [36] F. Parisen Toldin and S. Dietrich, J. Stat. Mech. P 11003 (2010).
- [37] F. Parisen Toldin and S. Dietrich, in Proceedings of the Ninth Conference on Quantum Field Theory Under the Influence of External Conditions (QFEXT09), edited by K. A. Milton Milton and M. Bordag (World Scientific, Singapore, 2010), p. 355.
- [38] J. Israelachvili, Intermolecular and Surface Forces, 2nd ed. (Academic, New York, 1992).
- [39] D. Dantchev, F. Schlesener and S. Dietrich, Phys. Rev. E 76, 011121 (2007).
- [40] Y. Jayalakshmi, J.S. Van Duijneveldt and D. Beysens, J. Chem. Phys. 100, 604 (1994).
- [41] D. Vogt, diploma thesis, University of Stuttgart (2009).
- [42] D. Qin, Y.N. Xia and G.M. Whitesides, Nature Protocols 5, 491 (2010).
- [43] R. Menard, Springer Handbook of Nanotechnology, Chapter 9: Stamping Techniques for Micro- and Nanofabrication (Springer, 2004).
- [44] A. Kumar, H.A. Biebuyck and G.M. Whitesides, Langmuir 10, 1498 (1994).
- [45] S.J. Rahi, M. Kardar and T. Emig, Phys. Rev. Lett. 105, 070404 (2010).
- [46] J.N. Munday, F. Capasso and V.A. Parsegian, Nature 457, 170 (2009).
- [47] A.W. Rodriguez, D. Woolf, A.P. McCauley, F. Capasso, J.D. Joannopoulos and S.G. Johnson, Phys. Rev. Lett. 105, 060401 (2010).
- [48] U. Nellen and C. Bechinger (unpublished).