Mid-infrared interferometry towards the massive young stellar object CRL 2136: inside the dust rim††thanks: Based on observations with the VLTI, proposal 381.C-0607
Abstract
Context. Establishing the importance of circumstellar disks and their properties is crucial to fully understand massive star formation.
Aims. We aim to spatially resolve the various components that make-up the accretion environment of a massive young stellar object ( AU), and reproduce the emission from near-infrared to millimeter wavelengths using radiative transfer codes.
Methods. We apply mid-infrared spectro-interferometry to the massive young stellar object CRL 2136. The observations were performed with the Very Large Telescope Interferometer and the MIDI instrument at a 42 m baseline probing angular scales of 50 milli-arcseconds. We model the observed visibilities in parallel with diffraction-limited images at both 24.5 m and in the N-band (with resolutions of 0.6″and 0.3″, respectively), as well as the spectral energy distribution.
Results. The arcsec-scale spatial information reveals the well-resolved emission from the dusty envelope. By simultaneously modelling the spatial and spectral data, we find that the bulk of the dust emission occurs at several dust sublimation radii (approximately 170 AU). This reproduces the high mid-infrared fluxes and at the same time the low visibilities observed in the MIDI data for wavelengths longward of 8.5 m. However, shortward of this wavelength the visibility data show a sharp up-turn indicative of compact emission. We discuss various potential sources of this emission. We exclude a dust disk being responsable for the observed spectral imprint on the visibilities. A cool supergiant star and an accretion disk are considered and both shown to be viable origins of the compact mid-infrared emission.
Conclusions. We propose that CRL 2136 is embedded in a dusty envelope, which truncates at several times the dust sublimation radius. A dust torus is manifest in the equatorial region. We find that the spectro-interferometric -band signal can be reproduced by either a gaseous disk or a bloated central star. If the disk extends to the stellar surface, it accretes at a rate of yr-1.
Key Words.:
Stars: formation – Stars: early type – ISM: jets and outflows – accretion disks – Techniques: interferometric1 Introduction
Mid-infrared stellar interferometry of young massive stars has the potential to bring significant new insights into the process of massive star formation. The technique overcomes the two age-old problems of low angular resolution and high extinction. In de Wit et al. (2007, 2010), we presented spectrally dispersed mid-infrared (mid-IR) interferometric observations of the massive young stellar object (MYSO) W33A using the Very Large Telescope Interferometer (VLTI). We found that the -band emission is dominated by warm dust on 100 AU scales, located in the walls of the outflow cavity. Recently, VLTI observations in the near-infrared (near-IR) using the AMBER instrument show unambiguously the presence of a disk-like structure on size scales of AU (Kraus et al. 2010).
In this letter, we focus on the MYSO CRL 2136. The dominant infrared source IRS 1 () is the driving force of an arcminute scale bipolar CO outflow with a P.A. of (Kastner et al. 1994). Weak, optically thick radio emission originating from IRS 1 was detected by Menten & Van der Tak (2004). Near-IR polarimetric observations demonstrate the presence of a polarization disk (Minchin et al. 1991; Murakawa et al. 2008). These credentials render CRL 2136 a promising target to probe for the geometry of the material on milli-arcsecond angular scales in the harsh environment close to the stellar surface. We perform VLTI observations in the -band, where MYSOs are bright and warm dust in the envelope and possibly in a circumstellar disk should still contribute significantly to the total flux.
2 Observations and data reduction
| Name | RA | Dec | D | Lum | date | Stations | B | P.A. | AM | Int. Calibrator |
| (h:m:s) | (::) | (Kpc) | () | (m) | (°) | |||||
| CRL 2136 | 18:22:26.3 | 13:30:12.0 | 2.0 | 23-06-08 | U2-U3 | 42.57 | 47.45 | 1.4 | HD 175775 |
The details of the target observations and VLTI configuration are presented in Table 1. The VLTI baseline P.A. is perpendicular to the outflow direction (). The angular resolution is about 50 milli-arcseconds or 100 AU for the adopted distance of 2 kpc. The observations were executed with the VLTI mid-IR 2-beam combiner MIDI in its High-Sens MIDI mode. It uses all the incoming light for the interferometric observation providing a measurement of the correlated flux. A prism with a spectral resolution of 30 was employed to disperse the incoming beams. A flux spectrum was taken immediately after the interferometric observation. We estimate there to be a 15% background variation between the observations as indicated by the observed flux levels of interferometric calibrator stars monitored throughout the night. The change in the transfer function (i.e. instrumental visibilities) was also estimated using these stars, which led to a small correction in the final calibrated visibilities. The calibrator was also used as an approximate flux calibration (Cohen et al. 1999). Detailed descriptions of the MIDI observational procedure are given in Przygodda et al. (2003), Leinert et al. (2004), and Chesneau et al. (2005). Data reduction was performed using the MIAEWS software package (version 1.6; see Jaffe 2004; Köhler 2005), in which interferograms are added coherently to maximize the signal-to-noise ratio.
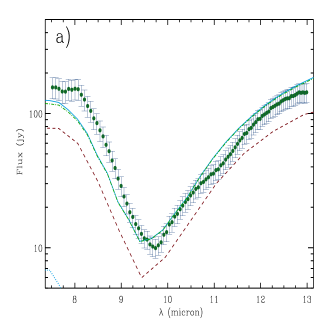
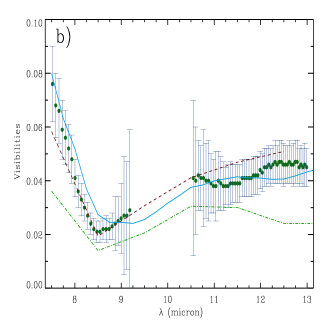
The measured MIDI fluxes and visibilities are presented in Fig. 1. Panel 1a shows the distinct silicate absorption of MYSOs. The flux error bars are estimates of the fluctuations of the chopped frames and the systematic 15% sky uncertainty added in quadrature. Panel 1b presents the calibrated visibilities. Correlated fluxes are compromised by telluric absorption at wavelengths shortwards of 7.5 m, longwards of 13.3 m, and between 9.3 and 10.2 m, as determined from the calibrator spectrum. These wavelength ranges are therefore omitted in Fig. 1b. The error bars associated with the visibility points take into account the uncertainties in both the flux and the correlated flux; the latter uncertainty includes the error introduced by detector noise. The visibilities are highest at the short wavelength end, then decrease to a minimum and gently rise again at longer wavelengths. A similar spectral behaviour is observed for the candidate MYSO IRS 9A in the NGC 3603 cluster (Vehoff et al. 2010) and found to be incompatible with a spherical dust distribution. When we interpret the visibilities as being caused by simple Gaussian-shaped emission regions, then CRL 2136 quickly increases in size from 30 mas (7.5 m) to 42 mas (8.5 m) and then more gradually to 57 mas (13 m). Although there is a minimum in the visibilities, the equivalent Gaussian sizes steadily increase because of the increasing wavelength.
3 Modelling and discussion
3.1 Excluded scenarios
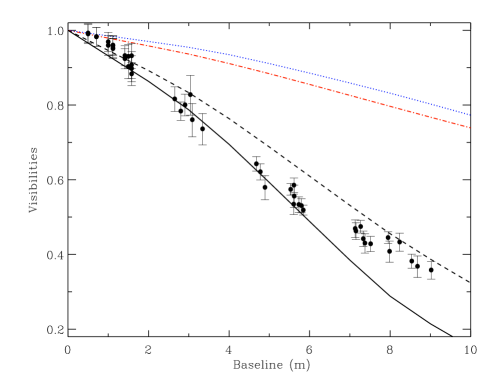
The MIDI visibility spectrum provides evidence of a steep drop in relative flux contribution with wavelength from a compact component. As an approximation of the MYSO envelope emission (e.g. de Wit et al. 2007), simple spherical models as are unable to reproduce this visibility trend. However, the use of these models is justified by a broad-band 10 m image produced by the Keck segment-tilting experiment (Monnier et al. 2009), it displays a nearly symmetric source for baselines m with a (Fig. 2). A spherical approximation produces the largest source sizes at maximum silicate opacity and dispersed visibilities are expected to display a minimum around 9.7m. Since this is not the case, we discard this scenario.
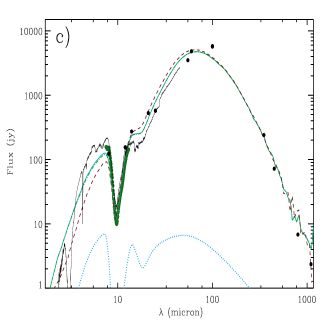
CRL 2136 has a near-IR polarization disk (Minchin et al. 1991; Murakawa et al. 2008), and the employed VLTI baseline is along this disk, perpendicular to the outflow direction. Our second modelling approach is to explore the suitability of dusty geometries which consist of a disk and an envelope with an outflow cavity. The observed SED is compared to the grid of pre-computed SEDs, which were produced by 2.5D dust radiative transfer (RT) models (Robitaille et al. 2007). Subsequently, we compute with the same RT code monochromatic images (for code details, see Whitney et al. 2003). This is a common and very efficient way of performing RT modelling (see e.g. Linz et al. 2009; Follert et al. 2010). We find that grid models that fit the SED for reasonable inclinations have a dusty disk (web-grid models #3005338 and #3012893); these SED fits are not presented here. The dust disk dominates the -band emission and produces pronounced mid-IR fluxes. Moreover, these disks are quite small, thus expected to have visibilities close to unity on short baselines (the blue dotted and red dash-dotted lines in Fig. 2), something that is clearly ruled out by the Keck data. To roughly reproduce the Keck data and SED simultaneously, an inner dust rim is required at about 5 to 7 times the formal dust sublimation radius (for K). Comparing the grid models to MIDI data, we again find that the visibilities produce a minimum at 9.7m, which is not observed. The reason for this disagreement is the constancy of the relative contributions to the total flux as a function of wavelength of the disk and envelope (within the MIDI interferometric field of view of ), except in the wings of the profile where the larger envelope dominates more because it is less affected by extinction.
| 111111Inclination with respect to the plane of the sky; | P.A.222222Position Angle defined as degrees East of North with respect to the outflow axis | ||||||||
| () | () | (K) | ( yr-1) | () | () | (AU) | (AU) | (AU) | |
| 20 | 25.0 | 20 000 | 70.0 | 170.9 | 23 | 100.0 |
3.2 Viable scenarios
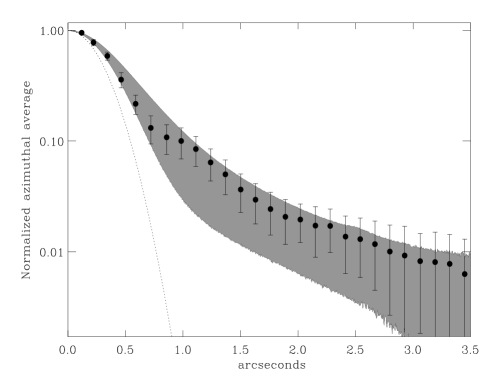
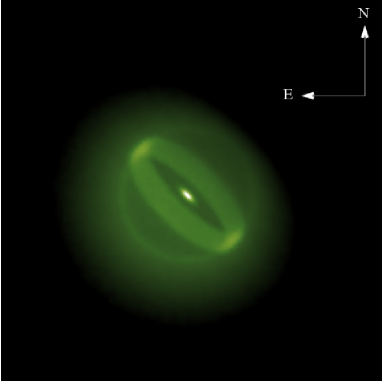
As a third approach, these considerations lead us to evaluate the significant contribution to the total -band flux, but located interior to the dust rim, of: (1) the star itself and (2) a gaseous disk. The best examples of these two types of model are presented alongside the observations in Fig. 1. First, we construct a dust envelope illuminated by a ZAMS star (but without disk component). As a starting point, we use the Murakawa et al. (2008) geometry, which has a parabolic cavity geometry and a cavity density that is roughly a thousand times lower than that of the envelope. High mid-IR fluxes are now achieved by extending the inner boundary of the envelope in the z-direction, rather than emission from the disk as previously. This gives rise to a torus-like dust structure (Fig. 4), a geometry previously suggested based on far-IR data by Harvey et al. (2000). The inner dust rim is constrained to be at a distance of AU from the star, required to fit the short baselines of the Keck observations (black full and dashed lines in Fig. 2). We ran a total of about 150 RT models and iterated to an optimal model envelope (see Table 2). We kept the same cavity opening angle as in the Murakawa et al. (2008) model. The “envelope-only” model is also presented in Fig. 1 by the green dash-dotted line. We note that the addition of a gaseous disk (see below) does not substantially alter the total model flux. The “envelope-only” model also reproduces the azimuthally averaged profile of a spatially resolved 24.5 m image, taken with the 8m SUBARU telescope (de Wit et al. 2009) (see Fig. 3).
With these envelope parameters at hand, we verified that, indeed, a (hot) ZAMS object as a central illuminating source is too faint at -band to have a significant effect on the visibilities. On the other hand, an equally luminous, cool star is bright enough in -band to have a significant contribution. The exchange of a hot for a cool star is motivated by work by Hosokawa & Omukai (2009) and Hosokawa et al. (2010). These authors illustrate that, during the main accretion phase, the central object undergoes a period of significant swelling () and has a relatively cool . A cool star with the luminosity of CRL 2136 (the red dashed line in Fig. 1) has an intrinsic flux of a few percent of the total -band flux. However, since an envelope illuminated by a cool star generates less flux at the short end of the mid-IR wavelength range, the fit to the SED is somewhat poorer, although the MIDI visibility spectrum is accurately reproduced.
Alternatively, adding to the envelope model an accretion disk interior to the dust rim is also a viable scenario (the blue full line in Fig. 1). We then approximate the fluxes and visibilities with an optically thick, geometrically thin, viscous disk (Bertout et al. 1988; Malbet et al. 2007), and apply the line-of-sight extinction by the envelope before the total model flux and visibilities are calculated. For a gas disk extending to the stellar surface, an of yr-1 is required. The inner edge of the disk has a temperature of approximately 15000 K. Clearly, the local temperature decreases if the inner edge is at larger radii, and attains 5000 K at 1 AU. The mass accretion rate needs to be a factor of two higher if the inner disk edge is at 1 AU. The temperatures are consistent with the derived distance of CO-bandhead emission in MYSOs (e.g. Wheelwright et al. 2010). The inferred accretion rate is also similar to that of other MYSOs, and it is an upper limit for W33A (de Wit et al. 2010).
4 Concluding remarks
We have analysed mid-IR interferometric observations of the massive young stellar object CRL 2136 obtained with the VLTI and MIDI. The dispersed visibilities show that there is a strong change in character of the emitting region at m. We have found that either a cool star or an accretion disk interior to a dusty envelope can explain the presented spatial and spectral observations. At present, neither scenario can be excluded based on the single MIDI baseline discussed in this paper, but clearly multi baselines will help to distinguish between them. We confidently conclude that the rim of the dust envelope is found at about 7 times the formal dust sublimation radius. The central dust-free zone may have been evacuated by the ionized stellar wind seen by Menten & van der Tak (2004), which occupies a similar volume. Our present work has illustrated the potential of MIDI to detect compact emission in massive YSOs, which is of particular interest given the large numbers of massive YSOs that can be studied in this way. Mid-IR interferometry can therefore provide a significant contribution to the characterisation of the accretion environment of massive young stellar objects.
Acknowledgements.
It is a pleasure to thank John D. Monnier for providing the Keck data and Andrea Isella for discussions on the topic. We would like to express our gratitude to the anonymous referee for her/his swift responses.References
- Bertout et al. (1988) Bertout, C., Basri, G., & Bouvier, J. 1988, ApJ, 330, 350
- Chesneau et al. (2005) Chesneau, O., Verhoelst, T., Lopez, B., et al. 2005, A&A, 435, 563
- Cohen et al. (1999) Cohen, M., Walker, R. G., Carter, B., et al. 1999, AJ, 117, 1864
- de Wit et al. (2009) de Wit, W. J., Hoare, M. G., Fujiyoshi, T., et al. 2009, A&A, 494, 157
- de Wit et al. (2010) de Wit, W. J., Hoare, M. G., Oudmaijer, R. D., & Lumsden, S. L. 2010, A&A, 515, A45
- de Wit et al. (2007) de Wit, W. J., Hoare, M. G., Oudmaijer, R. D., & Mottram, J. C. 2007, ApJ, 671, L169
- Follert et al. (2010) Follert, R., Linz, H., Stecklum, B., et al. 2010, A&A, 522, A17
- Harvey et al. (2000) Harvey, P. M., Butner, H. M., Colomé, C., Di Francesco, J., & Smith, B. J. 2000, ApJ, 534, 846
- Hosokawa & Omukai (2009) Hosokawa, T. & Omukai, K. 2009, ApJ, 691, 823
- Hosokawa et al. (2010) Hosokawa, T., Yorke, H. W., & Omukai, K. 2010, ApJ, 721, 478
- Jaffe (2004) Jaffe, W. J. 2004, in SPIE, Vol. 5491, SPIE, ed. W. A. Traub, 715
- Kastner et al. (1994) Kastner, J. H., Weintraub, D. A., Snell, R. L., et al. 1994, ApJ, 425, 695
- Koehler (2005) Koehler, R. 2005, Astronomische Nachrichten, 326, 563
- Kraus et al. (2010) Kraus, S., Hofmann, K., Menten, K. M., et al. 2010, Nature, 466, 339
- Leinert et al. (2004) Leinert, C., van Boekel, R., Waters, L. B. F. M., et al. 2004, A&A, 423, 537
- Linz et al. (2009) Linz, H., Henning, T., Feldt, M., et al. 2009, A&A, 505, 655
- Malbet et al. (2007) Malbet, F., Benisty, M., de Wit, W. J., et al. 2007, A&A, 464, 43
- Menten & van der Tak (2004) Menten, K. M. & van der Tak, F. F. S. 2004, A&A, 414, 289
- Minchin et al. (1991) Minchin, N. R., Hough, J. H., Burton, M. G., & Yamashita, T. 1991, MNRAS, 251, 522
- Monnier et al. (2009) Monnier, J. D., Tuthill, P. G., Ireland, M., et al. 2009, ApJ, 700, 491
- Murakawa et al. (2008) Murakawa, K., Preibisch, T., Kraus, S., & Weigelt, G. 2008, A&A, 490, 673
- Przygodda et al. (2003) Przygodda, F., Chesneau, O., Graser, U., Leinert, C., & Morel, S. 2003, Ap&SS, 286, 85
- Robitaille et al. (2007) Robitaille, T. P., Whitney, B. A., Indebetouw, R., & Wood, K. 2007, ApJS, 169, 328
- Vehoff et al. (2010) Vehoff, S., Hummel, C. A., Monnier, J. D., et al. 2010, A&A, 520, A78
- Wheelwright et al. (2010) Wheelwright, H. E., Oudmaijer, R. D., de Wit, W. J., et al. 2010, MNRAS, 1210
- Whitney et al. (2003) Whitney, B. A., Wood, K., Bjorkman, J. E., & Wolff, M. J. 2003, ApJ, 591, 1049