Radio and X-ray variability in the Seyfert galaxy NGC 4051
Abstract
We present intensive quasi-simultaneous X-ray and radio monitoring of the narrow line Seyfert 1 galaxy NGC 4051, over a 16 month period in 2000-2001. The X-ray observations were made with the Proportional Counter Array on the Rossi Timing X-ray Explorer (RXTE) and radio observations were made at 8.4 and 4.8 GHz with the Very Large Array (VLA). In the X-ray band NGC 4051 behaves very much like the analogue of a Galactic black hole binary (GBH) system in a ‘soft-state’. In such systems, there has so far been no firm evidence for an active, radio-emitting jet like those found in ‘hard state’ GBHs. VLBI observations of NGC 4051 show three well separated compact components almost in a line. This structure resembles the core and outer hot spots seen in powerful, jet-dominated, extragalactic radio sources and, although no jet is visible in NGC 4051, suggests that a weak jet may exist. However it has not previously been clear whether the nucleus is currently active in the radio band and whether there is any link between the radio and X-ray emission processes.
Radio monitoring of the core of NGC 4051 is complicated by the presence of surrounding extended emission and by the changing array configurations of the VLA. Only in the A configuration is the core reasonably resolved. We have carefully removed the differing contaminations of the core by extended emission in the various arrays. The resulting lightcurve shows no sign of large amplitude variability (i.e. factor 50%) over the 16 month period and is consistent with being constant. Within the 6 A configuration observations where we have greatest sensitivity we see marginal evidence for radio core variability of % (mJy at 8.4GHz) on a 2-week timescale, correlated with X-ray variations. These percentage variations are similar to those of the Seyfert galaxy NGC 5548, which is 10 times brighter. Even if the radio variations in NGC 4051 are real, the percentage variability is much less than in the X-ray band. Within the B configuration observations, although sensitivity is somewhat reduced, there is no sign of correlated X-ray/radio variability.
NGC 4051 is one decade lower in radio luminosity than the radio/X-ray/mass fundamental plane for jet-dominated hard-state black holes, although the scatter around the plane is of the same order. The lack of radio variability commonly seen in hard state GBHs may be explained by orientation effects. Another possibility, consistent with the lack of radio variability, is that the radio emission arises from the X-ray corona although, in that case, the linear structure of the compact radio components is hard to explain. A combination of corona and jet may explain the observations.
keywords:
galaxies: active – galaxies: Seyfert – X rays: galaxies – radio: galaxies1 Introduction
Galactic black hole X-ray binary systems (BHBs) are often classified as being in one of a small number of ‘states’. The most common states are the ‘hard’ and the ‘soft’ states. The hard state was originally defined as the state where the 2-10 keV X-ray flux is low and the X-ray spectrum is hard, and the ‘soft’ state, where the 2-10 keV X-ray flux is high and the X-ray spectrum is soft (McClintock & Remillard 2006). The hard state is dominated by a power-law component, and the ‘soft’ state is characterized by a strong thermal blackbody component. The main physical parameter driving the states is the accretion rate with that rate being higher in the soft than in the hard state (Fender et al. 2004; Fender 2010; Belloni 2010). Another major observational distinction between the hard and the soft states is that compact, powerful radio-emitting jets are usually present in the hard states (Fender 2001; Stirling et al. 2001) but have not yet been detected in the soft state. There have been detections of weak radio emission in soft state systems (Brocksopp et al. 2002; Corbel et al. 2004) but this emission is usually thought to represent emission from relic plasma left over from a previous hard-state jet and that no active jet is currently being powered by the black hole (Fender et al. 2009).
NGC 4051 is a relatively nearby (15.21 Mpc, Russell 2002) narrow line Seyfert 1 (NLS1) galaxy. It is one of the brightest and most variable Active Galactic Nuclei (AGN) in the X-ray sky and has been extensively observed by a number of X-ray observatories (McHardy et al. 2004; Ponti et al. 2006; Terashima et al. 2008; Breedt et al. 2010). One of the major results to emerge from these studies is that the X-ray variability characteristics of NGC 4051, as parameterised by the power spectral density (PSD), are very similar to those of the Galactic black hole X-ray binary (GBH) system Cyg X-1 when in the ‘soft’ state (McHardy et al. 2004). A classification of NGC 4051 as a soft state system is supported by the relatively high accretion rate ( ) (Woo & Urry 2002). If it were identical to a soft state GBH then an active radio-emitting jet would not be expected. Although the X-ray observations of other Seyfert galaxies are less extensive, the data are consistent with Seyfert galaxies being soft state systems (e.g. also see McHardy et al. (2005)).
Radio variability has been detected previously in Seyfert galaxies but observations are not extensive. Neff & de Bruyn (1983) detect variability of % in the Seyfert 2 galaxy Mkn 348 at 5GHz on yearly timescales and Wrobel (2000) found variability at 8.4GHz in the Seyfert 1 NGC 5548 of 33% 5% over 41 days and 52% 5% over 4 years. Mundell et al. (2009) finds similar variations in most members of a sample of mainly Seyfert 2 galaxies and Falcke et al. (2001) find the same in most members of samples of radio-quiet and radio-intermediate quasars. However in none of the above cases were there any quasi-simultaneous X-ray observations. Recently Bell et al. (2010) have studied the X-ray and radio variability of the liner NGC 7213 and find a weakly significant correlation between those bands. Liners have much lower accretion rates than Seyfert galaxies, being similar in accretion rate to the hard state GBHs. Liners are also much more radio loud than Seyfert galaxies, which is in agreement with the hard state scenario, and so an X-ray/radio correlation is expected. In soft-state GBHs, as the radio emission has been scarcely detected, we do not know what the exact relationship to the X-ray emission might be. Correlated radio and X-ray observations of Seyfert galaxies may therefore provide us with important hints on the radio properties of the soft state systems
The soft state Seyfert galaxy NGC 4051 has been known for some time to host a weak nuclear radio source of unknown origin (e.g. Ulvestad & Wilson 1984; Kukula et al. 1995; Christopoulou et al. 1997). Based on the disappearance of the HeII 4686 line from the rms spectrum at low X-ray flux levels, Peterson et al. (2000) suggested that the inner part of accretion disc may change from being optically thick to being advective at low accretion rates, leading to the expectation of increased radio emission (e.g. Di Matteo et al. 1999). Therefore, over a period of 16 months in 2000 and 2001, we carried out a joint radio (with the Very Large Array, VLA) and X-ray (with the Rossi X-ray Timing Explorer, RXTE) monitoring programme to search for an expected anti-correlation between the radio and X-ray fluxes.
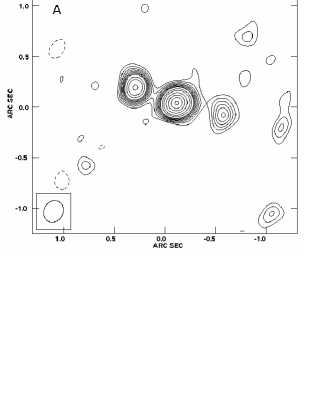
Preliminary analysis of the resultant data did not, however, reveal a strong radio/X-ray anticorrelation. Instead the datasets appeared to be positively correlated (McHardy 2005). Correlated radio/X-ray variability is commonly seen in hard state, jet-dominated, GBHs, suggesting that the radio emission in NGC 4051 may also come from a jet. We therefore undertook radio Very Long Baseline Interferometry (VLBI) observations both with the European VLBI Network (EVN) in 2003 and the Global VLBI network in 2004. A triple structure consisting of a compact core with a barely resolved ( few milliarcsec) component on each side of the core, separated by arcsec and almost in a straight line, was detected (McHardy 2005). This structure is similar to the core and hot spots of an FRII radio source and strongly suggests an underlying jet with the hot spots being the places where the jet hits some surrounding medium. Similar EVN observations were later performed by Giroletti & Panessa (2009), revealing a broadly similar structure. A definitive analysis of the X-ray and radio variability of the nucleus of NGC 4051 was, however, hindered by the fact that the VLA array configuration changed approximately every 4 months and thus the size of the synthesised beam changed, encompassing greater or lesser amounts of surrounding extended emission (see Fig 1). In this paper we carefully model the radio emission of NGC 4051 on different spatial scales in order to remove the contribution from extended emission to the flux from the nucleus, which we then compare to the X-ray flux.
In Section 2 we present the radio observations and radio analysis. In Section 3 we consider the radio variability as observed with the A and B array configurations, in which sensitivity to core radio flux variations is greatest, and compare it with quasi-simultaneous X-ray observations. We find, at best, only a marginal relationship. In Section 4 we discuss how to remove the contribution from extended radio emission in the B, C and D array configurations. We find that, although the X-ray emission varies by factors of 10 or more over the 16 month observation period, there is no believable long term variation of the radio emission over the same period. In Section 5 we show simulations designed to determine the accuracy with which the extended contribution can be measured. In Section 6 we consider the implications of our result for radio emission models for radio quiet AGN. We include discussion of jet models which underly the so-called ‘fundamental plane’ relating black hole mass to radio and X-ray luminosity (Falcke et al. 2004; Merloni et al. 2003) and we also discuss coronal models (Laor & Behar 2008).

2 Radio Observations and data reduction
NGC 4051 was observed by the VLA 29 times between 2000 16th June and 2001 3rd September with a typical interval between observations of 2 weeks. On each occasion the source was observed at both 8.4 and 4.8 GHz with a total time on source, in each band, of approximately 12 minutes. Six of our observations were made with the VLA in A configuration, 2 in BnA, 6 in B, 1 in BnC, 6 in C, 3 in DnC and 5 in D. We observed in 2IF mode with 50MHz bandwidth at both frequencies. The phase calibrator was J1219+484 and the flux calibrator was 3C286. For more information on these observations see Table 1.
The data were flagged and calibrated, using aips, in the standard manner. Maps were made using imagr with clean fields set around two fainter neighbouring sources, one approximately 5.5 arcmin to the NE and another approximately 3.5 arcmin to the south. After experimenting with different iterations of cleaning we standardised on 10,000 iterations. Self calibration was not used on the final images. All early experimentation with self calibration revealed the source to be too faint, and resulting images were not improved by this method.
Our aim here is to search for a possible relationship between the X-ray and radio fluxes. The X-rays vary very rapidly, and hence come from a very small region, tens or hundreds of light seconds across. If there is any relationship with the radio emission, we must therefore expect the radio emission to come from a region which, although possibly not as small as that of the X-ray emission region, is unlikely to be light years across. At the distance of NGC 4051 (Mpc), 1 arcsecpc and hence we are concerned here with the core radio flux. However measurement of that flux accurately for a source with any extended structure is far from trivial and, even for an almost unresolved source, it is not easy, as we discuss further in Section 3.1.
The standard aips task for measuring the peak and integral flux densities is jmfit. This task fits a gaussian model to the values within a box drawn around the source and outputs the integral flux density (Jy) values and peak flux density (Jy/beam) values. Although we are interested in intrinsic core flux, measurements of both peak and intergral flux densities have value for our study and so both are recorded and listed later.
A box was placed around the nuclear core of NGC 4051 in each map using the task cowindow. The box size was different for each array configuration and was chosen so it included all the nuclear flux. We kept the box size constant when calculating flux density values within the same array. jmfit outputs errors depending on the gaussian fitting to the nucleus of the source. These jmfit errors are then combined in quadrature with the standard 5% error on the flux density value to calculate the error on each of the 29 flux readings.
| Date | Configuration | Time on Source |
|---|---|---|
| JD-2450000 | s | |
| 1701.583 | C | 1130 |
| 1722.514 | DnC | 1170 |
| 1734.542 | DnC | 1130 |
| 1741.505 | DnC | 1090 |
| 1750.467 | D | 1210 |
| 1756.535 | D | 1210 |
| 1771.465 | D | 1100 |
| 1803.335 | D | 1140 |
| 1817.342 | D | 770 |
| 1852.222 | A | 1150 |
| 1865.185 | A | 1160 |
| 1879.148 | A | 1140 |
| 1893.131 | A | 1080 |
| 1909.066 | A | 1090 |
| 1929.926 | A | 1140 |
| 1941.001 | BnA | 1000 |
| 1956.956 | BnA | 1070 |
| 1985.710 | B | 1130 |
| 2005.781 | B | 1120 |
| 2023.773 | B | 1120 |
| 2034.660 | B | 1150 |
| 2046.649 | B | 1120 |
| 2060.660 | B | 1210 |
| 2078.464 | BnC | 1250 |
| 2091.505 | C | 1140 |
| 2101.560 | C | 1120 |
| 2114.444 | C | 770 |
| 2132.351 | C | 1130 |
| 2156.272 | C | 1230 |
3 Variability of the nucleus
3.1 During period of A configuration observations
3.1.1 8.4GHz Observations
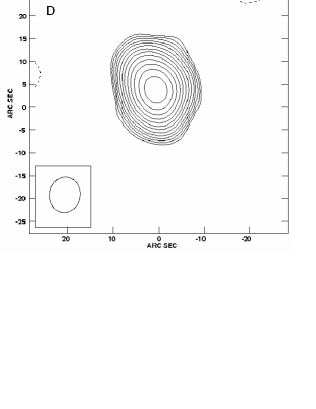
In Fig 1 we present images of NGC 4051 at 8.4GHz from representative individual observations made in each of the four VLA array configurations. We can see that, with the A configuration, the core is separated from the neighbouring eastern and western components. Higher resolution maps made from observations by MERLIN (e.g. Christopoulou et al. 1997)) or the EVN (Giroletti & Panessa 2009; McHardy 2005) show the same structure. Thus the flux of the central component, as seen in the A configuration observations, can be taken as reasonably representative of the nuclear flux. In all other array configurations measurements of the nuclear flux are contaminated by extended emission, which restricts the conclusions which can be drawn from these data. We consider the problem of contamination in more detail in Sections 3.2 and 3.3 but here consider the specific concerns related to the A configuration observations.
The integral flux density is the desired measurement for slightly extended, but otherwise isolated sources, such as one might find in deep surveys. However the peak flux is generally the best measure of the true core flux. If the source is compact and isolated but there are significant phase errors in the calibration which move some of the flux slightly to the side, then the integral flux density would be a better measure. (For a very brief discussion of how one might measure core fluxes see, for example, Mullin et al. 2008 and papers referred to therein.) However if the core is surrounded by extended emission then the integral flux density will be much more affected by small changes in beamshape which may include different amounts of extended emission. Our A configuration maps, although showing a core which is close to being unresolved (eg Fig 1) consistently indicate an extension, of approximately 0.1 arcsec, along the line of the 3 main source components and so the problem of extended emission exists even for the A configuration observations.
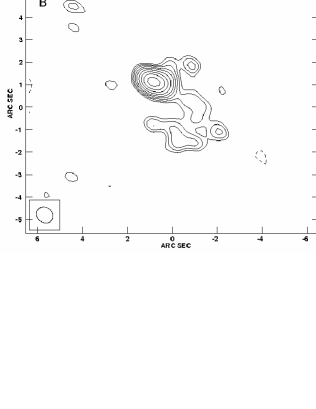
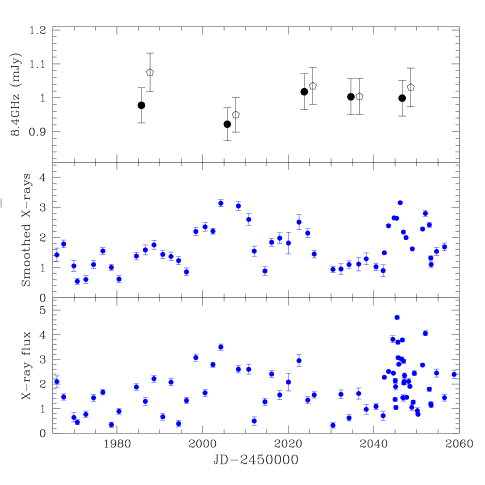
In the top panel of Fig 2 we show the 8.4GHz peak core flux densities with fixed beam (filled circles) and default beams (open hexagons) as derived using jmfit. For the non fixed beam maps the restoring beams were left free, to be determined only by the UV coverage and the use of robust 0 in imagr. The size of the fitted gaussian component was also left free. As the observations were made within a relatively short period, at mostly the same hour angles, the restoring beams, in practice, were very similar, although not identical. The fitted gaussians were similar, although there was some scatter in width.
In order to try and standardise further, we remade all the maps with a fixed restoring beam with parameters at the mean of the unconstrained restoring beam (i.e. for A configuration beamsize 0.24” 0.19” and position angle of 137 degrees) and robustness 0.
The first point to note from Fig 2 is that any variation of the core 8.4GHz flux, if real, is very small, and certainly of much lower amplitude than that seen in the X-ray observations (lower panels of Fig 2). The quoted errors are the statistical error given by jmfit combined in quadrature with the 5% error usually assumed as the maximum likely uncertainty on the flux density calibration. The calibration uncertainty therefore slightly dominates the total resultant error which is typically twice the statistical error, or slightly more. This total error is the correct error to use when comparing the flux density from the same object in different observations. To determine the relative flux densities of different objects within the same observation, however, one would not include the flux calibration uncertainty.
We also note that minor calibration errors, or sidelobes from distant sources which have not been perfectly removed, can typically lead to flux measurement errors which are larger by factors of two, or maybe more, than the statistical error. We can use observations of other structures in the maps to make a crude estimate of the real errors on the flux density of the central source. In our case components are visible on either side of the core in the A configuration maps which we might assume to be constant if they arise from extended components related to NGC 4051. The (brighter) eastern component is definitely more extended than the core, and the (fainter) western component is probably the peak of a low surface brightness extended structure which extends to the south and so flux measurements of both will be a little more sensitive to the exact beamshape than will measurements of the core. Nonetheless, the default beamshape does not change greatly but variations in peak flux by twice the statistical error, and occasionally by more, are seen between observations. We conclude that the error which we use throughout this paper, i.e. the statistical error from jmfit combined in quadrature with a 5 percent amplitude calibration error , may be a slight underestimate of the true total error but probably not by more than 30 percent.

We have also examined 8.4GHz A configuration observations made by other observers. From an observation on 1991 June 24, Kukula et al. (1995) list the core peak flux as 0.54 mJy and the integral flux as 0.60 mJy from a map with rms noise level of 73 Jy/beam. In an observation on 1991 September 01, which we analysed ourselves, we find a peak flux of 0.50 mJy with rms noise of 40 Jy/beam (we do not quote the integral flux density as the beam is more distorted than that of any other A configuration maps which we consider here). These measurements are very similar to those which we have measured in our own later observations.
We conclude that although we formally measure variations of per cent on a timescale of 2 weeks between the first two observations in the maps made with fixed restoring beam, the variation is barely more than 0.1 mJy and, given the possible 30% larger error, the observations could be consistent with a constant source.
3.1.2 8.4GHz to 4.8GHz spectral variations
| Radio | Peak Flux Density | Peak Flux Density |
|---|---|---|
| Date | at 8.4 GHz | at 4.8 GHz |
| JD-2450000 | Jy | Jy |
| 1852.222 | 4.79 0.30 | 5.91 0.36 |
| 1865.185 | 5.97 0.36 | 6.36 0.37 |
| 1879.148 | 5.93 0.35 | 6.59 0.38 |
| 1893.131 | 5.36 0.34 | 6.41 0.39 |
| 1909.066 | 6.01 0.35 | 7.39 0.43 |
| 1929.926 | 4.97 0.31 | 5.98 0.36 |
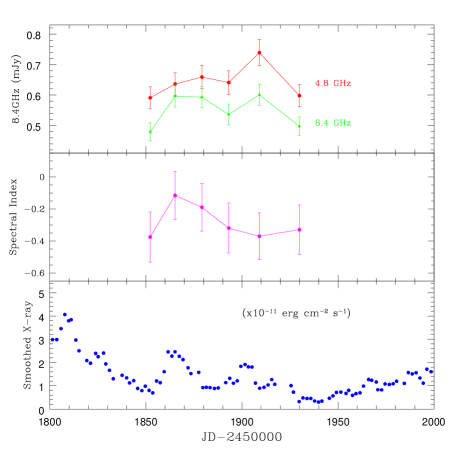
We carried out the same map making procedure on the 4.8GHz A configuration observations. In these cases we fixed the beam size at 0.385 0.328 arcsec with position angle -15 degrees, i.e. quite similar to the PA of the 8.4GHz observations. The resulting peak flux densities are listed in Table 2 and plotted in Fig 3. A broadly similar pattern of variations to that seen at 8.4GHz is found and the amplitudes of variability are similar to those seen in NGC 5548 by Wrobel (2000).
In Fig 3 we also show the 8.4-4.8 GHz two-point spectral index, , where . Given the difficulty of measuring core fluxes we do not over-interpret these results, however we do note that all the maps from which the fluxes were derived were constructed in an identical way. With that proviso we note that these observations reveal an average , similar to that found by Christopoulou et al. (1997), with a slight hardening at the beginning of the observations followed by a gradual softening such as might be explained by an injection of electrons with a relatively flat energy distribution, e.g. perhaps as a result of a shock, followed by radiative energy losses.
As this paper is concerned mainly with the radio variability and as the problems of contamination of nuclear flux by extended emission are even greater at 4.8 GHz than at 8.4 GHz, we do not consider the 4.8GHz from configurations other than A configuration in this paper. However in the A configuration the nucleus is still reasonably resolved at 4.8 GHz and so we do present those data here. A full discussion of the spectral morphology of NGC 4051 will be presented in a later paper.
3.1.3 Radio/X-ray Correlation
In Fig. 2 we also show (bottom panel) the 2-10 keV X-ray fluxes derived from our monitoring programme with the Rossi X-ray Timing Explorer (RXTE) using the Proportional Counter Array (PCA). During the period of the A configuration the RXTE observations typically occurred every 2 days, with a duration of 1ksec. Description of the X-ray reduction techniques can be found in other papers (e.g McHardy et al. 2004). It is well known that NGC 4051 varies very rapidly, and that rapid variability can be seen in Fig. 2. Although there are slow long term trends in the average flux of the source, observations with higher time resolution by XMM-Newton (e.g McHardy et al. 2004) reveal that variations by a factor of 2 occur not uncommonly on timescales of an hour. It is therefore relevant to consider how close in time the X-ray and radio observations should be in order to be useful for any study of correlated variability.
The answer depends on what we think the physical mechanisms responsible for the X-ray and radio emission are. For example, in blazars where the variable emission in both the X-ray and lower frequency bands is believed to come from shocks in a relativistic jet oriented towards the observer, time separations of a few hours or less are required (e.g. McHardy et al. 2007). Although the VLBI radio morphology of three compact co-linear components is most easily explained by the presence of an unseen jet, the radio/X-ray ratio is much lower than in typical blazars and a similar relativistic jet-like origin for both emissions is unlikely. The currently most favoured, and energetically simplest, paradigm for the X-ray emission is Comptonisation of optical-UV disc photons by very hot thermal (K) or non-thermal electrons in a corona above the accretion disc (e.g. Shapiro et al. 1976). One possibility for the radio emission is that it is synchrotron emission from that same corona, although the size of the radio emitting region at the frequencies considered here would be typically 100 times larger than that of the X-ray emitting region (see Laor & Behar 2008, for an extensive discussion of this model). In that case we would not expect to detect radio variability on the rapid timescales seen in the X-ray band and it would be more appropriate to look for correlations between the radio emission and a longer-term averaged X-ray emission which may represent longer term accretion rate fuelling of the overall emission regions.
In order to avoid pre-judging the issue, we have therefore investigated the relationship between both the smoothed, and unsmoothed, X-ray fluxes. (The X-ray lightcurve is only gently smoothed with a running gaussian function of half-width 2 days.) The smoothed X-ray lightcurve is shown in the second panel from the bottom in Fig. 2.
In case the time difference between the radio and X-ray observations is important, we list the radio observation dates and the nearest RXTE observation dates in Table 3. We list both the directly observed, i.e. unsmoothed X-ray fluxes and the fluxes interpolated to the time of the radio observations. We note that the greatest separation is 0.59d but that three of the separations are within 3 hours. We note that, in fact, there is not a great deal of difference between the nearest observed and interpolated X-ray fluxes.
In Fig. 4 we plot the 8.4GHz radio flux from the maps made with the same restoring beam against both the interpolated unsmoothed and interpolated smoothed X-ray fluxes. There is a weak correlation between the radio and X-ray fluxes although we repeat our caution that, with a slightly larger error, the radio fluxes could be consistent with being constant. Smoothing the X-ray flux does not improve the appearance of the relationship. In Figs. 5 and 6 we plot the same relationship for the peak, and integral, 8.4GHz flux densities derived from the maps made with the default restoring beams. The same general patterns are observed. We are able to measure simple powerlaw X-ray spectral indices for each of the RXTE observations and, in Fig. 7 we plot the interpolated photon number indices, from both smoothed and unsmoothed lightcurves as before, against radio flux density for the 8.4GHz maps made with the same restoring beam. Again a similar pattern is seen although we caution that there is usually a good relationship between X-ray flux and spectral index for Seyfert galaxies such as NGC 4051 (Lamer et al. 2003) so these plots are not completely independent of the previous flux-flux plots.
Hardening of radio spectral with increasing flux followed by softening with decreasing flux can be simply explained in the context of jet models by the injection of particles with a hard spectrum followed by subsequent radiative losses, and so might explain our observations of radio variability. However if the X-ray emission also arose predominantly in the jet we would expect a similar spectral behaviour, which is not what we see here. We refrain from speculating too much given the quality of the data but the correlated variability seen here, if real, may simply reflect changes in fuelling rate to both emission regions.
| Radio | Interpolated | X-ray | Observed |
|---|---|---|---|
| Date | X-ray flux | Date | X-ray flux |
| 1852.222 | 1.10 0.13 | 1851.631 | 1.37 0.13 |
| 1853.551 | 0.51 0.11 | ||
| 1865.185 | 1.84 0.14 | 1865.178 | 1.84 0.14 |
| 1879.148 | 1.61 0.11 | 1879.632 | 1.83 0.13 |
| 1893.131 | 1.23 0.10 | 1893.637 | 1.41 0.13 |
| 1909.066 | 1.14 0.15 | 1909.184 | 1.14 0.19 |
| 1929.926 | 0.35 0.17 | 1929.794 | 0.35 0.17 |


3.2 During period of B configuration observations
3.2.1 8.4GHz observations
We see, from Fig. 1, that in the B configuration observations the core is not resolved from the two close components on either side. Measurement of the core flux therefore becomes more difficult and flux density measurement errors will be larger than for the A configuration observations. Nonetheless it is still possible to measure the peak, and integrated, flux densities.
In Fig 8 we show the lightcurves during the period of the B configuration observations. Here the radio flux densities used are both the peak core flux densities measured from maps made with the default beamshape and those with a fixed beam . As with the A configuration observations, the values derived from maps made with the same/fixed restoring beam (i.e. 0.76 0.64 arcsec and position angle of -25.13 degrees) are quite similar to those made with the default beam. The X-ray observations are as described for the A configuration observations. We again see, at most, only marginal radio variability with the 8.4 GHz flux density consistent with being constant.
3.2.2 Radio/X-ray correlation
The relationship between the radio and X-ray fluxes in the B configuration is shown in Fig. 9, again displaying both the smoothed and unsmoothed X-ray fluxes. The hint of a positive X-ray/radio correlation seen in the A configuration observations is not seen here. With the possible exception of the highest X-ray flux point, there is no sign of any variation of the radio flux despite considerable variation in the X-ray flux. Unfortunately that highest X-ray flux point is derived from the largest extrapolation of fluxes as the RXTE observation closest to that time had zero useful exposure. Thus we have had to extrapolate between two observations which were 4d apart.

3.3 All configurations
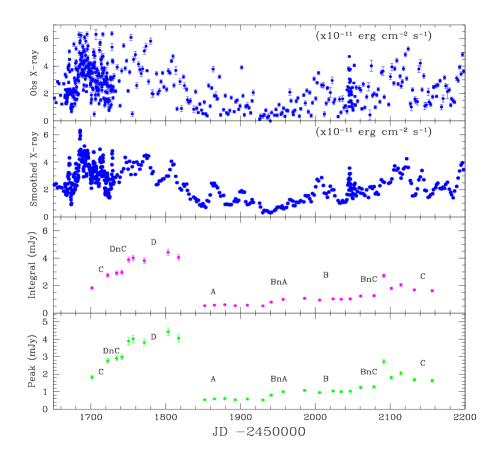
Although the errors increase, it is possible to measure peak and integrated flux densities also for the C and D array configurations. In Fig 10 we plot the resultant 8.4 GHz fluxes densities for all configurations together with the observed, and slightly smoothed, X-ray fluxes. Within the individual array configurations there is no evidence of strong variability although, over months timescales, it appears visually as if there is a strong correlation between the radio and X-ray fluxes.
Unfortunately, by chance, the period of the lowest X-ray flux occurs during the A configuration observations and the period of largest X-ray flux occurs during the D configuration observations. However note that here we are plotting the observed radio flux densities and have not yet removed contributions to the core flux density from extended emission. As the nuclear radio flux will be most contaminated by extended emission during the D configuration observations, it is probable that at least part of the apparent correlation between the radio and X-ray fluxes is actually a consequence of the changing array configuration. In order to properly compare the radio and X-ray variability we must therefore remove the extended radio flux, as we describe below.
4 Comparing radio fluxes between arrays
The procedure for removing the contribution to the core flux density from extended emission is carried out in stages, offsetting by one array configuration change at a time. For example, in offsetting from B configuration to A configuration we first determine, from real observations with B configuration, what the typical beam shape and size is in B configuration. We then take the A configuration observations and taper the uv datasets, using uvrange within imagr, so that the beam sizes are the same as they would be in B configuration. We refer to the resulting map as a pseudo B configuration map. We then measure both the peak and integral flux densities in the pseudo B array map and determine the differences, or offsets, between values measured from the original, untapered, A configuration map. We repeat the process for all of the A configuration datasets and determine the average offsets to the B configuration, and an rms error thereon, for the peak and integral flux densities.
To offset the real observed B configuration observations to an A configuration observation we remove the offset derived above from each of the observed B configuration flux densities and we combine the rms error on the offset with the observational error on the B configuration flux densities in quadrature.
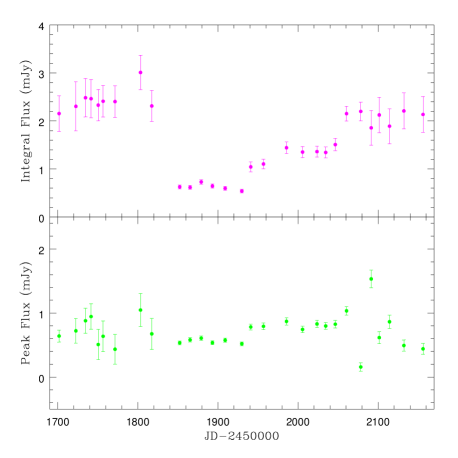
We perform this offset method on the other configurations to get average offset values for D to C, and C to B. Combining these offsets with the offset from B to A allows us to offset all data to an A array configuration. For example, the average peak flux density offset in going from A to B configuration is 0.32mJy and in going from C to D configuration it is 2.31mJy. In offsetting over more than one array configuration change we combine the offsets linearly and the errors in quadrature. Thus these average offset values were used to offset all flux density values to those of an equivalent A configuration observation. The resultant offset peak and integral flux density lightcurves are shown in Fig. 11. In the intermediate configurations such as BnC there are few epochs of observation, and the configuration is slightly different in all of them. It is therefore very difficult to estimate the offset. These observations give rise to the more deviant peak flux densities. However even including these points the peak flux densities are consistent with being constant as long as we assume the more realistic larger error. For the integral flux densities, although the variations are now considerably reducted, there is still some residual variability, which still follows the X-ray variability. However we note that the changes still mainly follow the changing array configurations. Within all configurations apart from the A configuration, there is no evidence for variability so one must suspect an error in the offsetting procedure for integral flux densities. In the next section we simulate the offsetting method for integral flux densities to determine its accuracy.
5 Simulating the Offset Method
The first step in simulating the offset method was to make a model of the source. Although it is preferable that the model resembles the real source, it is not essential that it is identical to the real source as the aim of the simulations is only to test the offsetting method and could, in principle, be carried out on any extended source.

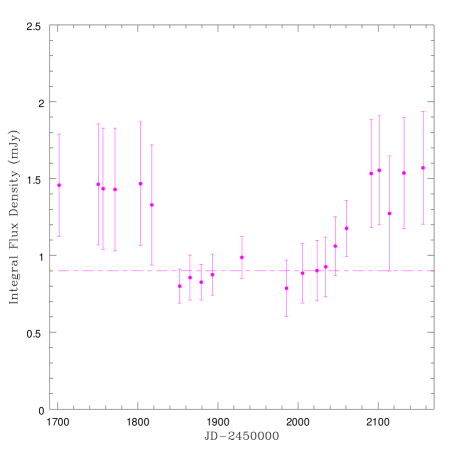
To make the model we combined all the uv data sets from the A, B, C & D configurations into one uv data set which we imaged (Fig. 12). The 28 clean components from this combined image which best represented the structure of the AGN were then selected. Using uvsub we added the model contribution from these components to the residual uv data sets produced by imagr during our original imaging of the 22 observations in each of the 4 main array configurations. The resultant data sets represent how our actual observational setups would have seen our model of NGC 4051. We then repeated the offsetting procedure, which we described above for the real data, on the simulated data, to produce a simulated integrated flux density offset to the A configuration. This procedure should result in a constant flux density level equal to the model A configuration values. The actual simulated offset lightcurve is shown in Fig. 13. The dotted horizontal line in Fig. 13 represents the expected A array integral flux density value. We see that the B configuration data are at the same level as the A configuration data but the C and D configuration data are too high by about 0.5-0.6 mJy which therefore represents an approximate systematic error in our process of offsetting the integral C and D configuration flux densities. If this systematic error is subtracted from the original offset integral flux densities (Fig. 11), then most of the apparent long term variation is removed from the integral flux densities. It is unfortunate that the array configuration changes follow the approximate changes in long term X-ray flux, and hence that the very small residual variation in the integral flux densities appears to follow the X-ray flux. However given the particular difficulties of measuring the integral flux densities, the fact that the changes closely follow the array changes and the fact that long term variability is not seen in the peak flux densities, we conclude that the apparent small residual long term variability in the integral flux densities does not represent real variation of the core flux.
6 Discussion
6.1 Radio Variability
We have monitored the radio and X-ray variability of the probable soft state Seyfert galaxy NGC 4051 over a period of 16 months in 2000 and 2001 with observations approximately every 2 weeks. We have carefully subtracted the contributions to the core flux density from the differing amounts of extended flux density which will be detected in the different restoring beams in the different VLA configurations. Thus we have produced lightcurves equal to those which would have been produced by observations all with the A array. Over that period the core peak flux density which in this context is the best measurement of true core radio luminosity, is consistent with being constant. Also, the average peak radio flux density during our observations is, within the errors, the same as during two previous observations in June and September of 1991.
Within the A configuration, which is the only configuration within which the core is resolved from close neighbouring components to the east and west, there is a hint of correlated X-ray and radio variability, with radio (and X-ray) spectral variations approximately following the flux variations. However although the X-ray flux varies by factors of a few, the maximum radio variations are, at most, 25 percent between observations separated by weeks. However the amplitude of variability is, at most, 0.12mJy. Whilst the percentage changes, timescales of change, and spectral hardening during a rise are entirely consistent with the observations of radio variability of another similar Seyfert galaxy, NGC 5548 (Wrobel 2000). NGC 5548 is approximately ten times brighter than NGC 4051 and so there is no doubt about the credibility of its radio variability. Unfortunately for NGC 4051 the credibility of the variability depends strongly on the error associated with each measurement. Taking the larger of the errors which could be associated with the radio measurements (discussed earlier) the radio lightcurve would be consistent with being constant. Thus overall we conclude that there is no strong evidence for any large amplitude variability in the core radio flux of NGC 4051 at 8.4GHz over the course of a year but we cannot absolutely rule out very low amplitude (mJy) variability correlated with the X-ray variability.


6.2 Implications for emission models
In Fig. 14 we plot our values of the radio luminosity and the average X-ray luminosity on the so-called ‘fundamental plane’ of black hole accretion activity (Merloni et al. 2003; Falcke et al. 2004). Here we plot a version of the plane using only ‘hard state’ black holes from the sample of Körding et al. (2006). We note that NGC 4051, which is almost certainly a ‘soft state’ object, lies about a decade below (in the sense of being more radio quiet) the best-fit relationship defined by the hard state objects, although it is just about within the scatter of the relationship. However hard state objects typically show much more radio variability than NGC 4051 and are typically described by where for variations in individual objects (Corbel et al. 2003; Gallo et al. 2003, 2006). For NGC 4051 , or possibly during the A configuration observations.
Bell et al. (2010) find a significant correlation between X-ray and radio emission in the LINER NGC 7213 with factors of or more variability in both bands. Given its very low accretion rate, NGC 7213 is thought to be a hard state system so correlated radio/X-ray variability is expected. However although Wrobel (2000) has demonstrated radio variability in the Seyfert galaxy NGC 5548, which has an accretion rate not far below that of NGC 4051 and so is probably also a soft state system, there have been no previous studies of correlated X-ray/radio variability in similar Seyfert galaxies. The X-ray/radio relationship has, however, been investigated for samples of objects. Panessa et al. (2007) find at 4.8GHz and at 15GHz for a sample of Seyfert galaxies. For a sample of ROSAT-selected AGN, and using 1.4GHz radio observations, Brinkmann et al. (2000) find for radio quiet objects, similar to Seyferts, (and for radio loud objects). Thus although there is a wide range in the reported values of , there is good evidence for radio/X-ray correlation within samples of Seyferts and radio quiet AGN. However within the only well studied ’soft state’ Seyfert so far, i.e. NGC 4051, there is no evidence for a value of much above 0.1.
One possibility is that even in the VLA A configuration 8.4GHz maps, the core still contains substantial contribution from emission which is extended but on scales below that detectable with the VLA. We note that with a beam of mas, Giroletti & Panessa (2009) find an unresolved source with 5GHz flux density of mJy, which is substantially less than our average 4.8GHz measurement of mJy. Our tentative observations of mJy variability would then provide a value of consistent with the values derived from observations of samples of similar sources, although NGC 4051 would then be even more radio quiet compared to the hard state objects which define the fundamental plane.
The VLBI observations show structure which is strongly indicative of a collimated jet (Giroletti & Panessa 2009; McHardy 2005). (In a future paper we will present our higher resolution global VLBI observations which confirm this structure.) Thus as first sight the lack of radio variability is surprising. However if the jet is in the plane of the sky, rather than pointing at the observer as in blazars, radio variability would be slower. Falcke et al. (2001) speculate similarly regarding the lack of strong radio variability in radio-loud quasars although they do not reach any firm conclusions.
Another alternative is that the radio emission in Seyfert galaxies does not come from a jet, as in hard state sources, but arises in the outer parts of the X-ray emitting corona (Laor & Behar 2008). In Fig. 15 we plot our current data onto Fig.2 from Laor & Behar (2008) and see that NGC 4051 agrees reasonably with the Gdel-Benz 1993 relationship for coronally active stars, i.e. . In the coronal model, rapid large amplitude radio variability is not expected at frequencies where the source is optically thick. This situation is approximately the case during our A configuration observations which indicate a spectral index of . Such variability is, indeed, not seen. Similar considerations would, of course, also apply to some extent to a side-on jet and the highly collimated co-linear structure of the compact VLBI components is a significant problem for the coronal model. As jets are generally agreed to arise from the corona, the truth may lie part way between the pure coronal and pure jet models. In this galaxy where an outflow of large solid angle is seen in [OIII] observations (Christopoulou et al. 1997), the compact radio components separated from the nucleus may arise from a central, higher velocity region within the overall outflow. The core radio emission may arise from a combination of a jet and a corona. If there is any long term correlated variations between the radio and X-ray bands, they may simply reflect long term changes in accretion rate, upon which both bands depend, rather than a direct link between the emission processes.
7 Conclusions
Despite factors of 10 X-ray variability, we see no clear evidence
for variability of the core of the soft state narrow line Seyfert 1
galaxy NGC 4051 at 8.4GHz over a 16 month period of monitoring at
2-weekly intervals, with the possible exception of very low amplitude
(mJy) variations during the A configuration observations
where the core is best resolved from surrounding structures. The
latter tentative variations correlate weakly with the much larger
amplitude X-ray variations. Our resultant radio and mean X-ray
luminosity make NGC 4051 about a decade radio quieter than the hard
state objects which define the ‘fundamental plane’ for hard state
accreting black holes, although the scatter about the plane is almost
of the same order. Given the collimated VLBI structure which hints at the
presence of an unseen jet, the lack of radio variability is, at first sight,
surprising, although a side-on jet, observed at a frequency where it
is optically thick, would not vary as rapidly as a face-on blazar
jet. A coronal model agrees well with the radio/X-ray flux ratio, and
the lack of radio variability, but the collimated radio structure is
then hard to explain. A mixture of jet and coronal emission may
explain the observations but further, more sensitive, radio
observations, with high angular resolution and a fixed beamshape, are
required to confirm whether the radio emission from NGC 4051 does
indeed vary.
ACKNOWLEDGMENTS
We thank Ari Laor, Julia Riley, Tom Muxlow, Martin Bell and an anonymous referee for useful discussions and comments. We also thank Ari Laor for providing the Supermongo code for producing Fig.2 of Laor & Behar (2008). SJ acknowledges support from an STFC research studentship and IMcH acknowledges support under STFC grant ST/G003084/1
References
- Bell et al. (2010) Bell M. E., Tzioumis T., Uttley P., Fender R. P., Arevalo P., Breedt E., McHardy I., Calvelo D. E., Jamil O., Koerding E., 2010, ArXiv e-prints
- Belloni (2010) Belloni T. M., 2010, in T. Belloni ed., Lecture Notes in Physics, Berlin Springer Verlag Vol. 794 of Lecture Notes in Physics, Berlin Springer Verlag, States and Transitions in Black Hole Binaries. pp 53–+
- Breedt et al. (2010) Breedt E., McHardy I. M., Arévalo P., Uttley P., Sergeev S. G., Minezaki T., Yoshii Y., Sakata Y., Lira P., Chesnok N. G., 2010, MNRAS, 403, 605
- Brinkmann et al. (2000) Brinkmann W., Laurent-Muehleisen S. A., Voges W., Siebert J., Becker R. H., Brotherton M. S., White R. L., Gregg M. D., 2000, A&A, 356, 445
- Brocksopp et al. (2002) Brocksopp C., Fender R. P., McCollough M., Pooley G. G., Rupen M. P., Hjellming R. M., de la Force C. J., Spencer R. E., Muxlow T. W. B., Garrington S. T., Trushkin S., 2002, MNRAS, 331, 765
- Christopoulou et al. (1997) Christopoulou P. E., Holloway A. J., Steffen W., Mundell C. G., Thean A. H. C., Goudis C. D., Meaburn J., Pedlar A., 1997, MNRAS, 284, 385
- Corbel et al. (2004) Corbel S., Fender R. P., Tomsick J. A., Tzioumis A. K., Tingay S., 2004, ApJ, 617, 1272
- Corbel et al. (2003) Corbel S., Nowak M. A., Fender R. P., Tzioumis A. K., Markoff S., 2003, A&A, 400, 1007
- Di Matteo et al. (1999) Di Matteo T., Fabian A. C., Rees M. J., Carilli C. L., Ivison R. J., 1999, MNRAS, 305, 492
- Falcke et al. (2004) Falcke H., Körding E., Markoff S., 2004, A&A, 414, 895
- Falcke et al. (2001) Falcke H., Lehár J., Barvainis R., Nagar N. M., Wilson A. S., 2001, in B. M. Peterson, R. W. Pogge, & R. S. Polidan ed., Probing the Physics of Active Galactic Nuclei Vol. 224 of Astronomical Society of the Pacific Conference Series, Radio Variability in Radio-Quiet Quasars and Low-Luminosity AGN. pp 265–+
- Falcke et al. (2001) Falcke H., Markoff S., Fender R., 2001, in Astronomische Gesellschaft Meeting Abstracts X-ray Emission from Galactic Jets: X-ray Binaries and Sgr A*. pp 107–+
- Fender (2010) Fender R., 2010, in T. Belloni ed., Lecture Notes in Physics, Berlin Springer Verlag Vol. 794 of Lecture Notes in Physics, Berlin Springer Verlag, ‘Disc-Jet’ Coupling in Black Hole X-Ray Binaries and Active Galactic Nuclei. pp 115–+
- Fender (2001) Fender R. P., 2001, in Black Holes in Binaries and Galactic Nuclei Black-Hole States and Radio-Jet Formation. pp 193–+
- Fender et al. (2004) Fender R. P., Belloni T. M., Gallo E., 2004, MNRAS, 355, 1105
- Fender et al. (2009) Fender R. P., Homan J., Belloni T. M., 2009, MNRAS, 396, 1370
- Gallo et al. (2006) Gallo E., Fender R. P., Miller-Jones J. C. A., Merloni A., Jonker P. G., Heinz S., Maccarone T. J., van der Klis M., 2006, MNRAS, 370, 1351
- Gallo et al. (2003) Gallo E., Fender R. P., Pooley G. G., 2003, MNRAS, 344, 60
- Giroletti & Panessa (2009) Giroletti M., Panessa F., 2009, ApJ, 706, L260
- Gudel & Benz (1993) Gudel M., Benz A. O., 1993, ApJ, 405, L63
- Körding et al. (2006) Körding E., Falcke H., Corbel S., 2006, A&A, 456, 439
- Kukula et al. (1995) Kukula M. J., Pedlar A., Baum S. A., O’Dea C. P., 1995, MNRAS, 276, 1262
- Lamer et al. (2003) Lamer G., McHardy I. M., Uttley P., Jahoda K., 2003, MNRAS, 338, 323
- Laor & Behar (2008) Laor A., Behar E., 2008, MNRAS, 390, 847
- McClintock & Remillard (2006) McClintock J. E., Remillard R. A., 2006, Black hole binaries. pp 157–213
- Merloni et al. (2003) Merloni A., Heinz S., di Matteo T., 2003, MNRAS, 345, 1057
- McHardy et al. (2007) McHardy I., Lawson A., Newsam A., Marscher A. P., Sokolov A. S., Urry C. M., Wehrle A. E., 2007, MNRAS, 375, 1521
- McHardy (2005) McHardy I. M., 2005, in Gierlinski M., Done C., eds, http://star-www.dur.ac.uk/gier/bennevis/frameset.html X-ray variability of AGN: Link to larger scale galaxy properties
- McHardy et al. (2005) McHardy I. M., Gunn K. F., Uttley P., Goad M. R., 2005, MNRAS, 359, 1469
- McHardy et al. (2004) McHardy I. M., Papadakis I. E., Uttley P., Page M. J., Mason K. O., 2004, MNRAS, 348, 783
- Mullin et al. (2008) Mullin L. M., Riley J. M., Hardcastle M. J., 2008, MNRAS, 390, 595
- Mundell et al. (2009) Mundell C. G., Ferruit P., Nagar N., Wilson A. S., 2009, ApJ, 703, 802
- Neff & de Bruyn (1983) Neff S. G., de Bruyn A. G., 1983, A&A, 128, 318
- Panessa et al. (2007) Panessa F., Barcons X., Bassani L., Cappi M., Carrera F. J., Ho L. C., Pellegrini S., 2007, A&A, 467, 519
- Peterson et al. (2000) Peterson B. M., McHardy I. M., Wilkes B. J., Berlind P., Bertram R., Calkins M., Collier S. J., Huchra J. P., Mathur S., Papadakis I., Peters J., Pogge R. W., Romano P., Tokarz S., Uttley P., Vestergaard M., Wagner R. M., 2000, ApJ, 542, 161
- Ponti et al. (2006) Ponti G., Miniutti G., Cappi M., Maraschi L., Fabian A. C., Iwasawa K., 2006, in A. Wilson ed., The X-ray Universe 2005 Vol. 604 of ESA Special Publication, A New Interpretation of the X-ray Spectral Variability of NGC 4051. pp 479–+
- Russell (2002) Russell D. G., 2002, ApJ, 565, 681
- Shapiro et al. (1976) Shapiro S. L., Lightman A. P., Eardley D. M., 1976, ApJ, 204, 187
- Stirling et al. (2001) Stirling A. M., Spencer R. E., de la Force C. J., Garrett M. A., Fender R. P., Ogley R. N., 2001, MNRAS, 327, 1273
- Terashima et al. (2008) Terashima Y., Gallo L. C., Inoue H., Markowitz A. G., Reeves J. N., Anabuki N., Fabian A. C., Griffiths R. E., Hayashida K., Itoh T., Kokubun N., Kubota A., Miniutti G., Takahashi T., Yamauchi M., Yonetoku D., 2008, ArXiv e-prints
- Ulvestad & Wilson (1984) Ulvestad J. S., Wilson A. S., 1984, ApJ, 285, 439
- Woo & Urry (2002) Woo J., Urry C. M., 2002, ApJ, 581, L5
- Wrobel (2000) Wrobel J. M., 2000, ApJ, 531, 716