A GALEX/Spitzer survey of the Cl 0016+16 supercluster at z=0.55: acceleration of the onset of star-formation in satellite groups
Abstract
We present the results of a panoramic (15 Mpc-scale) survey of the Cl 0016+16 () supercluster using Spitzer Space Telescope MIPS 24m and Galaxy Evolution Explorer near-UV (2500Å; NUV) imaging. The supercluster regions probed are characterised by several dense nodes connected by a pronounced intermediate-density filamentary structure. We have studied the mid-IR and NUV properties of potential cluster members within a photometric redshift slice, compared to an identical blank field selection. We have two main findings: (a) the star-formation rates of individual star-forming galaxies throughout the cluster are not significantly different to identically selected field galaxies, and (b) the cluster harbours pockets of ‘accelerated’ activity where galaxies have an enhanced probability of undergoing star formation. This observation could be explained in a simple model of ‘pre-processing’ of galaxies during cluster infall: galaxies in satellite groups have an increased chance of having star-formation triggered via gravitational tidal interactions compared to their counterparts in the field, but there is no environmental mechanism boosting the individual star-formation rates of galaxies. We estimate a lower-limit for the total star-formation rate of galaxies in the supercluster as 850 yr-1 (field corrected). If this rate is maintained over the typical infall time of a few Gyr, then the infall population could contribute – of stellar mass to the structure.
keywords:
clusters: galaxies, clusters: individual: Cl 0016+16, galaxies: mid-infrared1 Introduction
One of the characteristics of the formation of structure in the Universe is the build up of rich clusters via accretion of galaxies, or groups of galaxies, often arriving in the densest regions through filaments. Since it has long been known that galaxies falling into rich clusters undergo significant evolution compared to those remaining in the average density ‘field’ (Butcher & Oemler 1974; Dressler 1980), what is the role of this filamentary accretion in influencing the star formation histories of infalling galaxies? Most studies of cluster environments have concentrated on the densest environments within them: the cores. However, the intermediate environments connecting the cores to the surrounding field (or rather, to the cosmic web) are just as important to study – especially at where the astrophysical processes responsible for shaping the galaxy populations of the cores of local clusters are operating (Dressler et al. 1997).
With wide-field surveys and sensitive multi-wavelength facilities, it is now becoming more practical to survey these large scale peripheral ‘interface’ regions. In this work we focus on a survey of the filamentary large scale structure surrounding the rich cluster Cl 0016+16 at . We have used the Mid-Infrared Photometer (MIPS; 24m) on board the Spitzer Space Telescope and the near-UV (NUV; 2500Å) capabilities of the Galaxy Evolution Explorer (GALEX) space telescope to map an extended region around the cluster, which is one of the best studied environments at intermediate redshift (e.g. Butcher & Oemler 1984; Ellis et al. 1997; Dressler et al. 1999; Brown et al. 2000; Worrall & Birkinshaw 2003; Zemcov et al. 2003; Dahlen et al. 2004). In particular, Kodama et al. (2005) used deep Subaru SuprimeCam BVRIz panoramic imaging of the cluster to derive photometric redshifts over a wide region around the cluster core, showing that two nearby X-ray selected clusters RX J0018.3+1618 and RX J0018.8+1602 are connected to Cl 0016+16 by a filamentary structure extending some 20 Mpc away from the dense cluster core (Koo 1981; Hughes, Birkinshaw & Huchra 1995; Connolly et al. 1996; Hughes & Birkinshaw 1998). More extensive spectroscopic follow-up by Tanaka et al. (2007) confirms the physical identity of the filamentary structures.
As in our previous work (Geach et al. 2006), our aim is to reveal dusty star-formation within the cluster, efficiently traced by 24m emission (probing rest-frame 15m emission at , a well calibrated indicator at ; see also studies by Duc et al. 2000, 2004; Fadda et al. 2000, 2008; Metcalfe et al. 2003; Biviano et al. 2004; Coia et al. 2004; Geach et al. 2006, 2009; Marcillac et al. 2007; Bai et al. 2007; Oemler et al. 2008; Koyama et al. 2008; Dressler et al. 2009). In addition to the obscured activity, we also exploit the NUV imaging to trace un-obscured star-formation. The NUV observations allow us to trace star-formation rates (SFRs) in less obscured (but more numerous) galaxies in the cluster. Tracking both obscured and un-obscured star-formation is important in building a complete picture of the environmental influences on galaxy evolution.
This work differs from previous cluster studies at this redshift, because the physical scale probed by our survey around Cl 0016+16 allows us to study new regimes in terms of the dynamic range of local environment. Cl 0016+16 exhibits the full complement of sub-environments including dense cores, moderate density filaments and a smooth, intermediate density region blending in with the surrounding field. Our aim is to perform an unbiased census of the star-forming populations within these sub-environments to search for signatures of environmental trends, potentially providing clues on the mechanisms driving galaxy evolution in the most biased regions at . In §2 we describe the Spitzer and GALEX observations, and our main results are presented in §3. We interpret and discuss the results in §4. Throughout this work we assume ( km s-1 Mpc-1) and . In this cosmology, the projected scale is 300 kpc/′.
2 Ultraviolet & mid-infrared observations
The core region of Cl 0016+16 was mapped as part of the GTO program 83, and we expanded this coverage to extend in the Cycle 5 GO program 30263. The AORs were designed to maximise coverage of the extended filamentary structure identified in the wide-field photometric survey of Tanaka et al. (2007), and match the depth of our existing MIPS observations of clusters (Geach et al. 2006). Data was reduced from the Basic Calibrated Data stage using the latest version of the mopex software, and follow the same procedure for post-processing and object detection as described in Geach et al. (2006). We use the coverage and standard deviation maps generated by mopex in the reduction process to estimate the average depth of the 24m map, which has a typical r.m.s. of 0.04 mJy.
We obtained GALEX imaging of Cl 0016+16 in September 2007. GALEX simultaneously observes co-aligned fields in two ultraviolet bands: FUV (Å) and NUV (Å). The GALEX field of view is circular, with a nominal diameter of 75′, although the outermost 3′ suffers from poorer image quality. The total exposure time of the observations was 60 ksec, giving a limiting sensitivity in the NUV of 25.6 mag (5). The PSF for both GALEX bands is 5′′ FWHM, which is well matched to the 6′′ MIPS beam. Photometry was extracted from the standard GALEX pipeline intensity maps, measured in 8′′ diameter apertures. The sky background was estimated from an annulus with inner radius 5′′ and outer radius 9′′.
To isolate galaxies at the redshift of the cluster, we have used the optical (Subaru) BVRIz photometric redshift information available over the full region (Kodama et al. 2005). In the analysis of potential cluster members, we only consider galaxies with mag and with photometric redshifts selected at (Tanaka et al. 2007). From this base catalogue, we match 3 significance 24m (0.15 mJy) and NUV emitters with a simple geometric 2′′ offset criterion. This results in 58 24m detected potential cluster members and 168 NUV detected potential cluster members respectively.
For the evaluation of environmental trends it is helpful to have a large, independent, field sample with similar data-sets. For this we turn to the Cosmological Evolution Survey (COSMOS, Scoville et al. 2004) – a 2 square degree ‘blank-field’ multi-wavelength survey including Subaru SuprimeCam optical, SST/MIPS and GALEX/NUV imaging. This allows us to perform an identical selection in an average-biased region, enabling us to normalise the quantities we evaluate for the cluster. The completeness limits of our GALEX and SST imaging can be well matched to the COSMOS data, and the relative completeness functions in each band will have a negligible impact on our result (COSMOS 24m 5 limit is 67Jy, and the NUV limiting magnitude is 26 AB mag, Sanders et al. 2007; Zamojski et al. 2007; P. Capak, private communication). The COSMOS optical imaging was taken in identical Subaru bands to our survey. By applying identical photometric selections, we therefore have a very large, robust field control sample; the Poisson error in the total number of photometrically selected galaxies in the COSMOS region is
3 Results
3.1 An un-biased view of star-formation in the cluster
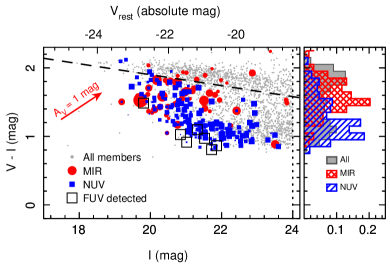
The 24m and NUV (probing rest-frame 15m and 1613Å at ) provides a unique new view of star-formation in the cluster, unbiased towards obscuration. In Figure 1 we present the vs. colour magnitude diagram for potential cluster members (approximately vs. rest-frame). The most interesting feature of this diagram is the clear bi-modality of the differently selected star-forming populations. The NUV-selected members, which are expected to trace mainly the un-obscured (or highly obscured but luminous) star-forming population forms a distinct blue sequence that extends to mag. The obscured star-forming systems selected in the mid-IR have colours best described as ‘green valley’ – intermediate between the blue cloud and red-sequence, with an average colour, 0.5 mags redder than the NUV selected members. Note that the reddening vector moves galaxies roughly perpendicular to the locus of NUV selected galaxies, and correspondingly there are several 24m selected members scattered into the red-sequence.
This reddening results in a complication in the analysis; while some of these galaxies may genuinely be very dusty star-formers, evolved passive galaxies on the red sequence could also emit in the infrared from a buried active galactic nucleus. These should be excluded from the analysis. Furthermore, the bulk of galaxies on the red sequence are old, and represent a potentially different star-formation history to the population we are interested in (the presently accreting infall population). The field population does not exhibit this sequence, and so for accurate comparison, we should apply a photometric cut that excludes them. This is shown as a dashed line on Figure 1, of the form mag.
There are 23 members with detections at both 24m and the NUV. Under the very simple assumption that the UV and mid-infrared emission is generated from the same star-forming regions in the discs, then these systems provide an opportunity to assess the total amount of extinction. We apply the calibration of Geach et al. (2006) for 24m detected galaxies at , where the monochromatic 24m luminosity is used to estimate the total (8–1000m) infrared luminosity under the assumption that the SEDs follow the template models of Dale & Helou (2002). In this case, . For the NUV fluxes, we apply the calibration of Salim et al. (2007): (where our NUV observations are probing the FUV rest-frame, and no k-correction has been applied).
For the 23 24m and NUV joint detections, we find , but with a large spread: the NUV derived SFRs underestimate the (presumably true) SFR by a range 5–75. If we naively assume that the disparity can simply be balanced by applying an extinction correction to the NUV fluxes, then the required reddening to achieve the average extinction at 1500Å (rest) is 3.1 magnitudes. Assuming a (Calzetti-type) curve, this corresponds to significant rest-frame reddening of mag. Note that we have only calculated the extinction for the NUV and 24m co-detections – we know a priori that a significant proportion of ultraviolet photons are able to escape the galaxy. In reality, as shown in Figure 1, while there is some overlap between the NUV and mid-infrared detected galaxies, there is also clear bi-modality, implying a distribution of individual extinctions that extends to more extreme obscuration regime. Similarly, there is a large population of star-forming galaxies that are not bright at 24m. Figure 1 shows that the majority of these are likely to be lower mass systems that trace the majority of the blue-cloud (some of these are even detected in the FUV band at 1500Å; evidence of the escape of continuum emission from near the Lyman limit in the galaxies’ rest-frames).
We can perform a basic census of the total star-formation associated with the cluster. The median SFR of 24m and NUV emitters is 25 yr-1 and 1.5 yr-1 respectively. Summing over all photometrically selected members, we estimate that the total instantaneous SFR in the supercluster is 2400 yr-1. Corrected for the contribution from the field, which we estimate from the average SFR surface density in the COSMOS field for an identically selected sample, we find a total SFR of 850 yr-1, which is overwhelmingly dominated by the infrared output (the NUV component has not been corrected for intrinsic extinction, and therefore this value can be considered a lower limit). The total SFR in the structure is in the range seen in infrared surveys of other massive clusters at similar redshift, which are characterised by a mass normalised rate of 10–100 yr-1 (Geach et al. 2006)111The core mass of Cl 0016+16 is in excess of , but here we have surveyed a large volume around the extended structure which encompasses a larger mass – therefore direct comparisons between clusters should be made with caution.. If the activity continues at a constant rate over the infall time-scale (few Gyr), then this population could contribute – stellar mass to the descendant of this environment. Are individual SFRs of galaxies in the cluster significantly different to the field? To test this, we perform a Kolmogoroff-Smirnov (K–S) test of the NUV and 24m flux distributions in equivalent photo- slices in the Cl 0016+16 field and the COSMOS field. We find no significant difference in either the NUV or 24m selected galaxies, with K–S probabilities of 0.999 and 0.980 respectively.
3.2 The distribution of star-formation in the cluster
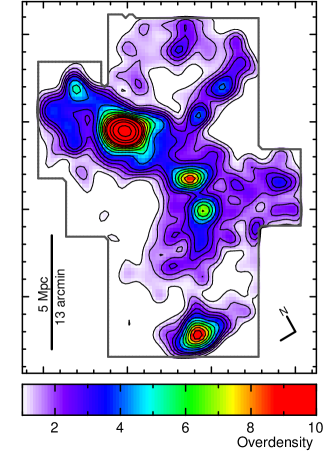
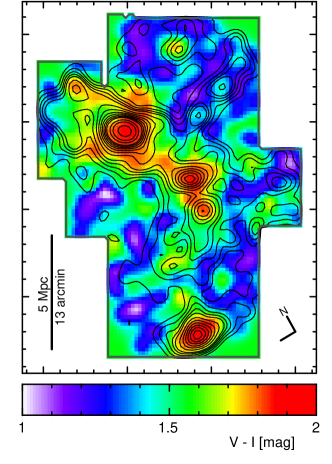
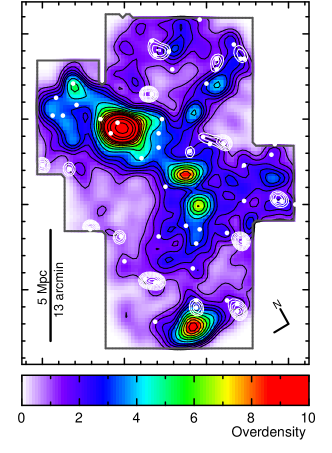
Since we are mainly interested in the distribution (and field comparison) of the star-forming galaxies relative to the overall large-scale structure, we have created spatially smoothed maps of the cluster222In this mapping analysis, we exclude the quasar within the cluster () at (, ) = (00h18m31.9s, 16∘29′26′′) (Margon et al. 1983). The QSO is co-detected in the far-UV, near-UV and 24m bands; the total far-UV (1500Å), near-UV (2500Å) and 24m flux density of the QSO are 59Jy, 91Jy and 2.5mJy respectively.. Taking the MIPS image as a starting point, we first created a binary mask image based on the 24m coverage. We adopt a grid scale of 25′′/pixel, and at every grid cell we estimate the surface density of all galaxies within 1′ (300 kpc). We map the local surface density of all photometric redshift selected galaxies across the field by counting the number of galaxies within 300 kpc and normalising to the density of identically selected galaxies in the COSMOS field. Figure 2 shows the resultant ‘overdensity’ map of the super cluster, highlighting several dense nodes, surrounded by an intermediate-density environment with average surface densities 2–3 that of the field. For comparison, we also show the local average colour of galaxies in corresponding environments; clearly showing the pronounced reddening of galaxies towards regions of high density.
We introduce a simple measure to map how star-formation is distributed across the structure, again evaluated on 300 kpc scales:
| (1) |
Where local fraction of star-forming cluster members can be taken as the ratio of the number of galaxies above a limiting NUV or 24m flux to the total number of galaxies selected in the photometric redshift slice. By normalising to the equivalent fraction in the field, a map of this simple statistic should reveal where galaxies have an increased probability of exhibiting on-going star-formation. This is a measure of excess activity that takes into account the fact that there are naturally more galaxies in the cluster environment.
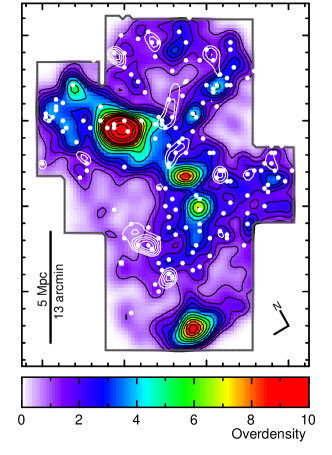
Maps of calculated for the NUV and 24m emitters are shown as contours in Figure 2. Regions where can be considered as environments where the probability of any one galaxy in the locale is enhanced over the surrounding regions. Obviously, this statistic is sensitive to shot-noise, and so the significance of values of this ‘excess’ must be carefully assessed. We do this by performing a boot-strap like simulation, re-evaluating after repeatedly randomly shuffling the NUV and 24m fluxes of potential cluster members. The fraction of pixels in the randomised map with some is an indication of the significance of finding regions with similar excess in the ‘real’ map. We perform this randomisation 100 times to build-up a robust estimate of the distribution of in the shuffled maps, and define significant values as . This corresponds to values of and in the NUV and 24m respectively, and we fix these as the lowest contours in Figure 2.
The K–S test of the flux distribution described in §§3.1 showed that there is no significant difference between the SFRs of galaxies in and around the cluster and the randomly sampled field. This implies that there is no environmental process boosting the SFRs of individual galaxies. However, we have identified regions within the cluster where the probability of a galaxy undergoing star-formation is enhanced. Although these pockets of activity do not account for all of the star-formation currently occurring in the cluster (Figure 2 shows that NUV and 24m emitters are detected throughout the structure), they point to a important stage in the star-formation histories of galaxies evolving in highly biased environments. It should not surprise us that the average SFRs of these galaxies are similar to the field. Unless the galaxies being accreted onto the cluster are systematically richer in their molecular gas content, there is nothing intrinsic that would boost their SFRs once triggered. A caveat to this is that it could be possible to drive star-formation at higher rates via more intense local environmental processes: mergers or violent tidal interactions for example – these can perturb and collapse the molecular gas clouds within discs, perhaps boosting the density (and therefore intensity) of star-forming regions within them. Without more detailed follow-up study of these groups (for example high-resolution imaging, or a molecular gas survey for galaxies at fixed stellar mass in the cluster and the field), it is difficult to conclusively say what the dominant triggering mechanisms are, but we propose that mild galaxy-galaxy tidal interactions are likely to play a pivotal role (Martig & Bournaud 2008). The increased frequency of these tidal events within small satellite groups as they are accreted into the cluster could be responsible for the observed enhancement of the accelerated onset of star-formation in these galaxies.
4 Discussion & Conclusions
The build-up of stellar mass in rich clusters is intimately linked to the accretion of groups. Semi-analytic models that apply a comprehensive treatment for the environmental processing of galaxies as they are accreted into massive halos (Font et al. 2008) predict that a large fraction of stellar mass assembly of massive () halos comes from the merging of group-size halos. In an analysis of stellar mass assembly following halo merger trees underpinning a galform semi-analytic simulation, McGee et al. (2009) show that at , 30–40% of the total stellar mass in halos of mass was in a substructure of mass of at least at the time of accretion. Thus, a large fraction of the stellar mass budget of rich clusters is delivered via the infall of groups. The panoramic observations of the supercluster around Cl 0016+16 presented here offer a snapshot of this process in action. Where star formation is occurring, individual rates appear to be at the same level as an identically selected field-sample; there is apparently no process that is systematically boosting the SFRs. However, we have identified pockets of activity in the periphery regions which can be interpreted as an enhancement of the probability of any one galaxy exhibiting on-going star formation. This could be a sign of an acceleration of the onset of star-formation in infalling satellite groups as they are assimilated into the supercluster; a process that is likely to take several Gyr.
Our results are in good agreement with other similar mid-infrared surveys of filament structures at higher and lower redshifts. For example, in another 24m survey, Fadda et al. (2008) show that star formation is enhanced (relative to the rest of the cluster) in filaments feeding the cluster Abell 1763 (). It is argued that the inefficiency of the hot intracluster media of filaments allows galaxies to retain their cold gas reservoirs (compared to the much harsher conditions in the inner regions), and the relatively low velocity dispersions could promote galaxy-galaxy tidal interactions that may trigger star formation during infall. At higher redshift, , Marcillac et al. (2007), Bai et al. (2007) and Koyama et al. (2008) use mid-infrared observations to show that the outskirts of more distant clusters also contain large populations of starburst galaxies, but that this activity is suppressed, or at least, is not obvious in the clusters’ highest density regions. More recently direct far-infrared and submillimeter cluster surveys have also revealed the presence of an active population of galaxies on the peripheral environments of rich clusters (e.g. Braglia et al. 2010, Rawle et al. 2010, Pereira et al. 2010), consistent with this picture.
What physical process is driving this form of enhancement? A simple scenario is that the star-formation is being triggered during mild tidal interactions during the assembly of small, bound groups. Given the long time-scale for the complete accretion of a satellite group into the cluster core, this implies that a significant fraction of the stellar mass assembly actually occurs ‘in-place’ within the groups. Indeed, other observational studies have shown that there is a enhanced fraction of early-type ‘red’ galaxies in groups of galaxies (Zabludoff & Mulchaey 1998; Tran et al. 2001), implying at least some accelerated evolution of galaxies in even moderate environments compared to the field. The inefficiency of the intragroup medium for terminating star-formation via ram pressure stripping, and related processes (e.g. Moore et al. 1996, Bekki 2009) means that once triggered, there is little to hinder the activity, and the timescale for cluster infall is long enough for significant stellar evolution to take place (several Gyr, e.g. Treu et al. 2003). Thus, the cessation of star-formation in the cluster outskirts is more likely to be governed by gas exhaustion – long before the galaxies reach the more hostile cluster core. This does not mean that the virialised cluster environment does not profoundly influence these galaxies’ star-formation histories. Although stellar mass can be built up without hindrance on the cluster outskirts, once the galaxies reach the hotter, virialised intracluster medium of the core, further cooling of gas (and therefore further stellar mass build-up) is prevented.
The next step is to understand the group-scale physics responsible for triggering star-formation, and perform a more detailed study of the mode of star-formation in these galaxies. One of the most important goals is to understand more subtle dependencies on cluster galaxies’ star-formation histories that connect both the galaxies’ intrinsic properties (most importantly their mass) and wider environmental effects. As we have shown here, such studies require the union of large, representative field samples and panoramic multi-wavelength surveys of the rare cluster environments.
acknowledgements
We thank the referee for a constructive report. The authors wish to thank Masayuki Tanaka, Taddy Kodama & Yusei Koyama for providing a merged catalogue of spectroscopic and photometric redshifts for the extended cluster region, Subaru SuprimeCam (PISCES) imaging and useful comments, and Peter Capak for helpful discussions on the COSMOS data. J.E.G. acknowledges the National Science and Engineering Council (NSERC) of Canada and the U.K. Science and Technology Facilities Council (STFC). I.R.S. also acknowledges STFC. J.E.G. thanks the Royal Society for the award of an International Travel Grant, and the hospitality of the California Institute of Technology during March 2010, which expedited the completion of this work. This research has been based on observations made with the Spitzer Space Telescope and the Galaxy Evolution Explorer which are operated by the Jet Propulsion Laboratory, California Institute of Technology, under a contract with NASA.
References
- Author et al. (2001) Bekki, K, 2009, MNRAS, 399, 2221
- Author et al. (2001) Braglia et al. 2010, astro-ph/1003.2629
- Author et al. (2001) Brown, T. M., Bowers, C. W., Kimble, R. A., Ferguson, H. C., 2000, ApJ, 529, L89
- Author et al. (2001) Biviano, A., Metcalfe, L., McBreen, B., Altieri, B., Coia, D., Kessler, M. F., Kneib, J.-P., Leech, K., Okumura, K., Ott, S., Perez-Martinez, R., Sanchez-Fernandez, C., Schulz, B., 2004, A&A, 425, 33
- Author et al. (2001) Butcher, H., Oemler, A., Jr, 1984, ApJ, 285, 426
- Author et al. (2001) Coia, D., Metcalfe, L., McBreen, B., Biviano, A., Smail, I., Altieri, B., Kneib, J. -P., McBreen, S., Sanchez-Fernandez, C. , O’Halloran, B., 2005, A&A, 430, 59
- Author et al. (2001) Connolly, A. J., Szalay, A. S., Koo, D., Romer, A. K., Holden, B., Nichol, R. C., Miyaji, T., 1996, ApJ, 473, L67
- Author et al. (2001) Dale, D. A., Helou, G., 2002, ApJ, 576, 159
- Author et al. (2001) Dahlen, T., Fransson, C., Östlin, G., Näslund, M., 2004, MNRAS, 350, 253
- Author et al. (2001) Dressler, A., Oemler, A., Jr., Couch, W. J., Smail, I., Ellis, R. S., Barger, A., Butcher, H., Poggianti, B. M., Sharples, R. M., 1997, ApJ, 490, 577
- Author et al. (2001) Dressler, A., Smail, I., Poggianti, B. M., Butcher, H., Couch, W. J., Ellis, R. S., Oemler, A., Jr, 1999, ApJS, 122, 51
- Author et al. (2001) Dressler, A., et al., 2009, ApJ, 693, 140
- Author et al. (2001) Duc, P.-A., Brinks, E., Springel, V., Pichardo, B., Weilbacher, P., Mirabel, I. F., 2000, AJ, 120, 1238
- Author et al. (2001) Duc, P.-A., Fadda, D., Poggianti, B., Elbaz, D., Biviano, A., Flores, H., Moorwood, A., Franceschini, A., Cesarsky, C., 2004, IAU Colloq. 195: Outskirts of Galaxy Clusters: Intense Life in the Suburbs, Luminous infrared starbursts in a cluster of galaxies
- Author et al. (2001) Ebeling, H., Barrett, E., Donovan, D., Ma, C.-J., Edge, A. C., van Speybroeck, L., 2007, ApJ, 661, L33
- Author et al. (2001) Ellis, R. S., Smail, I., Dressler, A., Couch, W. J., Oemler, A., Jr., Butcher, H., Sharples, R. M., 1997, ApJ, 483, 582
- Author et al. (2001) Fasano, G., Poggianti, B. M., Couch, W. J., Bettoni, D., Kjærgaard, P., Moles, M., 2000, ApJ, 542, 673
- Author et al. (2001) Fadda, D., Biviano, A., Marleau, F. R., Storrie-Lombardi, L. J., Durret, F., 2008, ApJ, 672, L9
- Author et al. (2001) Font, A., et al., 2008, MNRAS, 389, 1619
- Author et al. (2001) Geach, J. E., et al. 2006, ApJ, 649, 661
- Author et al. (2001) Geach, J. E., Smail, I., Moran, S. M., Treu, T., Ellis, R. S., 2009, ApJ, 691, 783
- Author et al. (2001) Geach, J. E., Smail, I., Coppin, K., Moran, S. M., Edge, A. C., Ellis, R. S., 2009, MNRAS, 395, L62
- Author et al. (2001) Hughes, J. P., Birkinshaw, M., 1998, ApJ, 497, 645
- Author et al. (2001) Hughes, J. P., Birkinshaw, M., Huchra, J. P., 1995, ApJ, 448, L93
- Author et al. (2001) Kennicutt, R. C., Jr., 1998, ARA&A, 36, 189
- Author et al. (2001) Kodama, T., et al., 2005, PASJ, 57, 309
- Author et al. (2001) Koyama, Y., et al., 2008, MNRAS, 391, 1758
- Author et al. (2001) Koo, D. C., 1981, ApJ, 251, L25
- Author et al. (2001) Marciliac, D., et al., 2007, ApJ, 654, 825
- Author et al. (2001) Marleau, F. R., et al., 2004, ApJS, 154, 66
- Author et al. (2001) Martig, M., Bournaud, F., 2008, MNRAS, 385, L38
- Author et al. (2001) McCarthy, I. G., et al. 2008, MNRAS, 383, 593
- Author et al. (2001) Metcalfe, L., Kneib, J.-P., McBreen, B., Altieri, B., Biviano, A., Delaney, M., Elbaz, D., Kessler, M. F., Leech, K., Okumura, K., Ott, S., Perez-Martinez, R., Sanchez-Fernandez, C., Schulz, B., 2003, 407, 791
- Author et al. (2001) Moore, B., Katz, N., Lake, G., Dressler, A., Oemler, A., 1996, Nature, 379, 613
- Author et al. (2001) Munn, J. A., Koo, D. C., Kron, R. G., Majewski, S. R., Bershady, M. A., Smetanka, J. J., 1997, ApJS, 109, 45
- Author et al. (2001) Pereira, M. J., Haines, C. P., Smith, G. P., Egami, E., Moran, S. M., Finoguenov, A., Hardegree-Ullman, E., Okabe, N., Rawle, T., Rex, M., 2010, A&A, 518, L40
- Author et al. (2001) Rawle, T. et al. 2010, A&A, 518, L14
- Author et al. (2001) Salim, S. et al. 2007, ApJS, 173, 267
- Author et al. (2001) Sanders, D., et al., 2007, ApJ, 172, 86
- Author et al. (2001) Tanaka, M., Hoshi, T., Kodama, T., Kashikawa, N., 2007, MNRAS, 379, 1546
- Author et al. (2001) Tran, K.-V. H., Simard, L., Zabludoff, A. I., Mulchaey, J. S., 2001, ApJ, 549, 172
- Author et al. (2001) Worrall, D. M., Birkinshaw, M., 2003, MNRAS, 340, 1261
- Author et al. (2001) Zabludoff, A. I., Mulchaey, J. S., 1998, ApJ, 496, 39
- Author et al. (2001) Zemcov, M., Halpern, M., Borys, C., Chapman, S., Holland, W., Pierpaoli, E., Scott, D., 2003, MNRAS, 346, 1179
- Author et al. (2001) Zamojski et al. 2007, ApJS, 172, 468