The radiative X-ray and gamma-ray efficiencies of rotation powered pulsars
Abstract
We present a statistical analysis of the X-ray luminosity of rotation powered pulsars and their surrounding nebulae using the sample of Kargaltsev & Pavlov (2008) and we complement this with an analysis of the -ray-emission of Fermi detected pulsars. We report a strong trend in the efficiency with which spin-down power is converted to X-ray and -ray emission with characteristic age: young pulsars and their surrounding nebulae are efficient X-ray emitters, whereas in contrast old pulsars are efficient -ray emitters. We divided the X-ray sample in a young ( yr) and old sample and used linear regression to search for correlations between the logarithm of the X-ray and -ray luminosities and the logarithms of the periods and period derivatives. The X-ray emission from young pulsars and their nebulae are both consistent with . For old pulsars and their nebulae the X-ray luminosity is consistent with a more or less constant efficiency . For the -ray luminosity we confirm that .
We discuss these findings in the context of pair production inside pulsar magnetospheres and the striped wind model. We suggest that the striped wind model may explain the similarity between the X-ray properties of the pulsar wind nebulae and the pulsars themselves, which according to the striped wind model may both find their origin outside the light cylinder, in the pulsar wind zone.
Subject headings:
stars: neutron stars – pulsars: general – X-rays: stars1. Introduction
Despite more than four decades of research, the emission from pulsars and their surrounding nebulae is still poorly understood. Two important problems are the origin of pulsar -ray emission and, for pulsar wind nebulae (PWNe), the so-called sigma-problem (see the reviews by Gaensler & Slane, 2006; Arons, 2009; Kirk et al., 2009). The latter problem derives its name from the sigma-parameter, , which is the ratio of the energy density due to Poynting flux over the particle energy density, with the local magnetic field strength, the Lorentz factor of the pulsar wind, and the particle number density. According to theoretical models, most of the pulsar’s rotational energy loss rate (or spin-down power) is due to Poynting flux, i.e. the pulsar wind should have , but observations of PWNe indicate that most of the energy that has been lost is actually contained by the relativistic electrons/positrons. Somehow, the high flow is converted into kinetic energy somewhere between the pulsar’s magnetosphere and the wind termination shock, which converts the radial pulsar wind into an isotropic, relativistic particle distribution (Arons, 2009; Kirk et al., 2009).
A third, and perhaps related, problem is the high wind multiplicity factor. The combination of a high magnetic and rapid rotation results in a strong electric potential in the magnetosphere. This potential will be neutralized by charged particles that are stripped from the surface of the neutron star (Goldreich & Julian, 1969). The associated charged particle density is
| (1) |
with the pulsar’s period and the local magnetic field. A fraction of these particles will escape through open field lines, resulting in a particle flux
| (2) |
with the dipole surface magnetic field in units of G. However, X-ray (e.g. Gaensler et al., 2002) and TeV (de Jager, 2007) observations indicate that the number of relativistic electrons contained by PWNe turns out to be orders of magnitude larger than , i.e. , with the multiplicity factor being for a young pulsar like B1509-58 (de Jager, 2007). The origin of the additional plasma is likely electron/positron pair production in the magnetosphere. The pair production occurs in the presence of the high magnetic fields inside the magnetosphere, and requires the presence of high energy photons that are either the result of curvature radiation or inverse Compton scattering. The electrons that cause the emission are accelerated due to the extremely large voltage drop across the open field lines (Hibschman & Arons, 2001; Harding & Muslimov, 2002). For the inverse Compton scattering seed photons are necessary that are emitted by the hot polar caps of the pulsar, heated due to the bombardment by accelerated particles, or due to the cooling of the young neutron star.
Despite the many unsolved problems, pulsar research has thrived over the last decade thanks to many advances in observational techniques and numerical simulations. In particular high energy observations have contributed to a wealth of new information on pulsars and PWNe; from high spatial resolution X-ray images with Chandra, revealing torii and jets (e.g. Hester et al., 2002; Helfand et al., 2001; Bamba et al., 2010b), to a rapid progress in the field of TeV astronomy (Hinton & Hofmann, 2009, for a review), which have revealed an unexpectedly large population of very extended PWNe (e.g. de Jager, 2007; Mattana et al., 2009). This rapid growth in observational data has recently been augmented by the GeV -ray observatory Fermi, which has greatly increased the sample of -ray-emitting pulsars (Abdo et al., 2010).
Here we present a statistical analysis of two samples of rotation powered pulsars. One is those of X-ray pulsars compiled by Kargaltsev & Pavlov (2008), the other the aforementioned sample of Fermi-detected pulsars. Our analysis concentrates on what determines the radiative efficiency of pulsars and their PWNe. We report a surprisingly strong correlation between the X-ray luminosity of pulsars and their PWNe, which inversely correlates with characteristic age, at least for young pulsars. In contrast, the -ray emission correlates positively with characteristic pulsar age, as already noted by Abdo et al. (2010).
2. A statistical analysis
It is well known that the non-thermal X-ray luminosities of pulsars and PWNe are strongly correlated with the spin-down luminosity of the pulsar (Seward & Wang, 1988; Verbunt et al., 1996; Becker & Truemper, 1997; Possenti et al., 2002; Cheng et al., 2004; Kargaltsev & Pavlov, 2008). The efficiency with which the spin-down luminosity is converted into X-ray emission is usually indicated by the symbol
| (3) |
with in the range of . An important question is what determines this efficiency for both -ray and X-ray emission. For the PWNe may provide information on how well the spin-down luminosity is converted into relativistic particles, i.e. it is related to the sigma-problem.
For the statistical analysis described here we use the X-ray properties of pulsars and their nebulae as determined by Kargaltsev & Pavlov (2008). This sample is based on Chandra observations. The Chandra-ACIS instrument that was used has a poor timing resolution, so all pulsar luminosities are a combination of pulsed and unpulsed emission. However, given the high spatial resolution of Chandra, the X-ray flux from the pulsar could be accurately separated from the X-ray flux from the PWN. The X-ray luminosities were derived from the 0.5-8 keV fluxes, corrected for interstellar absorption and using the distance estimated listed in the paper. Kargaltsev & Pavlov (2008) list only the non-thermal X-ray luminosities, so the contribution of thermal X-ray emission, if present, was ignored. The uncertainties in the distance are the largest source of error in the luminosities. In general, the distance estimates may have errors of order , resulting in luminosity errors of order 4. Of course distance errors affect the pulsar and PWNe luminosities in the same way. A source of error for the PWNe luminosities may be underestimated flux contributions from low surface brightness emission at large radii. Indeed, Bamba et al. (2010a) recently reported the detection of low X-ray surface brightness structures around several PWNe by Suzaku. The fraction of the luminosity in these low surface brightness is, however, not more than a factor of 2 in luminosity. So all together, the logarithm of the luminosities may contain errors of the order of one decade.
We included in our study a statistical analysis of the -ray luminosities, based on the pulsed -ray emission of pulsar reported by Abdo et al. (2010). We made sure that the -ray luminosities of pulsars that were common to both the X-ray and -ray samples were based on the same distance estimates, namely those adopted by Kargaltsev & Pavlov (2008). For both the X-ray and -ray samples we excluded millisecond pulsars, and omitted pulsars without good distance estimates.
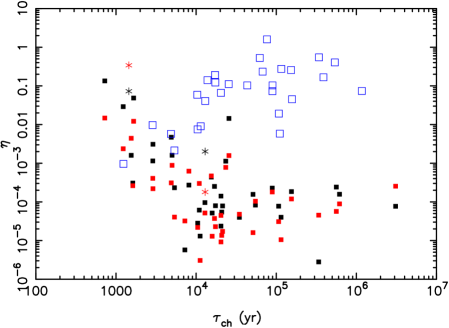
In figure 1 we show the correlation of the X-ray luminosity efficiency of pulsars and PWNe versus the characteristic spin-down age . We also included data points for two recently discovered PWNe; those surrounding the high energy pulsar J14003-6326 (Renaud et al., 2010) and AXP 1E1547.0- 5408 (Vink & Bamba, 2009). We did not include these in our statistical analysis, although their properties are consistent with the general trends we report below.
Figure 1 also shows the -ray efficiency, as obtained from the pulsed -ray luminosities determined by Abdo et al. (2010). This figure reveals the trend that young pulsars appear to have higher X-ray efficiencies than old pulsars. Moreover, the behavior is similar for the luminosities of the pulsars and the PWNe.
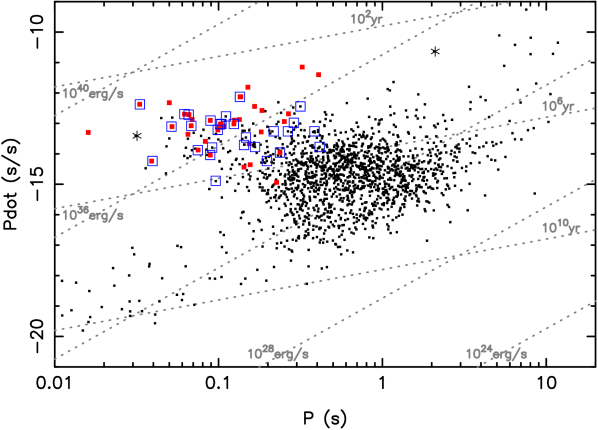
Figure 2 shows the timing properties of the pulsars in the two samples used for our statistical analysis in the diagram. It shows that on average the detected -ray pulsars seem to be somewhat older than the X-ray detected pulsars/PWNe, consistent with the trend that older pulsars are less efficient in emitting X-rays and more efficient in emitting -rays. Note, however, that an interpretation of this diagram is far from straightforward, because the detectability of a pulsar also depends on its distance and, for X-rays, on the interstellar absorption column.
A trend of decreasing X-ray luminosity with was reported before by Becker & Truemper (1997); Possenti et al. (2002), but figure 1 reveals it to be due to a trend in the efficiency, not in the overall spin-down power. For pulsars with yr the efficiency appears to be more or less constant. In contrast, young pulsars are not so efficient in producing -ray emission, as already noted by Abdo et al. (2010). The spread in the data points for a given characteristic is of order of 1-2 decades. As discussed above, the uncertainties in the luminosity can explain about 1 decade of this spread, but intrinsic variations, and for the -ray emission, beaming properties are expected to contribute to the spread as well.
In order to investigate the correlations between and further, one has to avoid as an independent variable, since both and are derived from combinations of the pulsar’s period and period derivative ; the spin-down luminosity is given by
| (4) |
with g cm2 the neutron star’s moment of inertia. For that reason we base our regression analysis on the logarithm111 We use to denote the 10-based logarithm. of the X-ray/-ray luminosity, as the quantity to be explained, and the independent variables , as the principle input variables for the model (c.f. Possenti et al., 2002).
As explained above the errors are dominated by systematic errors, mostly due to difficulties in estimating distances. For that reason we used the unweighted least square method, which means that the errors in the best-fit parameters are based on the variance of the residuals. The disadvantage is that we do not have an intrinsic goodness of fit statistic. However, we can compare two hypotheses using the F-test statistic, defined as:
| (5) |
here denotes the observed (-ray/X-ray) luminosity and we use to indicate the expected value of based on the best-fit parameters, and the subscript and to indicate two different best-fit models, is the number of degrees of freedom and is the sample size. The probability that the improvement in the sum of squared residuals is by pure chance is given by the -distribution.
From the above it is clear that we fitted the linear relation:
| (6) |
We compare this relation, using the F-test, with a functional form . This is essentially assuming that (equation 3) is constant. In addition we fit the relation
| (7) |
which corresponds to . This is a functional form that has been used before (e.g. Kargaltsev & Pavlov, 2008), and that seems to work particularly well for the -ray emission from pulsars (Arons, 1996; Abdo et al., 2010).
Since figure 1 suggests that young pulsars are more efficient X-ray emitters than old pulsars, we divided the X-ray sample in an old and a young population. As the precise characteristic age that should be chosen is a bit arbitrary, but lies somewhere between yr and yr, we decided to divide the sample in two more or less equally sized samples. This put the cut at yr.
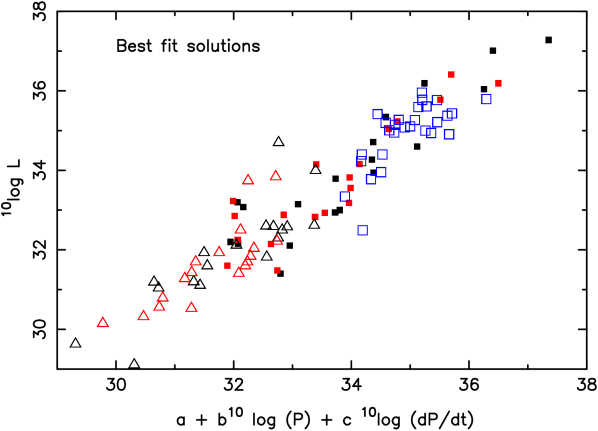
The result of the regression analysis is listed in Table 1, whereas figure 3 shows the results of applying the best-fit solutions to the different samples. The best-fit relations for young pulsars and PWNe indicate that the X-ray luminosity does not scale with , since in that case we would expect for equation (6) and , whereas we find and and and for PWNe and pulsars, respectively. This conclusion is based on both the best-fit parameters and their inferred errors, as on the F-test. The F-test, in fact, indicates that equation (6) provides a better fit than equation (3) at the 99.99% confidence level. Interestingly, the values for and for pulsars and PWNe are consistent with each other.
For older pulsars the F-values indicate that the X-ray emission efficiency is just as well described by equation (3) with , as by a linear dependency on and . Also this result is true for both the pulsar X-ray luminosity as for the PWN luminosity.
The least square fits for the Fermi-sample shows that the relation is indeed a good description of the data. For equation (7) we find , close to the expected 1/2, and for equation (6) we find and , whereas a scaling with implies and , in excellent agreement. The F-tests confirm this, and indicate that a constant value for can be rejected at the 99.9996% confidence level.
Finally, one may wonder whether the combined -ray and X-ray luminosity is more closely correlated with , than the -ray and X-ray luminosities individually. Unfortunately, this is hard to determine from the present data sets as there are only 15 pulsars that the two samples have in common, with most of them being older pulsars. In fact, the combined X-ray/-ray luminosity of all pulsars is dominated by the -ray emission, with the exception of the Crab pulsar. It is, therefore, not surprising that the best-fit relation between indicates , just like for -ray luminosity. However, as the number of -ray-detected pulsars will grow in the near future, it may be good to investigate the total radiative output from rotation powered pulsars in more detail, especially around yr, where the radiative output changes from X-ray to -ray domination.
3. Discussion
We presented a statistical study of the X-ray and -ray properties of rotation powered pulsars, with the aim of finding what trends underly the efficiency with which spin-down luminosity is converted into high energy radiation. We started our analysis by showing that young pulsars are efficient X-ray emitters, but poor -ray emitters, whereas it is the other way around for old pulsars. A trend of low X-ray luminosity as a function of characteristic age was reported by Becker & Truemper (1997); Possenti et al. (2002), but it is shown here that it is related to the efficiency with which spin-down luminosity is converted to X-ray emission, and not just due to an overall decline in spin-down luminosity.
In order to be as general as possible in finding trends in X-ray/-rayluminosities our main results are based on a regression analysis of X-ray luminosity of the pulsars/PWNe (Kargaltsev & Pavlov, 2008) and -ray luminosity of pulsars (Abdo et al., 2010) versus the pulse period and its derivative. This is a very generic method, which includes the possibility that the luminosity depends solely on spin-down luminosity. Thus encompassing other possible dependencies, such as on spin-down luminosity. Given the trend noted in figure 1 we divided the X-ray sample in two equally sized samples of young ( yr) and old pulsars.
Our statistical analysis produced two new findings: 1) the X-ray luminosity of pulsars and their surrounding PWNe appear closely correlated, with for young pulsars, whereas for old pulsars the best fit gives , the latter being close to, and statistically indistinguishable from, a constant X-ray emission efficiency ; 2) young pulsars are more efficient X-ray emitters than old pulsars, and have a different dependency for on and .
We also confirm the findings by Arons (1996); Abdo et al. (2010) that 1) the -ray luminosity is well described by ; 2) younger pulsars are less efficient in producing -rays. The latter trend is, therefore, the reverse of the X-ray luminosity (figure 1).
The question is what these findings reveal about pulsar X-ray emission mechanisms. First of all, the connection between the X-ray luminosities of pulsars and their PWNe may be surprising, given that the luminosities of the PWNe are, in general, affected by both the pulsar wind properties and the environment of the pulsar. In particular for young PWNe the luminosity is possibly affected by its interaction with a surrounding supernova remnant (SNR). The reverse shock of the SNR will during a certain phase of the SNR evolution compress the PWN, which naively may be assumed to result in a brightnening of the PWN. However, a recent study by Gelfand et al. (2009) showed the behavior of the PWN luminosity to be more complex. Their study indicates that the compression by the reverse shock leads to a brightening of the radio luminosity, but at the same time to an almost total quenching of the X-ray luminosity for a brief period (for the specific model they calculated this happened between 18-30 kyr). Apart from this brief phase, the X-ray luminosity traces the spin-down luminosity surprisingly well, with an expected fluctuation of about 0.3 decades in .
Given that apparently the X-ray luminosities of the pulsars and their PWNe seem to trace each other, and have similar dependencies on the period and period derivative, one cannot easily use the best-fit functions for young pulsars to derive a correlation of X-ray luminosity with some well known physical pulsar property, such as , , (the magnetic field at the light cylinder), , or . For young pulsars the X-ray emission is poorly fit with a dependency on (Table 1). This suggests that the X-ray luminosity from pulsars and PWNe may require a more complex model than the -ray luminosity, with its scaling. The best-fit formula does, however, explain the strong dependency on for young pulsars, since .
Secondly, the similar behavior of the pulsars and PWN X-ray luminosities suggest there is a physical connection between the two. It is usually assumed that the pulsar X-ray emission originates in the magnetosphere, whereas the X-ray emission from the nebulae comes from outside the termination shock. These are two distinct regions, which are separated by a region that encompasses the pulsar light cylinder and the so-called wind-zone (Kirk et al., 2009), the region in which the pulsar wind is formed.
It is tempting to speculate that the connection between the X-ray emission from the pulsars and PWNe may have something to do with the pair multiplicity. Models of pair creation in the magnetosphere indicate that the pair multiplicity is a function of the characteristic age (e.g. Hibschman & Arons, 2001, figure 6). This would mean that both the X-ray emission from the pulsar and from the PWNe are somehow proportional to the multiplicity. This is not a completely satisfactory explanation, because the X-ray synchrotron depends on the total energy contained by the pairs, not just by the total number of particles.
Another explanation for the similar behavior of pulsar and PWN luminosities is offered by the striped wind theory (Coroniti, 1990; Kirk et al., 2002, 2009). According to this theory the alternating magnetic fields generated by obliquely rotating pulsars leads to reconnecting magnetic fields in the wind zone. This transforms magnetic energy into kinetic energy, thereby changing the pulsar wind from a high to a low outflow. According to Kirk et al. (2002) the zone in which this heating and acceleration occurs could be the location of pulsed X-ray emission. Such a model makes it easier to explain why there is a connection between the pulsar and PWN luminosities, as in both cases the energy is generated in the wind zone. The higher pair multiplicity of young pulsars may be of additional importance as there are simply more particles available to be accelerated.
Finally, there is one other issue to consider, namely, why young pulsars do not seem to be efficient in generating -rays. The fact that it is the other way around for the X-ray emission, perhaps indicates that the pair multiplicity in young pulsars is so high that the electric fields in the magnetosphere are shorted out (Hibschman & Arons, 2001). It may also be worthwhile to investigate in more detail what the role of the seed photons for inverse Compton upscattering in young pulsars is. The Compton scattered photons (and in some cases curvature radiation generated photons) are converted in pairs, and form the basis of the pair multiplicity (Hibschman & Arons, 2001). The soft seed photons originate from the neutron star surface, and may the result of polar cap heating due to accelerated electron/positron beams, or they are the result of the cooling of the neutron star. The latter would induce a dependency on neutron star age, which could explain why young pulsars behave differently than old pulsars.
We have only briefly mentioned the TeV detected PWNe. The TeV luminosities of PWNe do not seem to correlate with spin-down luminosity (Mattana et al., 2009). The probable reason is that the TeV emission from PWNe is not so much determined by the current energy production of the pulsar, but reflects the time integrated energy input from the pulsar wind, which in itself scales with the initial spin-period . In X-rays the lifetime of the X-ray synchrotron emitting electrons is short compared to the pulsar lifetime, whereas in TeV (and in the radio) this is not the case.
We can therefore conclude that different parts of the electromagnetic spectrum inform us about different aspects of pulsars. The -ray emission and pulsed radio emission is likely related to what happens in the magnetosphere, whereas TeV and radio emission from the PWNe inform us about the time integrated properties of pulsars. Based on our statistical study we have added here the suggestion that the X-ray emission from the pulsar, like the X-ray emission from the PWNe, may inform us about what happens in one of the least understood regions surrounding the pulsar: the wind zone.
References
- Abdo et al. (2010) Abdo, A. A. et al. 2010, ApJS, 187, 460
- Arons (1996) Arons, J. 1996, A&AS, 120, C49
- Arons (2009) Arons, J. 2009, in Astrophysics and Space Science Library, Vol. 357, Astrophysics and Space Science Library, ed. W. Becker, 373
- Bamba et al. (2010a) Bamba, A., Anada, T., Dotani, T., Mori, K., Yamazaki, R., Ebisawa, K., & Vink, J. 2010a, ApJ, 719, L116
- Bamba et al. (2010b) Bamba, A., Mori, K., & Shibata, S. 2010b, ApJ, 709, 507
- Becker & Truemper (1997) Becker, W. & Truemper, J. 1997, A&A, 326, 682
- Camilo et al. (2007) Camilo, F., Ransom, S. M., Halpern, J. P., & Reynolds, J. 2007, ApJ, 666, L93
- Cheng et al. (2004) Cheng, K. S., Taam, R. E., & Wang, W. 2004, ApJ, 617, 480
- Coroniti (1990) Coroniti, F. V. 1990, ApJ, 349, 538
- de Jager (2007) de Jager, O. C. 2007, ApJ, 658, 1177
- Gaensler et al. (2002) Gaensler, B. M., Arons, J., Kaspi, V. M., Pivovaroff, M. J., Kawai, N., & Tamura, K. 2002, ApJ, 569, 878
- Gaensler & Slane (2006) Gaensler, B. M. & Slane, P. O. 2006, ARA&A, 44, 17
- Gelfand et al. (2009) Gelfand, J. D., Slane, P. O., & Zhang, W. 2009, ApJ, 703, 2051
- Goldreich & Julian (1969) Goldreich, P. & Julian, W. H. 1969, ApJ, 157, 869
- Harding & Muslimov (2002) Harding, A. K. & Muslimov, A. G. 2002, ApJ, 568, 862
- Helfand et al. (2001) Helfand, D. J., Gotthelf, E. V., & Halpern, J. P. 2001, ApJ, 556, 380
- Hester et al. (2002) Hester, J. J., Mori, K., Burrows, D., Gallagher, J. S., Graham, J. R., Halverson, M., Kader, A., Michel, F. C., & Scowen, P. 2002, ApJ, 577, L49
- Hibschman & Arons (2001) Hibschman, J. A. & Arons, J. 2001, ApJ, 554, 624
- Hinton & Hofmann (2009) Hinton, J. A. & Hofmann, W. 2009, ARA&A, 47, 523
- Kargaltsev & Pavlov (2008) Kargaltsev, O. & Pavlov, G. G. 2008, in AIP Conf. Series, Vol. 983, 40 Years of Pulsars: Millisecond Pulsars, Magnetars and More, ed. C. Bassa, Z. Wang, A. Cumming, & V. M. Kaspi, 171–185
- Kirk et al. (2009) Kirk, J. G., Lyubarsky, Y., & Petri, J. 2009, in Astrophysics and Space Science Library, Vol. 357, Astrophysics and Space Science Library, ed. W. Becker, 421
- Kirk et al. (2002) Kirk, J. G., Skjæraasen, O., & Gallant, Y. A. 2002, A&A, 388, L29
- Manchester et al. (2005) Manchester, R. N., Hobbs, G. B., Teoh, A., & Hobbs, M. 2005, AJ, 129, 1993
- Mattana et al. (2009) Mattana, F., Falanga, M., Götz, D., Terrier, R., Esposito, P., Pellizzoni, A., De Luca, A., Marandon, V., Goldwurm, A., & Caraveo, P. A. 2009, ApJ, 694, 12
- Possenti et al. (2002) Possenti, A., Cerutti, R., Colpi, M., & Mereghetti, S. 2002, A&A, 387, 993
- Renaud et al. (2010) Renaud, M., Marandon, V., Gotthelf, E. V., Rodriguez, J., Terrier, R., Mattana, F., Lebrun, F., Tomsick, J. A., & Manchester, R. N. 2010, ApJ, 716, 663
- Seward & Wang (1988) Seward, F. D. & Wang, Z.-R. 1988, ApJ, 332, 199
- Verbunt et al. (1996) Verbunt, F. et al. 1996, A&A, 311, L9
- Vink & Bamba (2009) Vink, J. & Bamba, A. 2009, ApJ, 707, L148
| X-ray222Based on Kargaltsev & Pavlov (2008), but omitting millisecond pulsars and non-resolved PWNe (#38,40). | -ray333Based on Abdo et al. (2010), but omitting millisecond pulsars and pulsars without distance estimates. | |||||
|---|---|---|---|---|---|---|
| Young444 yr | Old555 yr | |||||
| Fit formula | Parameter666All quoted errors are rms errors. | PWNe | PSRs | PWNe | PSRs | |
| (1) | ||||||
| (2) | ||||||
| 777-value and associated probability based on a comparison with formula 1 in this table. | ||||||
| (3) | a | |||||
| b | ||||||
| c | ||||||
| 888Based on a comparison with a fit using formula (1) in this table. | ||||||
| 999Based on a comparison with a fit using formula (2) in this table. | ||||||
| Sample size | 19 | 18 | 28 | |||