Quasi-periodic Oscillations in XTE J1550-564: The rms-flux relation
Abstract
We present an analysis of the short timescale variations in the properties of the strong (type “C”) quasi-periodic oscillation observed in XTE J1550-564 during its 1998 outburst. In particular, the QPO shows a correlation between absolute rms amplitude and mean source flux over timescales shorter than ksec. A linear rms-flux relation has been observed to be a common property of broad-band noise but here we report the first detection of rms-flux dependence in a QPO. The gradient of the rms-flux relation is correlated with the QPO peak frequency: from a strong positive correlation when the QPO peak frequency is below Hz, through no correlation, to a strong negative correlation when the peak frequency is above Hz. This is the first time a negative short term rms-flux relation has been observed in any component of the power spectrum. Previous work on both the broad-band noise and QPOs in a range of sources have suggested the presence of a filter reducing the amplitude of QPOs with increasing frequency. We attempt to remove the possible effects of this filter and find that the previously negative rms-flux relations above Hz become constant.
keywords:
X-rays:general - X-rays:binaries - X-rays:individual:XTE J1550-5641 Introduction
Accreting black holes show variations over a broad range of timescales. In the well-studied Galactic Black hole binaries (BHBs) their power spectra may include broad-band noise, band-limited noise (BLN) and quasi-periodic oscillations (QPOs), distinguished by their relative frequency widths (see e.g. van der Klis, 2006; McClintock & Remillard, 2006, for reviews). The exact origin of the variability and its characteristic frequencies remain elusive, although strong correlations between frequencies of different power-spectral components have been observed as well as correlations between frequencies and spectral parameters (see e.g. Klein-Wolt & van der Klis, 2008; Belloni et al., 2002; Remillard et al., 2002).
QPOs are observed over a range of frequencies in BHBs and NS, in BHBs they are commonly described as either low frequency 50 Hz or high frequency 100 Hz (van der Klis, 2006). Low frequency QPOs are often observed with further harmonics and sub harmonics and their formation mechanism is unclear. The three main types are commonly classified as A, B or C (Wijnands et al., 1999; Homan et al., 2001; Belloni et al., 2002; Casella et al., 2004, 2005), with types A and B observed in the soft intermediate states, and displaying different harmonic and phase lag behaviours, and the type Cs observed in hard states (i.e low-hard and hard intermediate) with strong broad-band noise. The frequency of type C QPOs is known to correlate with spectral properties of the source, the photon index, disc inner radius, disc temperature and both power law and disc fluxes (see e.g. Remillard et al., 2002; Muno et al., 1999) although there is as yet no consensus on the physical origin of QPOs (van der Klis, 2006; McClintock & Remillard, 2006; Done et al., 2007).
One of the simplest and most stable relationships observed between variability properties is the rms-flux relation, which connects the rms amplitude of variations to the mean flux level by a positive linear correlation that appears to operate over a wide range of timescales where the power spectra remain similar (Uttley & McHardy, 2001; Gleissner et al., 2004). This relation is inherent to the short-term variability of sources with an otherwise-stationary (or close to stationary) power-spectral shape. Longer-term changes in rms can be caused by changes in power-spectral shape which correlate with the spectral evolution of the source within and between the different spectral states, but these are different to the rms-flux relation which appears to be a fundamental aspect of the variability process itself. The linear rms-flux relation was initially observed in the BHB Cygnus X-1, to date the same linear rms-flux relation has been observed in Active Galactic Nuclei (Uttley & McHardy, 2001; Vaughan et al., 2003; Gaskell, 2004; Uttley et al., 2005), one neutron star X-ray binary (Uttley & McHardy, 2001; Uttley, 2004) and one Ultra-Luminous X-ray source (ULX) (Heil & Vaughan, 2010), it has also recently been observed over long timescales in the BHB GX 339-4 (Muñoz-Darias et al., 2010). This relation is observed in the noise components of the power spectrum, and in the Hz pulsation of the neutron star system SAX J1808.4-3658 (Uttley, 2004), but to date has not been studied for QPOs.
Arguably the most promising explanation for the linear rms-flux relation observed for the broad-band noise of accreting systems is the ‘propagating fluctuation’ model (see discussion and references in Uttley & McHardy (2001); Gleissner et al. (2004); Uttley (2004); Uttley et al. (2005)). In this general model long timescale fluctuations in the accretion rate originate from large radii in an accretion disc (perhaps as random variations in viscosity) and propagate inwards, modulating shorter timescale variations originating at smaller radii (e.g. Lyubarskii, 1997; King et al., 2004; Arévalo & Uttley, 2006), and eventually modulating the accretion rate in the innermost, X-ray producing regions. This simple scheme naturally explains X-ray emission that varies on a wide range of timescales, and a linear rms-flux relation due to the multiplicative coupling of variations on all timescales. It is not clear how QPOs fit into this scheme.
Secular ( 1 day) variations in the QPO properties (rms and frequency) are known to be correlated with the (energy spectral) evolution of black hole transient outbursts (i.e. changes in the physical state of the system). But this overall evolution of the outburst properties tends to follow distinct patterns, such as the hysteresis curve on the hardness-intensity diagram (HID; see e.g. Belloni et al., 2005; Belloni, 2010). As previously discussed, the within-observation variations (timescales 3ks studied here) are variations in an almost stationary process (presumably random fluctuations within the accretion flow), the average properties of which evolve through outburst (see Muñoz-Darias et al., 2010, and Figure 1). It is these relatively small and flux-correlated deviations from stationarity, and how they relate to other source properties, that are the subject of this paper.
We focus on the type ”C” QPOs observed at the beginning of the the 1998 outburst of XTE J1550-564. The long-term properties of this source have been studied extensively by Cui et al. (1999), Wijnands et al. (1999), Homan et al. (2001), Remillard et al. (2002), Sobczak et al. (2000b), Reilly et al. (2001), Chakrabarti et al. (2009), and Rao et al. (2010). Sobczak et al. (2000b) compared the changes in amplitude and frequency for the QPOs over the course of the outburst to the energy spectral components in both XTE J1550-564 and the 1996-97 outburst of GRO J1655-40. They found that the QPO frequency appears to be linked to both the disc flux and the strength of the power law. They also observe that for the outburst of XTE J1550-564, the amplitude of the QPO is closely linked to the QPO frequency: it rises until around 3 Hz but appears to then fall off above this point. Rao et al. (2010) split each observation into 128s segments and demonstrated that over time the frequency of the fundamental QPO component can be linked to the disc count rate suggesting that there is some correlation between frequency, flux and QPO amplitude over short timescales. We further examine the short term variations in these parameters for the QPO, concentrating on the rms-flux relation within each observation and its relation to the peak frequency.
2 Observations
We use observations taken by the PCA detector on RXTE from the 1998 outburst of XTE J1550-564 in programs P30188 and P30191, covering the first 46 days of the outburst. The data modes used all had 8 bit wide counters and are not likely to suffer the buffer overflow problems which can distort the rms-flux relation away from a linear relationship (seen in Gleissner et al., 2004, Appendix A). During the first half of the outburst the source reached a very bright intermediate state where the strong (“type C”) QPO shows high rms amplitudes, this means that they are ideal candidates to test the behaviour of the rms-flux relation for QPOs and how this relates to the continuum.
Binned mode data has been used for this analysis. There are a few variations of this data mode used over the outburst, so the energy ranges for some of the observations differ. The ranges have been chosen so that they are as consistent across the sample as possible, although slight variations remain between observations. The energy range chosen was as close to 4-14 keV as possible, and the difference between energy bands is no greater than 0.5 keV.
3 Data Analysis
In order to measure the rms-flux relation each continuous light curve is divided into non-overlapping 3 s intervals. Due to the lower frequency limit imposed by this segment size we only use observations from this sample where the primary type C QPO is above 1 Hz. In practice this includes most of the observations where the QPO is detected, only excluding six, leaving 48 observations to be processed. From each 3 s segment the power spectrum was estimated in absolute normalisation using standard techniques, and the background subtracted mean count rate of the interval, corrected to 1 PCU detector, was recorded. The power spectral estimates were then averaged in non-overlapping flux bins, with at least 20 intervals contributing to each bin, to provide well-determined power spectra as a function of flux. These power spectra were then fitted in xspec 12 (Arnaud, 1996).
The models discussed in Rao et al. (2010) have been applied, where multiple Lorentzians are used to describe the fit (see figure 1 of Rao et al., 2010, for representative fitted power spectra). In all observations the model used consisted of four Lorentzians: Two of these were fitted to the broad band noise, they are referred to in Rao et al. (2010) as and ( stands for flat topped noise at low frequencies 1 Hz and for peaked noise, generally seen at frequencies close to, or just above, the QPO harmonic). These two Lorentzians had Q-factors less than 2 ( where is the centroid frequency and the full width at half maximum). Following Rao et al. (2010) the primary QPO component is defined as the strongest feature in each observation. Due to the limited frequency range (0.33 - 100 Hz) within the flux-binned power spectra it is rarely possible to resolve the fundamental and both the harmonic and subharmonic simultaneously. For this reason the two further Lorentzians described the primary QPO component and either the harmonic or the sub-harmonic, depending on which was most visible. These Lorentzians are referred to as and either or . As in Rao et al. (2010) the Poisson noise component was not removed from the power spectra, but is included as an additional constant in the model. This model provided an adequate fit to all observations within the sample, the reduced chi-squared varied from 0.75 to 1.41, with the worst fit having a chi-squared of 354.1 with 179 degrees of freedom. Rao et al. (2010) indicated the need for a further high frequency broad-band component in some observations within their sample. All of these observations are ones where the QPO is below 1 Hz, therefore this was not necessary for the fitting of any observations used here. For each fit the Lorentzian properties were recorded, namely the total rms (in absolute units, i.e ct/s/PCU), the peak frequency () and the width. See Pottschmidt et al. (2003) section 3 for appropriate formulae. The rms value is corrected to represent the power in the QPO over only positive frequencies. This normalisation is thus the integrated power in the QPO () and the measured rms within the component is therefore .
4 Results
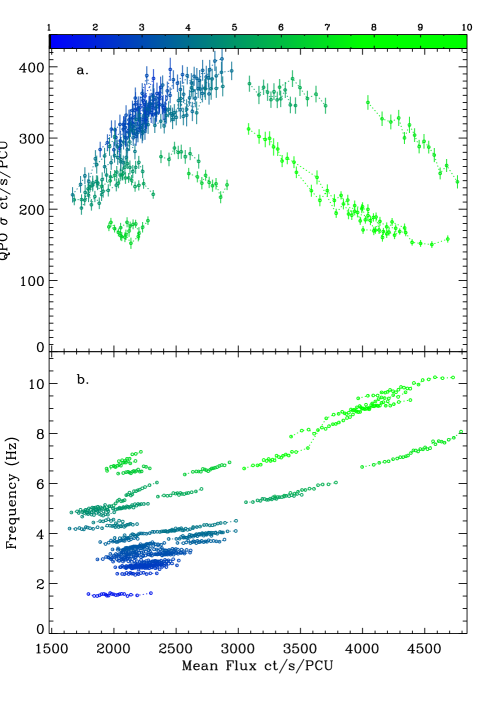
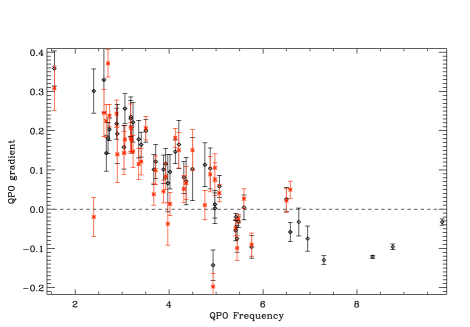
Fig. 1 shows the dependence of the QPO amplitude (rms) and frequency on flux (count rate) both within and between observations (typically one day apart). Clearly the QPO frequency is varying on short timescales and is well correlated with the flux as mentioned previously by Rao et al. (2010), Sobczak et al. (2000b) and Remillard et al. (2002), the gradient of this relation appears to increase with average frequency. The rms shows a more complex relation with the flux: when the QPO is below 4 Hz it follows the positive linear rms-flux relation observed in the broad-band noise, between 4.0-5.5 Hz the rms becomes constant with flux, above 5.5 Hz the rms-flux relation is negative. This is the first time a short-term negative rms-flux relation has been observed. The average QPO frequency for an observation is not monotonically related to either the mean rms or flux over long timescales, even though clear relationships between these variables are found within each observation (see Figure 1). This illustrates the different effects of the long term evolution of the system vs. short term random variations in the accretion flow.
Fitting the rms-flux relations for each observation with a linear function gives a reasonable measure of the gradient () which is clearly anti-correlated with the average QPO frequency ( as seen in Figure 2. The point where the gradient reverses from positive to negative occurs around 5.5 Hz. The gradient of the rms-flux relation for the harmonic, , changes simultaneously with that of the fundamental, . Figure 2 shows becomes negative when does, i.e. around Hz (where Hz) (Figure 2, red points). We have been unable to asses the flux dependence of the high frequency power spectral continuum due to uncertainties in subtracting the power of the QPO and harmonics.
5 Discussion
5.1 Summary
We have shown that the rms amplitude () and peak frequency () of the “type C” QPO of the microquasar XTE J1550-564 (observed during the 1998 outburst) both vary strongly on short timescales ( s) and are correlated with the source flux. The rms-flux relation for the QPO depends on the peak frequency of the QPO: when Hz there is a positive, linear correlation between the QPO rms and flux, at around Hz the rms-flux relation becomes flat (rms independent of flux), and at higher frequencies the rms and flux becomes negatively correlated. For all values of examined ( Hz) the rms-flux relation is approximately linear, and the gradient itself appears to be monotonically related to the QPO peak frequency. Above Hz also increases with flux in an approximately linear manner, below this point it remains constant. The correlations between the flux and the QPO rms and peak frequency on these short timescales are distinct from the long term evolution of the QPO during the outburst that is apparent between observations separated typically by day.
Within the framework of the “propagating fluctuation” model discussed in the Introduction, it is reasonable to imagine the QPOs as an enhancement in the variability amplitude at certain frequencies (radii) but still coupled to the broad-band spectrum of variations. This would naturally lead to a linear, positive correlation between long term flux (driven by variations at frequencies lower than the QPO) and QPO rms amplitude. It is less obvious what causes the frequency-dependent changes in the rms-flux behaviour of the QPO. We explore some possibilities and implications below.
5.2 The effect of a Frequency Dependent Filter
Using these observations Sobczak et al. (2000b) showed that on long timescales the fractional rms of the QPO rises with frequency until around 3 Hz, above this it falls off steeply (see their figure 6). Pottschmidt et al. (2003) and Axelsson et al. (2005) showed that the broad Lorentzian components of the power spectrum of Cygnus X-1 also show a sharp drop in amplitude above 3-5 Hz (see figure 6 of Pottschmidt et al., 2003). Similar correlations between QPO amplitude and frequency have been observed in the BHBs H1743-322, GRO J1650-500, XTE J1655-40 and GRS 1915+105 (McClintock et al., 2009; Kalemci et al., 2006, 2003; Debnath et al., 2009; Muno et al., 1999).
One explanation for the attenuation of these components as they move to higher frequencies is in terms of a low pass filter acting to suppress variability above Hz (Done et al., 2007; Gierliński et al., 2008). Proposed physical mechanisms for the suppression of fast variations include the damping of accretion rate perturbations faster than the viscous timescale in the inner disc (Psaltis & Norman, 2000; Done et al., 2007) and scattering of emitted X-rays by an optically thick outflow created at high luminosity Titarchuk et al. (2007). Such a filter would affect the observed rms-flux behaviour for QPOs that move in frequency above Hz. Is the change in simply the result of a QPO frequency that increases with flux on short timescales, combined with the rms being more strongly suppressed (by the action of the filter) at higher frequencies and thus fluxes? In order to investigate this possibility we modelled the decay of the QPO (fractional) rms with frequency in terms of a doubly broken power law, and use this to “recover” the unfiltered QPO rms.
A doubly broken power law over 1.5-10 Hz, with indices of = -0.1, -0.5 and -1.7 and breaking at 3.4 Hz and 5.1 Hz respectively, can be used to describe the trend in the long term rms-frequency behaviour of the QPO. We note that this is likely an over-estimate of the effect of a filter, since it predicts filtering of the power spectrum by a power law with with index above Hz; the observed power spectrum is usually flatter. Assuming this function describes the filter it is possible to “correct” each data point in Figure 1 for the rms-reducing effect of the frequency-dependent filter.
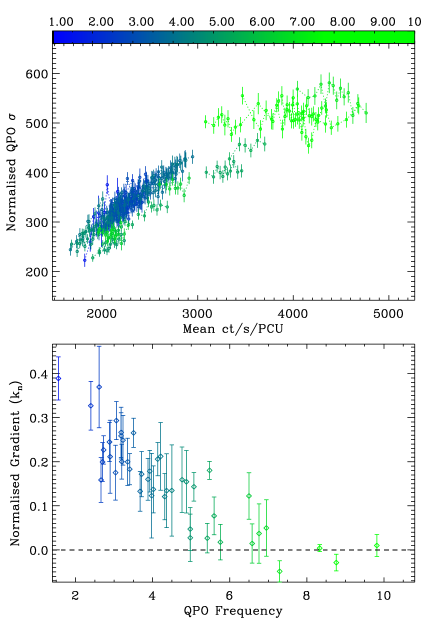
The rms-flux relations using the “filter-corrected” amplitudes are shown in Figure 3. There are two significant differences between this and the raw data shown in Figure 1a: at higher frequencies the rms-flux gradient tends to zero above Hz, rather than becoming negative, and the short timescale rms-flux data (within each observation) now follow a similar curve to the longer timescale (between observation) changes in rms and flux. Significantly for the present discussion, the rms-flux relation still shows a monotonic dependence of gradient on the QPO frequency. A flattening to zero gradient might indicate a ceiling on the QPO strength (in absolute units) which effectively prevents the rms increasing past ct s-1 when Hz.
5.3 Physical implications of QPO behaviour
Although we still lack a complete physical picture for the origin of QPOs (see e.g. van der Klis, 2006), recently proposed ideas include Lense-Thirring precession of an extended, hot flow (see e.g. Ingram et al., 2009) and a magnetohydrodynamic dynamo cycle (O’Neill et al., 2010). However, it is not clear what, if any, predictions such models make for the rms-flux relation of the QPO. One would hope that as these and similar models are developed and explored they will yield specific predictions about the coupling of QPO amplitude and the lower frequency noise variations that can then be compared against the observed behaviour.
We have shown there is a clear change in the flux-dependence of the QPO that is itself linked to the QPO frequency, and that peak frequencies of Hz appear to stand out as marking where the rms-flux gradient becomes zero. (This seems quite robust to the possible effects of a frequency-dependent filter.) This frequency range is already noteworthy as the location of the type B QPOs in this outburst and others. Given this coincidence it seems reasonable to speculate that 5-6 Hz may represent a relatively stable characteristic frequency of the system (in contrast to the variable peak frequency of type C QPOs). Replication of these results for other sources and outbursts is necessary to establish whether a fixed characteristic frequency can be identified in this way.
5.4 Correlations with the energy spectra
It is well known that the properties of the type C QPOs in BHB outbursts (notably ) are strongly correlated with the various energy spectral parameters over long timescales, i.e. between observations (see e.g. Sobczak et al., 2000b; Remillard et al., 2002; Rao et al., 2010, for discussion of the 1998 outburst of XTE J1550-564). Using the spectral parameters obtained by both Sobczak et al. (2000a) and Dunn et al. (2010) we find strong correlations between the energy spectrum (e.g. power law index, disc flux, etc.) and the gradient of the rms-flux relation for the QPO, as would be expected given that all these variables are strongly correlated with . At the present time the physical basis of these relations remains unclear.
Dunn et al. (2010) noted that this outburst of XTE J1550-564 is unusual in that it reaches a particularly high intermediate state, at the peak of the outburst they find that the luminosity is close to LEdd. It is during these high flux observations, where the QPO reaches its highest frequency, that the loss in positive correlation between rms and flux is most clearly seen. Further investigations into the effect of high luminosities, and their associated states, on the short-timescale behaviour of low frequency QPOs in other outbursts and sources would be necessary to fully understand any link.
acknowledgements
LMH acknowledges support from an STFC studentship. PU is supported by an STFC Advanced Fellowship, and funding from the European Community’s Seventh Framework Programme (FP7/2007-2013) under grant agreement number ITN 215215 ”Black Hole Universe”. This research has made use of data obtained from the High Energy Astrophysics Science Archive Research Center (HEASARC), provided by NASA’s Goddard Space Flight Center. We would like to thank the reviewer for their helpful comments and suggestions.
References
- Arévalo & Uttley (2006) Arévalo P., Uttley P., 2006, MNRAS, 367, 801
- Arnaud (1996) Arnaud K. A., 1996, in Astronomical Society of the Pacific Conference Series, Vol. 101, Astronomical Data Analysis Software and Systems V, G. H. Jacoby & J. Barnes, ed., pp. 17–+
- Axelsson et al. (2005) Axelsson M., Borgonovo L., Larsson S., 2005, A&A, 438, 999
- Belloni et al. (2005) Belloni T., Homan J., Casella P., van der Klis M., Nespoli E., Lewin W. H. G., Miller J. M., Méndez M., 2005, A&A, 440, 207
- Belloni et al. (2002) Belloni T., Psaltis D., van der Klis M., 2002, ApJ, 572, 392
- Belloni (2010) Belloni T. M., 2010, in Lecture Notes in Physics, Berlin Springer Verlag, Vol. 794, Lecture Notes in Physics, Berlin Springer Verlag, T. Belloni, ed., pp. 53–+
- Casella et al. (2004) Casella P., Belloni T., Homan J., Stella L., 2004, A&A, 426, 587
- Casella et al. (2005) Casella P., Belloni T., Stella L., 2005, ApJ, 629, 403
- Chakrabarti et al. (2009) Chakrabarti S. K., Dutta B. G., Pal P. S., 2009, MNRAS, 394, 1463
- Cui et al. (1999) Cui W., Zhang S. N., Chen W., Morgan E. H., 1999, ApJ, 512, L43
- Debnath et al. (2009) Debnath D., Chakrabarti S. K., Nandi A., Mandal S., 2009, ArXiv e-prints
- Done et al. (2007) Done C., Gierliński M., Kubota A., 2007, A&A Rev., 15, 1
- Dunn et al. (2010) Dunn R. J. H., Fender R. P., Körding E. G., Belloni T., Cabanac C., 2010, MNRAS, 403, 61
- Gaskell (2004) Gaskell C. M., 2004, ApJ, 612, L21
- Gierliński et al. (2008) Gierliński M., Nikołajuk M., Czerny B., 2008, MNRAS, 383, 741
- Gleissner et al. (2004) Gleissner T., Wilms J., Pottschmidt K., Uttley P., Nowak M. A., Staubert R., 2004, A&A, 414, 1091
- Heil & Vaughan (2010) Heil L. M., Vaughan S., 2010, MNRAS, 405, L86
- Homan et al. (2001) Homan J., Wijnands R., van der Klis M., Belloni T., van Paradijs J., Klein-Wolt M., Fender R., Méndez M., 2001, ApJS, 132, 377
- Ingram et al. (2009) Ingram A., Done C., Fragile P. C., 2009, MNRAS, 397, L101
- Kalemci et al. (2006) Kalemci E., Tomsick J. A., Rothschild R. E., Pottschmidt K., Corbel S., Kaaret P., 2006, ApJ, 639, 340
- Kalemci et al. (2003) Kalemci E., Tomsick J. A., Rothschild R. E., Pottschmidt K., Corbel S., Wijnands R., Miller J. M., Kaaret P., 2003, ApJ, 586, 419
- King et al. (2004) King A. R., Pringle J. E., West R. G., Livio M., 2004, MNRAS, 348, 111
- Klein-Wolt & van der Klis (2008) Klein-Wolt M., van der Klis M., 2008, ApJ, 675, 1407
- Lyubarskii (1997) Lyubarskii Y. E., 1997, MNRAS, 292, 679
- McClintock & Remillard (2006) McClintock J. E., Remillard R. A., 2006, Black hole binaries, Lewin, W. H. G. & van der Klis, M., ed., Cambridge University Press, pp. 157–213
- McClintock et al. (2009) McClintock J. E., Remillard R. A., Rupen M. P., Torres M. A. P., Steeghs D., Levine A. M., Orosz J. A., 2009, ApJ, 698, 1398
- Muñoz-Darias et al. (2010) Muñoz-Darias T., Motta S., Belloni T. M., 2010, MNRAS, 1553
- Muno et al. (1999) Muno M. P., Morgan E. H., Remillard R. A., 1999, ApJ, 527, 321
- O’Neill et al. (2010) O’Neill S. M., Reynolds C. S., Miller M. C., Sorathia K. A., 2010, ArXiv e-prints
- Pottschmidt et al. (2003) Pottschmidt K., Wilms J., Nowak M. A., Pooley G. G., Gleissner T., Heindl W. A., Smith D. M., Remillard R., Staubert R., 2003, A&A, 407, 1039
- Psaltis & Norman (2000) Psaltis D., Norman C., 2000, ArXiv Astrophysics e-prints
- Rao et al. (2010) Rao F., Belloni T., Stella L., Zhang S. N., Li T., 2010, ApJ, 714, 1065
- Reilly et al. (2001) Reilly K. T., Bloom E. D., Focke W., Giebels B., Godfrey G., Saz Parkinson P. M., Shabad a. G., Ray P. S., Bandyopadhyay R. M., Wood K. S., Wolff M. T., Fritz G. G., Hertz P., Kowalski M. P., Lovellette M. N., Yentis a. D. J., Scargle a. D., 2001, ApJ, 561, L183
- Remillard et al. (2002) Remillard R. A., Sobczak G. J., Muno M. P., McClintock J. E., 2002, ApJ, 564, 962
- Sobczak et al. (2000a) Sobczak G. J., McClintock J. E., Remillard R. A., Cui W., Levine A. M., Morgan E. H., Orosz J. A., Bailyn C. D., 2000a, ApJ, 544, 993
- Sobczak et al. (2000b) —, 2000b, ApJ, 531, 537
- Titarchuk et al. (2007) Titarchuk L., Shaposhnikov N., Arefiev V., 2007, ApJ, 660, 556
- Uttley (2004) Uttley P., 2004, MNRAS, 347, L61
- Uttley & McHardy (2001) Uttley P., McHardy I. M., 2001, MNRAS, 323, L26
- Uttley et al. (2005) Uttley P., McHardy I. M., Vaughan S., 2005, MNRAS, 359, 345
- van der Klis (2006) van der Klis M., 2006, Rapid X-ray Variability, Lewin, W. H. G. & van der Klis, M., ed., Cambridge University Press, pp. 39–112
- Vaughan et al. (2003) Vaughan S., Edelson R., Warwick R. S., Uttley P., 2003, MNRAS, 345, 1271
- Wijnands et al. (1999) Wijnands R., Homan J., van der Klis M., 1999, ApJ, 526, L33