Galaxy groups and clouds in the Local () universe
Abstract
We present an all-sky catalogue of 395 nearby galaxy groups revealed in the Local Supercluster and its surroundings. The groups and their associations are identified among 10914 galaxies at with radial velocities km s-1. Our group finding algorithm requires the group members to be located inside their zero-velocity surface. Hereby, we assume that individual galaxy masses are proportional to their total -band luminosities, .
The sample of our groups, where each group has members, is characterized by the following medians: mean projected radius kpc, radial velocity dispersion km s-1, -band luminosity , virial and projected masses and , respectively. Accounting for measurement error reduces the median masses by 30 per cent. For 97 per cent of identified groups the crossing time does not exceed the cosmic time, 13.7 Gyr, having the median at 3.8 Gyr.
We examine different properties of the groups, in particular, of the known nearby groups and clusters in Virgo and Fornax. About a quarter of our groups can be classified as fossil groups where the dominant galaxy is at least ten times brighter than the other group members.
In total, our algorithm identifies 54 per cent of galaxies to be members of groups. Together with triple systems and pairs they gather 82 per cent of the -band light in Local universe. We have obtained the local value of matter density to be within a distance of Mpc assuming km s-1 Mpc-1. It is significantly smaller than the cosmic value, 0.28, in the standard CDM model. The discrepancy between the global and local quantities of may be caused by the existence of Dark Matter component unrelated to the virial masses of galaxy systems.
keywords:
catalogues – galaxies: groups: general – cosmological parameters1 Introduction
As the observational data show, the bulk of galaxies inhabit the groups with a number of members from two to a hundred or more. Our Galaxy and its companions are no exception, forming a group with the population . The main features of the Local Group and other closest (and therefore the most studied) groups were examined by Karachentsev (2005). Due to their abundance, the groups of galaxies make a main contribution to the average density of matter in the universe. However, according to Karachentsev (2005), this contribution in the Local Volume with the radius of 10 Mpc around us amounts to just in the units of critical density, what is significantly lower than the global cosmic value (Fukugita & Peebles, 2004; Spergel et al., 2007) with the Hubble constant km s-1 Mpc-1. Such a difference may be due to the smallness of the Local Volume, where the statistics of groups is insufficient or does not cover all the variety of groups according to their morphological population and structure. Therefore it is essential to determine the mean local density of matter in larger volume where statistical fluctuations do not introduce significant uncertainty. Despite of 15 per cent variance of density on scale of 80 Mpc (Pápai & Szapudi, 2010), this volume is big enough to be considered as fair approximation to mean properties of the Universe.
New mass surveys of galaxy redshifts: 2dF (Colless et al., 2001), HIPASS (Barnes et al., 2001), 6dF (Jones et al., 2004), ALFALFA (Giovanelli et al., 2005), SDSS (Abazajian et al., 2009) present extensive opportunities for finding the groups of galaxies with a particular algorithm. However, the surveys of the sky in the selected regions up to high redshifts appear to be insufficient for the analysis of small-scale clustering due to the loss of a great number of low-luminosity dwarf galaxies in the distant volumes. For example, in the Sloan Digital Sky Survey (SDSS), covering a quarter of the sky, the average distance between the galaxies with measured radial velocities is 9 Mpc, what is an order of magnitude larger than the diameter of a typical galaxy group. For a comparison, note that in the well-studied Local Volume the density of galaxies with measured velocities is two orders of magnitude higher than in the SDSS. Therefore, a sensible strategy in the study of galaxy groups would be to create a representative catalogue of nearby systems over the entire sky within the radius .
Successful attempts to create a catalogue of nearby groups were made by Vennik (1984, 1987); Tully (1987, 1988); Magtesyan (1988), who used the method of a ‘hierarchical tree’ proposed by Materne (1978, 1979). Tully’s catalogue and atlas of galaxy groups has 179 pairs and groups, selected among 2367 galaxies with the radial velocities of less than 3000 km s-1. About 2/3 of the 2367 galaxies in the above catalogue appeared to be the members of multiple systems. Based on the virial mass estimates for these groups, Tully determined the lower limit of the mean density in the studied volume as . Similar estimates, and 0.05, were obtained by Vennik (1987) and Magtesyan (1988), respectively. However, other authors, Huchra & Geller (1982); Maia et al. (1989), who used the percolation method (the so-called ‘friend of friend’ method) to isolate the groups, obtained 3–5 times higher estimates of .
Over the past 20 years the number of galaxies in the volume of the Local Supercluster and its environs with radial velocities relative to the centroid of the Local Group km s-1 has grown by more than 4 times. The updates of the observational database on the radial velocities, and appearance of a homogeneous across the sky 2MASS near-infrared photometric survey (Jarrett et al., 2003, 2000) enables us to study the structure and kinematics of nearby galaxy groups with significantly greater detail.
This work is a continuation of a series of papers addressing the properties of binary (Karachentsev & Makarov, 2008) and triple (Makarov & Karachentsev, 2009) systems of galaxies, detected with one and the same algorithm, applied to the same set of the observational data. These catalogues contain, respectively, 509 binary systems and 168 triplets of galaxies. In addition to these, we have compiled a catalogue of 513 isolated galaxies, which are the most isolated objects in the studied volume km s-1 (Karachentsev et al., 2009). In this paper we present a catalogue of 395 multiple systems with the populations of four or more members, and discuss the basic properties of these groups.
2 Observational data
We use the HyperLEDA111http://leda.univ-lyon1.fr (Paturel et al., 2003) and the NED222http://nedwww.ipac.caltech.edu databases as main sources of data on radial velocities, apparent magnitudes, morphological types and other parameters of galaxies. It must be emphasized that their use requires a critical approach. Both these databases contain a significant amount of ‘spam’. Quite common case is a misidentification of objects due to misprints or imprecise coordinates. Without diminishing the importance of mass surveys like 6dF and others, it is necessary to note they produce significant number of erroneous radial velocities. Apparent magnitudes and radial velocities from the SDSS survey often correspond to individual knots and associations in bright galaxies. It is only tip of the iceberg of different sources of pollution of the databases. We have taken into account and corrected, where possible, these cases, especially significant for selection of tight galaxy systems. As a matter of fact it is most hard and time-consuming part of our work. Because the databases are constantly updated and new invalid data emerge, therefore the error correction is iterative task. Additionally, we made a number of optical identifications of sources from the HIPASS survey, specifying their coordinates and determining the apparent magnitudes and morphological types of galaxies (Karachentsev et al., 2008). Many dwarf galaxies, especially of low surface brightness, were examined by us on the DSS digital images to determine their main characteristics. A typical error of our visual estimation of a galaxy’s apparent magnitude is , and the mean error its type determination is about in the digital scale used by de Vaucouleurs et al. (1976) in the RC2 catalogue.
As it is known, the best indicator of stellar mass of a galaxy is it’s near-infrared luminosity. The stellar mass dominates the baryon mass in most, but not all, galaxies. The near-infrared flux is weakly affected by a dust and young blue star complexes in the galaxy. For this reason, we have taken photometry in -band at as our photometric basis. Most of these data come from the all-sky 2MASS survey (Jarrett et al., 2003, 2000). In case of lack the -band photometry we transferred the optical () and near-infrared () magnitudes of galaxies into the -magnitudes using synthetic colours of galaxies from Buzzoni (2005) and Fukugita et al. (1995). The greatest amount of photometric data for galaxies falls on the -band. Based on the relations between the colour index and the morphological type, discussed by Jarrett et al. (2003), and Karachentsev & Kutkin (2005), we used the following transformations for the mean colour index:
| (1) | |||||
Note that owing to short exposures the 2MASS survey turned out to be insensitive to the galaxies with low surface brightness and blue colour. For about a thousand dwarf irregular and spheroidal galaxies, detected recently by Karachentseva & Karachentsev (1998, 2000) in the Local Supercluster volume, there are only eye estimate of -magnitudes, which converted into -magnitudes using the recipe described above. Despite the lack of good photometry for them, gas-rich dIrr galaxies have high-precision radial velocities from the 21-cm line measurements and hence they are important ‘test particles’ to trace the gravitational well of group of galaxies. The need to convert -magnitudes to -band for about 35 per cent of galaxies adds a considerable uncertainty to the mass estimates of that objects, but because we apply it mainly for dwarf galaxies which are not dominate in the total luminosity this transformation can not change significantly properties of the groups.
We gathered all the available in the HyperLEDA and NED measurements of radial velocities of the galaxies in the Local Supercluster and its neighbourhood. Unreliable and inaccurate measurements, namely, where the velocity measurement error was greater than 75 km s-1, were excluded. In the data of the SDSS, 2dF and 6dF surveys we analysed and removed the measurements with the velocities of km s-1, if they were the cases of a Milky Way star projecting onto a distant galaxy. When a galaxy had several measurements of its radial velocity, we chose the median value, and the velocity error was estimated as a variance of all the good measurements.
It is necessary to note that Local Group with all its known members was excluded from calculation because the algorithm does not use information on real distances and uses only radial velocities for clusterization. It makes impossible to estimate the properties of galaxies in the Local Group that introduces a mess with membership in the Local Volume.
Our original sample, cleaned from doubtful cases, contains in total 10914 galaxies with radial velocities in the Local Group rest frame of km s-1, located at the galactic latitudes . For all these galaxies we fixed their apparent magnitudes and morphological types. To avoid influence of the boundaries on properties of groups we also used in our calculations the data on the galaxies located in the boundary regions with and with km s-1, as some individual members of groups with large virial velocities could appear there. The sampling of such a depth contains the entire Local Supercluster with its distant outskirts, surrounding voids and ridges of the neighbouring clusters.
3 The group finding algorithm
Various algorithms were proposed to identify the groups of galaxies in samples, limited by apparent magnitudes or galaxy distances. However, they can be reduced to two basic ones: the percolation method (‘friend of friend’) and the taxonometric method (construction of a hierarchical tree).
Using the percolation technique, Huchra & Geller (1982) combined the galaxies in groups on the condition that their projected mutual linear separations and radial velocity differences were smaller than some threshold values and . At Mpc and km s-1 they have grouped in the CfA redshift survey about 74 per cent of the galaxies, and obtained the groups with a characteristic radius of Mpc, radial velocity dispersion km s-1, and mean virial mass . This method was applied by many authors to different samples of galaxies. The disadvantage of this method is the arbitrariness of choice of two percolation parameters and , a variation of which strongly affects the characteristic size and mass of groups, as well as the fraction of galaxies belonging to the groups. Tracking some mean contrast of the galaxy number density by the and parameters, the percolation criterion overlooks many real groups in the regions of low density, and finds large non-virialized aggregates in the regions of overdensity. Another shortcoming of the ‘friend of friend’ method manifests itself in a strong dependence of the group parameters on the group distance from the observer. Various attempts to reduce this dependence by introducing the variables and were accompanied by additional arbitrary assumptions. Recently, Crook et al. (2007) applied the percolation method to the 2MASS survey of galaxies, and identified 1710 pairs and 1258 groups of galaxies at the relative density contrast . In this sample, the members of groups and pairs make up, respectively, 36 per cent and 17 per cent. The groups by Crook et al. (2007) with the number of members have a characteristic projection radius of about 1 Mpc, the dispersion of radial velocities of km s-1 and the mean virial mass . Taken the depth of the considered 2MASS sample Mpc, the contribution of virial masses of these groups in the mean density of matter is .
Following another, ‘taxonometric’ method, Vennik (1984); Tully (1988) combined galaxy pairs by the maximum ratio of their luminosity to the cube of mutual distance (). Then such a pair was replaced by a ‘particle’ with the total luminosity, and the process of finding a case with repeated. The process was completed by creation of a single ‘hierarchical tree’ whose branches united the entire considered sample of galaxies. Clipping the tree branches on some contrast level of the volume luminosity yielded a set of branches-groups, the sizes and virial masses of which were dependent on the selected density (luminosity) contrast. Applying the dendrogram method, both authors obtained a characteristic projection radius of the group of 0.3 Mpc, the mean radial velocity dispersion km s-1, and the virial mass to blue luminosity ratio .
The both percolation and dendrogram methods ignore the individual properties of galaxies, considering them as indistinguishable particles. But it is obvious that the same thresholds and may be sufficient for clustering a pair of dwarf galaxies, but they are apparently not sufficient to bind a pair of giant galaxies. This inadequacy of the algorithm leads to a systematic distortion of the virial mass estimates.
Combining the galaxies into the systems of different multiplicity should be done taking into account the individual properties of galaxies. Considering two arbitrary galaxies as a virtual bound pair, we assume (Karachentsev, 1994; Makarov & Karachentsev, 2000) that the spatial velocity difference for the galaxies in a physical pair and their spatial separation must satisfy the condition of negative total energy
| (2) |
where is the total mass of the pair, and is the gravitational constant. However, from the observations we only know the velocity difference projected on the line of sight , and the separation projected onto the image plane . Two galaxies with a very small difference in radial velocities but a large separation in the sky can satisfy the condition (2) without being mutually bound. Hence the condition of negative total energy of the pair, expressed in terms of the observables
| (3) |
must be supplemented by another restriction on the maximal distance between the components at their fixed mass . The condition when the pair components remain within the sphere of ‘zero-velocity’ (Sandage, 1986) takes the form of
| (4) |
where is the Hubble constant.
Our algorithm for galaxy grouping is in fact a variant of the percolation method. Firstly, we select all the pairs satisfying the conditions (3) and (4). Then all the pairs with common main component are combined in a group. If a galaxy turned out to be a companion of several massive galaxies at once, we join it with the most massive neighbour. In a particular case, one group may be a subgroup within a more extended system. In this sense, our algorithm combines the properties of both the ‘friend of friend’ method, and the hierarchical approach. On next stage, we replace the galaxies in the group by fake object with summarized luminosity of all its members and with mean redshift. After that we repeat all the steps from the beginning while some object obeys to bound criteria. Although, the algorithm is based on pairwise criterion on final step the bound condition is determined by the entire group.
We determined the masses of galaxies from their integral luminosity in the near-infrared -band, supposing that they have the same mass-to-luminosity ratio
| (5) |
where is taken equal to 6. In the fact, the value of is only more or less arbitrary dimensionless parameter of the algorithm. To bound it we ‘trained’ the clusterization algorithm (3–5) on detailed three-dimensional distribution of galaxies in the Local Volume, where the membership of galaxies in the groups is known from good quality photometric distances. Karachentsev (2005) lists the members of several nearby groups like Cen A and M 81. Unfortunately, as it was noted in previous section, we can not test the algorithm on Local Group, thus we used other nearby groups in the Local Volume. The choice of is the compromise between a loss of the real members and an impurity of groups by false members. For the we lose significant number of real members while leads to appearance in the groups suspicious members. Moreover, for galaxies are combined into extended non-virialized aggregates. At the given value of the dwarf companions in the well-known nearby groups are usually located inside the zero velocity surface around the major galaxies of these groups.
4 The catalogue of groups
The criteria (3–5) of unifying the galaxies in groups with the parameter was used for 10914 galaxies with radial velocities km s-1, located outside the Milky Way zone, . This led to an identification of 395 groups with the population of members. In total, these groups include 4381 galaxies. Together with 1018 components of binary systems (Karachentsev & Makarov, 2008) and 504 components of triplets (Makarov & Karachentsev, 2009) in the same volume, the total number of clustered galaxies is 5903 or 54 per cent of the total number considered.
The catalogue of galaxy groups as the final result of successive iterations of the use of conditions (3–5) is presented in a short and full version. Table 1 is a compact version of the catalogue, containing the basic group characteristics listed in one row. The full version of the catalogue with the indication of all the individual members of each group is available in the electronic form at http://www.sao.ru/hq/dim/groups.
The columns of Table 1 contain the following data:
1) principal name of the group’s brightest galaxy, taken, as a rule, from the LEDA;
2) equatorial coordinates of the group’s main member at the epoch (J2000.0);
3) the number of group members with known radial velocities;
4) mean radial velocity of the group in km s-1 relative to the centroid of the Local Group;
5) the standard deviation of radial velocities of the group members (km s-1) not corrected for the velocity measurement errors;
6) mean harmonic radius of the group (kpc); at its computation the distance to the group was determined from the mean radial velocity with the Hubble parameter km s-1 Mpc-1;
7) logarithm of the total luminosity of the group in the photometric -band given in the unit of solar luminosity at (Binney & Merrifield, 1998);
8) logarithm of the projected mass of the group, as defined by (Heisler et al., 1985, equation 11)
where and are radial velocity and projected distance of the th galaxy relative to the centre of the system. It should be noted that this value is statistically biased. To obtain an unbiased mass estimate the square of velocity, , has to be corrected for measurement error, . In case of large errors, , the unbiased value of the group mass, , attains a negative value;
9) the projected mass-to-total luminosity ratio in the -band in solar units;
10) morphological type of the group’s main member according to the RC2 classification (de Vaucouleurs et al., 1976);
11) difference in apparent -magnitudes of the first and second members of the group, ranked by -luminosity;
12) group’s membership in an association (cloud, clan), which is identified at a higher value of the dimensionless parameter adopted to be ; here the name of the association was given by the name of the group that is dominant in it; as it is evident from these data, a significant number of groups are isolated entities not associated with other neighbouring groups.
| Group | J2000.0 | N | T | Association | |||||||
|---|---|---|---|---|---|---|---|---|---|---|---|
| NGC7814 | 000314.9160844 | 4 | 1283 | 34 | 262 | 10.98 | 12.16 | 1.18 | 5.27 | NGC7814 | |
| ESO293–034 | 000619.9412960 | 5 | 1435 | 59 | 41 | 10.18 | 11.87 | 1.69 | 3.14 | ESO293–034 | |
| NGC0055 | 001453.6391148 | 4 | 111 | 26 | 123 | 9.46 | 11.37 | 1.91 | 0.13 | NGC0055 | |
| NGC0092 | 002131.7483729 | 5 | 3302 | 101 | 40 | 11.08 | 12.49 | 1.41 | 1.16 | NGC0092 | |
| NGC0134 | 003022.0331439 | 4 | 1629 | 121 | 159 | 11.29 | 12.54 | 1.25 | 3.64 | NGC0134 | |
| NGC0253 | 004733.1251718 | 6 | 374 | 87 | 275 | 11.24 | 12.87 | 1.63 | 3.66 | NGC0253 | |
| NGC0289 | 005242.4311221 | 8 | 1618 | 81 | 205 | 11.01 | 12.77 | 1.76 | 0.73 | NGC0134 | |
| IC0065 | 010055.4474055 | 4 | 2930 | 77 | 142 | 10.95 | 12.50 | 1.55 | 0.71 | IC0065 | |
| NGC0428 | 011255.7005854 | 4 | 1289 | 16 | 117 | 10.07 | 10.96 | 0.89 | 4.26 | NGC0428 | |
| NGC0488 | 012146.9051524 | 17 | 2368 | 85 | 200 | 11.83 | 13.16 | 1.33 | 1.03 | NGC0488 | |
| NGC0524 | 012447.7093220 | 16 | 2581 | 147 | 391 | 11.79 | 13.16 | 1.37 | 1.67 | NGC0488 | |
| NGC0584 | 013120.8065205 | 11 | 1945 | 63 | 335 | 11.63 | 12.85 | 1.22 | 0.67 | NGC0584 | |
| NGC0628 | 013641.8154700 | 6 | 831 | 46 | 171 | 10.71 | 12.18 | 1.47 | 4.96 | NGC0628 | |
| NGC0660 | 014302.4133842 | 5 | 955 | 29 | 235 | 10.64 | 10.96 | 0.32 | 4.48 | NGC0628 | |
| NGC0672 | 014754.5272558 | 5 | 564 | 41 | 74 | 9.78 | 11.39 | 1.61 | 1.78 | NGC0672 | |
| NGC0681 | 014910.8102535 | 7 | 1889 | 140 | 212 | 10.94 | 12.89 | 1.95 | 0.52 | NGC0720 | |
| NGC0697 | 015117.6222129 | 10 | 3080 | 128 | 260 | 11.75 | 13.17 | 1.42 | 0.21 | NGC0697 | |
| NGC0720 | 015300.5134419 | 6 | 1758 | 145 | 352 | 11.20 | 13.07 | 1.87 | 4.16 | NGC0720 | |
| NGC0772 | 015919.6190027 | 6 | 2565 | 56 | 258 | 11.57 | 12.45 | 0.88 | 3.08 | NGC0772 | |
| IC0210 | 020928.2094048 | 8 | 1975 | 47 | 157 | 10.65 | 12.27 | 1.62 | 1.18 | IC0210 | |
| NGC0864 | 021527.6060009 | 4 | 1677 | 25 | 195 | 10.65 | 11.93 | 1.28 | 3.84 | NGC0864 | |
| IC1788 | 021550.0311204 | 4 | 3455 | 31 | 512 | 11.22 | 11.83 | 0.61 | 0.25 | IC1788 | |
| NGC0891 | 022233.4422057 | 18 | 775 | 60 | 197 | 11.30 | 12.64 | 1.34 | 0.30 | NGC0891 | |
| NGC0908 | 022304.6211402 | 9 | 1585 | 60 | 228 | 11.18 | 12.14 | 0.96 | 3.01 | NGC0908 | |
| NGC0936 | 022737.5010923 | 12 | 1592 | 129 | 336 | 11.33 | 12.95 | 1.62 | 1.84 | NGC1068 | |
| NGC0988 | 023527.8092122 | 22 | 1437 | 103 | 379 | 11.55 | 12.98 | 1.43 | 0.45 | NGC1068 | |
| NGC1032 | 023923.7010538 | 5 | 2750 | 37 | 429 | 11.14 | 12.37 | 1.23 | 4.06 | NGC1068 | |
| NGC1068 | 024240.7000048 | 11 | 1160 | 80 | 387 | 11.54 | 12.79 | 1.25 | 1.36 | NGC1068 | |
| NGC1097 | 024618.0301512 | 4 | 1189 | 140 | 43 | 11.26 | 12.53 | 1.27 | 4.26 | NGC1316 | |
| NGC1153 | 025809.6032133 | 4 | 3167 | 66 | 311 | 11.08 | 12.73 | 1.65 | 0.31 | NGC1153 | |
| NGC1187 | 030237.6225202 | 4 | 1315 | 48 | 106 | 10.60 | 11.90 | 1.30 | 4.74 | NGC1316 | |
| NGC1209 | 030603.0153641 | 6 | 2597 | 144 | 95 | 11.40 | 13.13 | 1.73 | 0.23 | NGC1209 | |
| NGC1184 | 031645.0804736 | 4 | 2489 | 74 | 418 | 11.27 | 12.80 | 1.53 | 1.68 | NGC1184 | |
| NGC1302 | 031951.2260338 | 6 | 1663 | 47 | 383 | 11.15 | 12.30 | 1.15 | 0.55 | NGC1316 | |
| NGC1299 | 032009.7061543 | 5 | 2313 | 49 | 120 | 10.41 | 12.03 | 1.62 | 1.25 | NGC1248 | |
| NGC1316 | 032241.7371230 | 111 | 1411 | 244 | 454 | 12.30 | 13.94 | 1.64 | 0.72 | NGC1316 | |
| NGC1332 | 032617.3212007 | 22 | 1469 | 183 | 279 | 11.55 | 13.39 | 1.84 | 0.51 | NGC1316 | |
| NGC1386 | 033646.2355957 | 8 | 755 | 70 | 165 | 10.37 | 12.40 | 2.03 | 0.57 | NGC1316 | |
| NGC1395 | 033829.8230140 | 24 | 1548 | 121 | 378 | 11.53 | 13.05 | 1.52 | 1.40 | NGC1316 | |
| NGC1398 | 033852.1262016 | 10 | 1386 | 89 | 612 | 11.46 | 13.09 | 1.63 | 1.13 | NGC1316 | |
| NGC1407 | 034011.9183449 | 25 | 1713 | 167 | 385 | 11.61 | 13.32 | 1.71 | 1.96 | NGC1316 | |
| NGC1433 | 034201.6471319 | 14 | 946 | 76 | 340 | 11.07 | 12.84 | 1.77 | 0.60 | NGC1291 | |
| NGC1511 | 035939.8673820 | 4 | 1131 | 32 | 77 | 10.37 | 11.78 | 1.41 | 2.25 | NGC1553 | |
| NGC1512 | 040354.3432056 | 5 | 714 | 61 | 11 | 10.40 | 12.02 | 1.62 | 2.25 | NGC1291 | |
| NGC1519 | 040807.6171134 | 4 | 1781 | 26 | 238 | 10.29 | 11.57 | 1.28 | 0.56 | NGC1316 | |
| NGC1532 | 041204.3325227 | 10 | 1159 | 89 | 137 | 11.25 | 12.70 | 1.45 | 1.00 | NGC1316 | |
| NGC1553 | 041610.5554649 | 29 | 1022 | 185 | 62 | 11.79 | 13.56 | 1.77 | 0.50 | NGC1553 | |
| UGC02998 | 041634.3024533 | 5 | 3317 | 92 | 329 | 11.18 | 12.90 | 1.72 | 0.14 | NGC1550 | |
| NGC1665 | 044817.1052539 | 6 | 2669 | 48 | 380 | 11.17 | 12.52 | 1.35 | 0.17 | NGC1665 | |
| NGC1779 | 050518.1090850 | 4 | 3222 | 25 | 536 | 11.27 | 11.69 | 0.42 | 1.38 | NGC1723 | |
| NGC1808 | 050742.3373047 | 6 | 840 | 118 | 129 | 11.04 | 12.45 | 1.41 | 0.36 | NGC1808 | |
| MCG–02–14–003 | 051107.7092320 | 4 | 2518 | 56 | 72 | 10.50 | 12.35 | 1.85 | 0.79 | NGC1888 | |
| NGC1832 | 051203.3154116 | 6 | 1839 | 36 | 396 | 10.91 | 12.09 | 1.18 | 1.79 | NGC1832 | |
| NGC1947 | 052647.6634536 | 4 | 914 | 30 | 277 | 10.56 | 11.56 | 1.00 | 2.86 | NGC1553 | |
| NGC1964 | 053321.8215645 | 9 | 1532 | 83 | 385 | 11.07 | 12.89 | 1.82 | 1.33 | NGC1964 | |
| NGC1993 | 053525.6174855 | 4 | 3029 | 55 | 359 | 10.86 | 12.14 | 1.28 | 3.50 | NGC1993 | |
| NGC2089 | 054751.4173609 | 5 | 2818 | 45 | 600 | 11.22 | 12.49 | 1.27 | 0.88 | NGC2089 | |
| NGC2207 | 061622.0212222 | 5 | 2570 | 108 | 113 | 11.44 | 13.07 | 1.63 | 0.37 | NGC2207 | |
| ESO489–035 | 061859.5243749 | 4 | 2557 | 38 | 85 | 10.83 | 11.37 | 0.54 | 0.05 | NGC2207 | |
| NGC2217 | 062139.8271402 | 5 | 1559 | 82 | 253 | 11.20 | 12.41 | 1.21 | 2.21 | NGC2217 | |
| UGC03714 | 071232.7714502 | 4 | 3074 | 98 | 235 | 11.09 | 12.86 | 1.77 | 0.18 | UGC03714 | |
| ESO162–017 | 071554.5572037 | 4 | 837 | 32 | 97 | 9.57 | 11.30 | 1.73 | 1.86 | ESO162–017 | |
| NGC2369 | 071637.7622037 | 7 | 2924 | 58 | 211 | 11.64 | 12.61 | 0.97 | 0.47 | NGC2369 | |
| UGC03816 | 072312.4580353 | 5 | 3369 | 121 | 137 | 11.27 | 12.70 | 1.43 | 0.12 | UGC03816 |
| Group | J2000.0 | N | T | Association | |||||||
|---|---|---|---|---|---|---|---|---|---|---|---|
| NGC2300 | 073220.5854232 | 11 | 2100 | 85 | 409 | 11.45 | 12.86 | 1.41 | 1.49 | NGC2300 | |
| NGC2442 | 073623.8693151 | 12 | 1135 | 63 | 150 | 11.24 | 12.24 | 1.00 | 1.00 | NGC2442 | |
| NGC2565 | 081948.3220153 | 5 | 3467 | 51 | 113 | 11.15 | 12.26 | 1.11 | 0.49 | NGC2565 | |
| NGC2577 | 082243.5223311 | 4 | 2024 | 108 | 129 | 10.82 | 12.30 | 1.48 | 0.46 | NGC2577 | |
| NGC2551 | 082450.3732443 | 5 | 2436 | 51 | 301 | 10.78 | 12.09 | 1.31 | 1.03 | NGC2633 | |
| NGC2594 | 082717.2255244 | 4 | 2215 | 55 | 124 | 10.18 | 11.69 | 1.51 | 3.03 | NGC2592 | |
| NGC2604A | 083323.1293220 | 4 | 2013 | 25 | 8 | 9.85 | 10.98 | 1.13 | 2.04 | NGC2608 | |
| NGC2648 | 084239.8141708 | 4 | 1933 | 80 | 94 | 10.78 | 12.17 | 1.39 | 2.21 | NGC2648 | |
| NGC2633 | 084804.6740556 | 5 | 2331 | 94 | 62 | 11.03 | 12.95 | 1.92 | 0.30 | NGC2633 | |
| NGC2679 | 085132.9305155 | 4 | 1984 | 61 | 24 | 10.40 | 11.90 | 1.50 | 1.95 | NGC2679 | |
| NGC2681 | 085332.7511849 | 4 | 753 | 42 | 205 | 10.38 | 11.60 | 1.22 | 5.14 | NGC2841 | |
| NGC2698 | 085536.5031102 | 8 | 1673 | 106 | 94 | 11.11 | 12.78 | 1.67 | 0.01 | NGC2698 | |
| NGC2655 | 085537.7781323 | 8 | 1584 | 67 | 318 | 11.39 | 12.61 | 1.22 | 1.65 | NGC2655 | |
| NGC2712 | 085930.5445450 | 4 | 1887 | 41 | 428 | 10.51 | 12.08 | 1.57 | 4.51 | NGC2712 | |
| NGC2719 | 090015.5354340 | 4 | 3095 | 84 | 26 | 10.08 | 12.10 | 2.02 | 0.84 | NGC2719 | |
| NGC2738 | 090400.5215804 | 4 | 2979 | 46 | 108 | 10.73 | 11.58 | 0.85 | 0.01 | NGC2738 | |
| NGC2743 | 090454.0250015 | 4 | 2895 | 26 | 121 | 10.36 | 11.78 | 1.42 | 1.80 | NGC2750 | |
| NGC2750 | 090547.9252615 | 4 | 2640 | 170 | 44 | 10.91 | 13.47 | 2.56 | 0.14 | NGC2750 | |
| NGC2775 | 091020.1070217 | 9 | 1259 | 98 | 189 | 10.99 | 12.88 | 1.89 | 4.58 | NGC2775 | |
| NGC2768 | 091137.5600214 | 10 | 1416 | 126 | 315 | 11.28 | 13.09 | 1.81 | 1.46 | NGC2768 | |
| NGC2782 | 091405.1400649 | 4 | 2512 | 28 | 30 | 10.86 | 11.89 | 1.03 | 4.03 | NGC2782 | |
| NGC2798 | 091722.9415959 | 6 | 1707 | 73 | 75 | 10.51 | 11.88 | 1.37 | 2.12 | NGC2798 | |
| UGC04906 | 091739.9525935 | 6 | 2346 | 49 | 280 | 10.61 | 12.06 | 1.45 | 3.21 | UGC04906 | |
| NGC2855 | 092127.5115434 | 6 | 1652 | 35 | 216 | 10.87 | 11.91 | 1.04 | 3.77 | PGC025886 | |
| NGC2841 | 092202.6505836 | 6 | 640 | 74 | 233 | 10.78 | 12.61 | 1.83 | 5.31 | NGC2841 | |
| NGC2859 | 092418.6343048 | 8 | 1636 | 113 | 54 | 10.83 | 12.37 | 1.54 | 3.52 | NGC2859 | |
| NGC2872 | 092542.5112556 | 11 | 3204 | 216 | 147 | 11.43 | 13.21 | 1.78 | 0.11 | NGC2911 | |
| NGC2894 | 092930.2074308 | 6 | 1970 | 46 | 312 | 10.98 | 11.99 | 1.01 | 0.00 | NGC2894 | |
| NGC2904 | 093017.0302306 | 5 | 2227 | 74 | 111 | 10.93 | 12.06 | 1.13 | 0.33 | NGC2904 | |
| NGC2907 | 093136.7164405 | 4 | 1819 | 109 | 84 | 10.92 | 12.42 | 1.50 | 1.64 | NGC2811 | |
| NGC2903 | 093210.1213003 | 4 | 417 | 31 | 69 | 10.42 | 11.62 | 1.20 | 5.64 | NGC2903 | |
| NGC2911 | 093346.1100909 | 21 | 3069 | 144 | 311 | 11.45 | 13.20 | 1.75 | 0.86 | NGC2911 | |
| NGC2962 | 094053.9050957 | 8 | 1768 | 70 | 123 | 10.77 | 12.07 | 1.30 | 1.02 | NGC2962 | |
| NGC2967 | 094203.3002011 | 6 | 1652 | 68 | 320 | 10.63 | 12.63 | 2.00 | 1.22 | NGC2974 | |
| NGC2974 | 094233.3034157 | 5 | 1660 | 66 | 186 | 11.54 | 13.03 | 1.49 | 5.02 | NGC2974 | |
| NGC2950 | 094235.1585105 | 4 | 1425 | 44 | 137 | 10.75 | 12.33 | 1.58 | 4.26 | NGC2768 | |
| MCG+02–25–021 | 094253.4092940 | 7 | 3070 | 47 | 67 | 10.93 | 11.91 | 0.98 | 1.04 | NGC2911 | |
| NGC2964 | 094254.2315050 | 9 | 1491 | 91 | 206 | 11.07 | 12.80 | 1.73 | 0.08 | NGC2964 | |
| ESO434–028 | 094413.2285055 | 4 | 2228 | 19 | 417 | 10.77 | 11.58 | 0.81 | 0.92 | NGC3223 | |
| NGC2986 | 094416.0211641 | 7 | 2032 | 96 | 406 | 11.37 | 13.11 | 1.74 | 0.66 | NGC2986 | |
| NGC2997 | 094538.8311128 | 9 | 785 | 107 | 126 | 10.86 | 12.63 | 1.77 | 3.75 | NGC2997 | |
| NGC2992 | 094542.1141935 | 4 | 2094 | 59 | 52 | 10.90 | 11.54 | 0.64 | 1.54 | NGC2992 | |
| UGC05228 | 094603.7014006 | 4 | 1686 | 38 | 133 | 10.01 | 11.71 | 1.70 | 4.57 | NGC2974 | |
| NGC2990 | 094617.2054232 | 5 | 2898 | 60 | 22 | 10.62 | 12.20 | 1.58 | 1.13 | NGC2990 | |
| NGC3001 | 094618.7302615 | 4 | 2139 | 46 | 488 | 11.08 | 12.35 | 1.27 | 0.99 | NGC3223 | |
| CGCG063–066 | 094649.0094410 | 4 | 2867 | 14 | 191 | 10.09 | 10.86 | 0.77 | 3.17 | NGC2911 | |
| NGC3023 | 094952.6003705 | 6 | 1670 | 19 | 28 | 10.24 | 11.21 | 0.97 | 0.12 | NGC2974 | |
| NGC3031 | 095533.2690355 | 30 | 193 | 138 | 102 | 10.86 | 12.59 | 1.73 | 0.81 | NGC3031 | |
| NGC3078 | 095824.6265537 | 13 | 2149 | 105 | 569 | 11.59 | 13.16 | 1.57 | 0.46 | NGC3223 | |
| UGC05376 | 100027.1032228 | 4 | 1844 | 75 | 141 | 10.35 | 12.08 | 1.73 | 1.12 | UGC05376 | |
| NGC3100 | 100040.8313952 | 34 | 2420 | 142 | 738 | 12.08 | 13.57 | 1.49 | 0.04 | NGC3223 | |
| NGC3079 | 100157.8554047 | 7 | 1205 | 94 | 122 | 10.88 | 12.26 | 1.38 | 3.54 | NGC3079 | |
| NGC3115 | 100514.0074307 | 5 | 437 | 58 | 119 | 10.53 | 12.29 | 1.76 | 4.17 | NGC3115 | |
| NGC3145 | 101009.9122602 | 4 | 3283 | 62 | 13 | 11.22 | 11.38 | 0.16 | 2.84 | NGC3145 | |
| ESO436–001 | 101247.5275022 | 4 | 2198 | 71 | 306 | 10.63 | 12.29 | 1.66 | 0.29 | NGC3223 | |
| NGC3166 | 101345.8032530 | 10 | 1097 | 63 | 92 | 11.10 | 12.13 | 1.03 | 0.07 | NGC3166 | |
| NGC3175 | 101442.1285219 | 6 | 800 | 24 | 121 | 10.46 | 11.76 | 1.30 | 1.37 | NGC2997 | |
| ESO567–032 | 101544.5201744 | 6 | 3343 | 60 | 397 | 10.89 | 12.54 | 1.65 | 1.49 | NGC3311 | |
| NGC3147 | 101653.6732403 | 5 | 2978 | 80 | 510 | 11.60 | 12.95 | 1.35 | 3.42 | NGC3147 | |
| NGC3190 | 101805.6214955 | 13 | 1197 | 112 | 181 | 11.13 | 12.77 | 1.64 | 0.52 | NGC4472 | |
| NGC3182 | 101933.0581221 | 4 | 2203 | 42 | 321 | 10.57 | 12.00 | 1.43 | 1.68 | NGC3182 | |
| NGC3223 | 102135.1341601 | 53 | 2497 | 404 | 368 | 12.13 | 14.31 | 2.18 | 0.57 | NGC3223 | |
| NGC3233 | 102157.5221604 | 4 | 3422 | 57 | 516 | 11.12 | 12.62 | 1.50 | 0.82 | NGC3311 | |
| NGC3227 | 102330.6195154 | 5 | 1034 | 79 | 71 | 10.75 | 12.29 | 1.54 | 0.93 | NGC4472 |
| Group | J2000.0 | N | T | Association | |||||||
|---|---|---|---|---|---|---|---|---|---|---|---|
| NGC3230 | 102344.0123404 | 6 | 2728 | 134 | 111 | 10.94 | 12.49 | 1.55 | 3.61 | NGC3230 | |
| NGC3245 | 102718.4283027 | 6 | 1291 | 39 | 239 | 10.95 | 11.91 | 0.96 | 0.94 | NGC3245 | |
| ESO375–041 | 102931.0351535 | 4 | 1476 | 39 | 58 | 10.07 | 11.16 | 1.09 | 0.64 | NGC3223 | |
| NGC3275 | 103051.8364413 | 5 | 2852 | 40 | 674 | 11.29 | 12.44 | 1.15 | 1.64 | NGC3223 | |
| IC2587 | 103059.6343347 | 6 | 1701 | 91 | 225 | 10.58 | 12.38 | 1.80 | 1.77 | NGC3223 | |
| NGC3281 | 103152.1345113 | 4 | 3116 | 135 | 510 | 11.35 | 13.31 | 1.96 | 1.72 | NGC3223 | |
| NGC3282 | 103221.9221808 | 4 | 3416 | 72 | 147 | 10.84 | 12.17 | 1.33 | 3.50 | NGC3311 | |
| NGC3266 | 103317.6644458 | 5 | 1817 | 76 | 105 | 10.49 | 11.86 | 1.37 | 0.51 | NGC3266 | |
| NGC3300 | 103638.4141016 | 8 | 2852 | 36 | 65 | 11.01 | 11.92 | 0.91 | 0.95 | NGC3367 | |
| NGC3311 | 103642.8273142 | 139 | 3303 | 426 | 520 | 12.51 | 14.29 | 1.78 | 0.36 | NGC3311 | |
| NGC3338 | 104207.5134449 | 6 | 1123 | 100 | 86 | 10.55 | 11.54 | 0.99 | 1.46 | NGC4472 | |
| NGC3358 | 104333.0362438 | 7 | 2700 | 86 | 199 | 11.46 | 12.97 | 1.51 | 0.08 | NGC3223 | |
| ESO501–088 | 104418.8224934 | 8 | 3497 | 76 | 114 | 10.90 | 12.55 | 1.65 | 0.94 | NGC3311 | |
| NGC3367 | 104635.0134503 | 7 | 2896 | 57 | 326 | 11.16 | 12.55 | 1.39 | 1.52 | NGC3367 | |
| NGC3379 | 104749.6123454 | 27 | 747 | 233 | 179 | 11.47 | 13.23 | 1.76 | 0.05 | NGC4472 | |
| NGC3393 | 104823.5250943 | 6 | 3450 | 153 | 382 | 11.35 | 13.28 | 1.93 | 1.10 | NGC3311 | |
| NGC3394 | 105039.8654338 | 10 | 3449 | 80 | 192 | 10.84 | 12.59 | 1.75 | 0.60 | NGC3394 | |
| NGC3414 | 105116.2275830 | 8 | 1298 | 117 | 94 | 10.78 | 12.52 | 1.74 | 2.17 | NGC3245 | |
| NGC3415 | 105142.6434245 | 4 | 3298 | 53 | 156 | 11.07 | 12.56 | 1.49 | 0.66 | NGC3415 | |
| NGC3430 | 105211.4325702 | 11 | 1578 | 103 | 128 | 10.86 | 12.50 | 1.64 | 0.15 | NGC3430 | |
| NGC3449 | 105253.7325539 | 5 | 2980 | 74 | 422 | 11.45 | 12.69 | 1.24 | 0.61 | NGC3223 | |
| NGC3458 | 105601.5570701 | 6 | 2000 | 64 | 74 | 10.62 | 11.98 | 1.36 | 1.28 | NGC3610 | |
| NGC3486 | 110024.0285829 | 5 | 617 | 18 | 99 | 10.00 | 10.99 | 0.99 | 3.14 | NGC4472 | |
| NGC3497 | 110718.1192818 | 9 | 3487 | 144 | 207 | 11.43 | 12.99 | 1.56 | 1.74 | ESO569–024 | |
| NGC3557 | 110957.7373221 | 13 | 2576 | 143 | 452 | 11.70 | 13.49 | 1.79 | 1.01 | NGC3557 | |
| NGC3573 | 111118.6365232 | 5 | 2090 | 47 | 104 | 11.03 | 12.06 | 1.03 | 0.30 | NGC3557 | |
| NGC3585 | 111317.1264518 | 9 | 1189 | 70 | 414 | 11.09 | 12.66 | 1.57 | 3.97 | NGC3585 | |
| NGC3583 | 111410.9481907 | 5 | 2175 | 98 | 56 | 11.05 | 12.74 | 1.69 | 1.05 | NGC3583 | |
| NGC3607 | 111654.7180307 | 31 | 959 | 124 | 247 | 11.13 | 13.08 | 1.95 | 1.10 | NGC4472 | |
| NGC3610 | 111825.3584710 | 19 | 1794 | 119 | 271 | 11.38 | 13.08 | 1.70 | 0.66 | NGC3610 | |
| NGC3613 | 111836.1575960 | 11 | 2105 | 148 | 194 | 11.11 | 12.77 | 1.66 | 2.47 | NGC3610 | |
| NGC3626 | 112003.8182125 | 4 | 1361 | 109 | 136 | 10.78 | 12.81 | 2.03 | 0.67 | NGC4472 | |
| NGC3627 | 112015.0125930 | 16 | 728 | 154 | 192 | 11.43 | 13.05 | 1.62 | 0.19 | NGC4472 | |
| UGC06354 | 112055.2632416 | 4 | 3376 | 37 | 262 | 10.27 | 11.67 | 1.40 | 0.32 | UGC06354 | |
| NGC3640 | 112106.9031405 | 12 | 1191 | 174 | 151 | 10.90 | 12.66 | 1.76 | 1.33 | NGC4472 | |
| NGC3656 | 112338.8535032 | 7 | 3014 | 109 | 149 | 10.88 | 12.48 | 1.60 | 3.53 | NGC3549 | |
| NGC3665 | 112443.6384546 | 11 | 2038 | 70 | 353 | 11.33 | 12.80 | 1.47 | 1.45 | NGC3665 | |
| NGC3672 | 112502.5094743 | 7 | 1509 | 101 | 146 | 11.00 | 12.83 | 1.83 | 0.59 | NGC3672 | |
| NGC3686 | 112743.9171327 | 6 | 1044 | 69 | 114 | 10.55 | 12.22 | 1.67 | 0.79 | NGC4472 | |
| IC0694 | 112831.0583341 | 6 | 3178 | 73 | 39 | 11.61 | 13.05 | 1.44 | 0.18 | IC0694 | |
| NGC3706 | 112944.4362329 | 11 | 2684 | 80 | 280 | 11.38 | 12.85 | 1.47 | 2.42 | ESO320–031 | |
| IC0705 | 113256.3501430 | 4 | 3104 | 91 | 99 | 10.20 | 11.99 | 1.79 | 0.79 | IC0705 | |
| NGC3742 | 113532.5375723 | 8 | 2533 | 108 | 215 | 11.47 | 12.80 | 1.33 | 0.01 | ESO320–031 | |
| NGC3735 | 113557.3703208 | 4 | 2809 | 73 | 240 | 11.15 | 12.85 | 1.70 | 2.81 | NGC3735 | |
| NGC3762 | 113723.8614534 | 5 | 3439 | 71 | 298 | 11.16 | 12.55 | 1.39 | 0.73 | IC0694 | |
| NGC3769 | 113744.1475335 | 6 | 780 | 42 | 35 | 9.81 | 11.99 | 2.18 | 1.47 | NGC5194 | |
| NGC3770 | 113758.7593701 | 4 | 3359 | 139 | 93 | 10.82 | 12.78 | 1.96 | 1.14 | IC0694 | |
| NGC3780 | 113922.4561614 | 5 | 2484 | 55 | 415 | 11.04 | 12.68 | 1.64 | 0.21 | NGC3780 | |
| NGC3800 | 114013.5152032 | 4 | 3188 | 44 | 64 | 11.07 | 12.42 | 1.35 | 1.07 | NGC3801 | |
| NGC3801 | 114016.9174341 | 15 | 3324 | 82 | 161 | 11.56 | 12.70 | 1.14 | 0.78 | NGC3801 | |
| NGC3810 | 114058.8112816 | 4 | 853 | 32 | 237 | 10.31 | 11.69 | 1.38 | 2.75 | NGC4472 | |
| NGC3838 | 114413.8575653 | 11 | 1368 | 63 | 202 | 10.60 | 12.19 | 1.59 | 0.28 | NGC5194 | |
| NGC3853 | 114428.3163329 | 5 | 3218 | 16 | 436 | 10.91 | 11.60 | 0.69 | 1.93 | NGC3801 | |
| NGC3869 | 114545.6104929 | 4 | 2868 | 40 | 347 | 10.89 | 12.09 | 1.20 | 2.33 | NGC4472 | |
| NGC3872 | 114549.1134600 | 8 | 3074 | 54 | 470 | 11.25 | 12.52 | 1.27 | 2.33 | NGC3801 | |
| NGC3877 | 114607.8472941 | 21 | 955 | 65 | 239 | 11.05 | 12.57 | 1.52 | 0.03 | NGC5194 | |
| NGC3894 | 114850.4592456 | 21 | 3397 | 123 | 242 | 11.60 | 13.02 | 1.42 | 0.74 | IC0694 | |
| NGC3900 | 114909.5270119 | 4 | 1745 | 30 | 227 | 10.74 | 11.31 | 0.57 | 1.25 | NGC4472 | |
| NGC3923 | 115101.8284822 | 26 | 1553 | 159 | 357 | 11.62 | 13.33 | 1.71 | 1.18 | NGC3923 | |
| NGC3945 | 115313.7604032 | 16 | 1399 | 92 | 358 | 11.28 | 12.93 | 1.65 | 0.04 | NGC3945 | |
| ESO320–031 | 115405.8395150 | 17 | 2679 | 150 | 438 | 11.71 | 13.33 | 1.62 | 0.64 | ESO320–031 | |
| NGC3966 | 115644.2320118 | 11 | 3162 | 101 | 195 | 11.43 | 12.75 | 1.32 | 0.78 | NGC3966 | |
| NGC3992 | 115736.0532228 | 72 | 1097 | 120 | 452 | 11.68 | 13.33 | 1.65 | 0.11 | NGC5194 | |
| NGC4004 | 115805.2275244 | 4 | 3357 | 43 | 122 | 10.90 | 11.92 | 1.02 | 0.06 | NGC4008 |
| Group | J2000.0 | N | T | Association | |||||||
|---|---|---|---|---|---|---|---|---|---|---|---|
| NGC4030 | 120023.6010600 | 7 | 1291 | 50 | 347 | 10.91 | 12.52 | 1.61 | 3.57 | NGC4472 | |
| NGC4039 | 120153.6185311 | 23 | 1409 | 74 | 256 | 11.50 | 12.82 | 1.32 | 0.12 | NGC4039 | |
| UGC07017 | 120222.5295142 | 4 | 3100 | 44 | 123 | 10.56 | 11.70 | 1.14 | 1.35 | NGC3966 | |
| NGC4062 | 120403.8315345 | 4 | 736 | 33 | 175 | 10.08 | 11.92 | 1.84 | 2.55 | NGC4472 | |
| NGC4105 | 120640.8294537 | 29 | 1870 | 139 | 382 | 11.61 | 13.23 | 1.62 | 0.60 | NGC3923 | |
| NGC4111 | 120703.1430355 | 20 | 851 | 93 | 212 | 11.14 | 12.69 | 1.55 | 0.08 | NGC5194 | |
| UGCA 272 | 120747.6672302 | 4 | 2441 | 33 | 174 | 10.18 | 11.50 | 1.32 | 1.52 | NGC4256 | |
| NGC4125 | 120806.0651027 | 16 | 1515 | 85 | 282 | 11.33 | 12.67 | 1.34 | 2.24 | NGC3945 | |
| NGC4123 | 120811.1025242 | 5 | 1150 | 15 | 80 | 10.36 | 11.15 | 0.79 | 1.56 | NGC4472 | |
| NGC4128 | 120832.3684603 | 4 | 2505 | 80 | 286 | 10.97 | 12.73 | 1.76 | 2.31 | NGC4256 | |
| NGC4151 | 121032.6392421 | 16 | 1031 | 69 | 348 | 11.03 | 12.56 | 1.53 | 0.48 | NGC5194 | |
| NGC4149 | 121032.8581815 | 4 | 3107 | 51 | 260 | 10.45 | 12.06 | 1.61 | 4.98 | NGC4290 | |
| NGC4150 | 121033.7302406 | 4 | 211 | 56 | 56 | 8.68 | 11.61 | 2.93 | 2.81 | NGC4150 | |
| NGC4157 | 121104.4502905 | 8 | 834 | 65 | 150 | 10.82 | 12.21 | 1.39 | 0.12 | NGC5194 | |
| NGC4189 | 121347.3132529 | 6 | 1987 | 30 | 132 | 10.64 | 11.45 | 0.81 | 4.83 | NGC4472 | |
| ESO380–006 | 121534.3353747 | 9 | 2568 | 147 | 386 | 11.57 | 13.40 | 1.83 | 0.50 | ESO380–006 | |
| NGC4217 | 121550.9470530 | 5 | 1085 | 55 | 224 | 10.83 | 12.20 | 1.37 | 0.55 | NGC5194 | |
| NGC4216 | 121554.4130858 | 16 | 55 | 52 | 23 | 8.60 | 11.24 | 2.64 | 2.27 | NGC4472 | |
| NGC4219 | 121627.3431927 | 4 | 1708 | 55 | 268 | 10.86 | 12.59 | 1.73 | 3.57 | NGC4219 | |
| NGC4224 | 121633.7072744 | 15 | 2425 | 118 | 448 | 11.33 | 12.95 | 1.62 | 0.18 | NGC4472 | |
| NGC4250 | 121726.3704809 | 4 | 2277 | 51 | 81 | 10.66 | 11.93 | 1.27 | 4.91 | NGC4250 | |
| NGC4244 | 121729.7374826 | 8 | 291 | 38 | 76 | 9.71 | 11.60 | 1.89 | 0.18 | NGC5194 | |
| NGC4256 | 121843.0655353 | 11 | 2808 | 157 | 191 | 11.43 | 12.96 | 1.53 | 0.99 | NGC4256 | |
| NGC4254 | 121849.6142459 | 16 | 2296 | 92 | 457 | 11.71 | 13.28 | 1.57 | 1.51 | NGC4472 | |
| NGC4258 | 121857.5471814 | 15 | 551 | 80 | 254 | 10.97 | 12.45 | 1.48 | 2.34 | NGC5194 | |
| NGC4261 | 121923.2054931 | 87 | 2060 | 276 | 358 | 11.99 | 13.70 | 1.71 | 0.67 | NGC4472 | |
| NGC4274 | 121950.6293652 | 14 | 990 | 102 | 256 | 11.22 | 12.70 | 1.48 | 0.42 | NGC4472 | |
| NGC4291 | 122017.8752215 | 8 | 1866 | 92 | 337 | 11.12 | 12.76 | 1.64 | 0.08 | NGC4291 | |
| NGC4303 | 122154.9042825 | 23 | 1387 | 115 | 434 | 11.35 | 12.97 | 1.62 | 1.64 | NGC4472 | |
| NGC4321 | 122254.9154921 | 17 | 1515 | 165 | 394 | 11.55 | 13.35 | 1.80 | 2.11 | NGC4472 | |
| NGC4346 | 122327.9465938 | 5 | 787 | 25 | 286 | 10.29 | 11.41 | 1.12 | 0.95 | NGC5194 | |
| NGC4342 | 122339.0070314 | 5 | 596 | 32 | 125 | 9.87 | 11.44 | 1.57 | 0.28 | NGC4472 | |
| NGC4373 | 122517.8394535 | 21 | 2992 | 149 | 554 | 11.95 | 13.40 | 1.45 | 0.20 | NGC4696 | |
| NGC4402 | 122607.6130646 | 4 | 117 | 17 | 63 | 8.50 | 10.60 | 2.10 | 1.56 | NGC4472 | |
| NGC4441 | 122720.4644805 | 4 | 2885 | 49 | 247 | 10.78 | 12.27 | 1.49 | 0.23 | NGC4256 | |
| NGC4472 | 122946.8080002 | 355 | 992 | 291 | 696 | 12.44 | 14.14 | 1.70 | 0.34 | NGC4472 | |
| NGC4490 | 123036.4413837 | 8 | 583 | 45 | 98 | 10.36 | 11.84 | 1.48 | 1.31 | NGC5194 | |
| NGC4501 | 123159.2142514 | 31 | 1956 | 199 | 717 | 12.06 | 13.79 | 1.73 | 0.78 | NGC4472 | |
| NGC4521 | 123247.6635621 | 7 | 2644 | 68 | 322 | 10.91 | 12.51 | 1.60 | 1.86 | NGC4256 | |
| NGC4527 | 123408.5023914 | 18 | 1592 | 85 | 305 | 11.52 | 12.93 | 1.41 | 0.58 | NGC4472 | |
| NGC4535 | 123420.3081152 | 23 | 1747 | 121 | 624 | 11.75 | 13.36 | 1.61 | 0.08 | NGC4472 | |
| NGC4546 | 123529.5034735 | 4 | 879 | 49 | 92 | 10.54 | 12.07 | 1.53 | 4.29 | NGC4472 | |
| NGC4552 | 123539.8123323 | 12 | 230 | 55 | 90 | 9.81 | 11.73 | 1.92 | 1.79 | NGC4472 | |
| NGC4565 | 123620.8255916 | 11 | 1191 | 83 | 301 | 11.83 | 12.98 | 1.15 | 0.56 | NGC4472 | |
| NGC4568 | 123634.3111420 | 6 | 2163 | 28 | 135 | 11.59 | 12.25 | 0.66 | 0.79 | NGC4472 | |
| NGC4589 | 123725.0741131 | 4 | 2121 | 155 | 218 | 11.17 | 12.82 | 1.65 | 2.86 | NGC4291 | |
| NGC4593 | 123939.4052039 | 7 | 2368 | 114 | 239 | 11.37 | 12.96 | 1.59 | 0.55 | NGC4593 | |
| NGC4594 | 123959.4113723 | 11 | 856 | 61 | 597 | 11.53 | 12.90 | 1.37 | 2.98 | NGC4472 | |
| IC3639 | 124052.8364521 | 4 | 3045 | 64 | 57 | 10.88 | 11.94 | 1.06 | 1.37 | NGC4696 | |
| NGC4648 | 124144.4742515 | 8 | 1604 | 52 | 291 | 10.96 | 12.50 | 1.54 | 0.00 | NGC4291 | |
| NGC4631 | 124208.0323229 | 28 | 635 | 90 | 243 | 11.12 | 12.98 | 1.86 | 0.25 | NGC4472 | |
| NGC4636 | 124249.9024116 | 32 | 757 | 73 | 337 | 11.08 | 12.58 | 1.50 | 1.01 | NGC4472 | |
| NGC4643 | 124320.1015842 | 9 | 1195 | 74 | 301 | 10.80 | 12.60 | 1.80 | 4.20 | NGC4472 | |
| NGC4666 | 124508.7002743 | 16 | 1427 | 98 | 320 | 11.24 | 12.95 | 1.71 | 1.33 | NGC4472 | |
| NGC4682 | 124715.5100348 | 4 | 2215 | 48 | 179 | 10.89 | 12.23 | 1.34 | 0.10 | NGC4472 | |
| NGC4690 | 124755.5013922 | 4 | 2643 | 53 | 102 | 10.43 | 12.06 | 1.63 | 3.79 | NGC4690 | |
| NGC4697 | 124835.9054803 | 37 | 1175 | 109 | 546 | 11.66 | 13.27 | 1.61 | 0.13 | NGC4472 | |
| NGC4696 | 124849.3411840 | 116 | 2845 | 303 | 690 | 12.50 | 14.13 | 1.63 | 1.08 | NGC4696 | |
| NGC4750 | 125007.2725228 | 8 | 1836 | 53 | 467 | 11.06 | 12.38 | 1.32 | 1.35 | NGC4291 | |
| NGC4736 | 125053.1410714 | 5 | 352 | 16 | 338 | 10.64 | 11.34 | 0.70 | 5.49 | NGC5194 | |
| ESO507–025 | 125131.8262707 | 26 | 3028 | 130 | 328 | 11.92 | 13.18 | 1.26 | 0.98 | ESO507–025 | |
| NGC4753 | 125222.1011159 | 23 | 992 | 98 | 486 | 11.21 | 12.76 | 1.55 | 1.08 | NGC4472 | |
| ESO442–028 | 125235.2315314 | 4 | 3315 | 27 | 175 | 10.60 | 11.80 | 1.20 | 3.10 | ESO507–025 | |
| NGC4751 | 125250.8423936 | 9 | 1838 | 88 | 254 | 11.10 | 12.85 | 1.75 | 0.96 | NGC4696 |
| Group | J2000.0 | N | T | Association | |||||||
|---|---|---|---|---|---|---|---|---|---|---|---|
| NGC4759 | 125304.5091160 | 12 | 3471 | 146 | 454 | 11.81 | 13.55 | 1.74 | 0.63 | NGC4759 | |
| NGC4795 | 125502.9080356 | 7 | 2548 | 118 | 53 | 10.80 | 12.34 | 1.54 | 0.78 | NGC4472 | |
| NGC4814 | 125521.9582039 | 5 | 2644 | 76 | 78 | 10.91 | 12.63 | 1.72 | 2.03 | NGC4814 | |
| NGC4808 | 125549.0041815 | 5 | 591 | 27 | 115 | 9.78 | 11.30 | 1.52 | 0.72 | NGC4472 | |
| NGC4835 | 125807.8461551 | 5 | 1933 | 59 | 83 | 10.92 | 12.31 | 1.39 | 4.84 | NGC4696 | |
| NGC4856 | 125921.3150232 | 5 | 1189 | 50 | 217 | 10.79 | 12.25 | 1.46 | 3.58 | NGC4472 | |
| NGC4866 | 125927.1141016 | 5 | 1909 | 58 | 126 | 11.02 | 12.63 | 1.61 | 3.65 | NGC4472 | |
| NGC4900 | 130039.1023005 | 8 | 779 | 36 | 53 | 9.99 | 11.61 | 1.62 | 3.35 | NGC4472 | |
| NGC4902 | 130059.7143049 | 6 | 2450 | 48 | 355 | 11.30 | 12.39 | 1.09 | 1.03 | NGC5044 | |
| NGC4933B | 130356.7112953 | 5 | 3009 | 63 | 32 | 11.53 | 12.64 | 1.11 | 0.02 | NGC4933B | |
| NGC4930 | 130405.3412442 | 7 | 2258 | 75 | 366 | 10.91 | 12.69 | 1.78 | 2.71 | NGC4696 | |
| NGC4936 | 130417.1303135 | 16 | 2931 | 194 | 460 | 11.79 | 13.36 | 1.57 | 1.70 | ESO507–025 | |
| NGC4965 | 130709.4281341 | 4 | 2036 | 30 | 109 | 10.35 | 11.38 | 1.03 | 0.11 | NGC5078 | |
| NGC4995 | 130940.7075000 | 4 | 1569 | 38 | 422 | 11.01 | 12.03 | 1.02 | 0.26 | NGC4472 | |
| NGC4993 | 130947.7232302 | 15 | 2702 | 74 | 375 | 11.42 | 12.44 | 1.02 | 0.05 | ESO507–025 | |
| NGC5005 | 131056.2370333 | 13 | 986 | 119 | 171 | 11.24 | 12.85 | 1.61 | 0.51 | NGC5194 | |
| NGC5020 | 131239.9123559 | 6 | 3279 | 26 | 200 | 11.01 | 11.43 | 0.42 | 4.00 | NGC5020 | |
| NGC5011 | 131251.9430546 | 20 | 2871 | 131 | 448 | 11.78 | 13.43 | 1.65 | 0.75 | NGC4696 | |
| NGC5018 | 131301.0193105 | 9 | 2579 | 133 | 231 | 11.53 | 12.92 | 1.39 | 1.54 | NGC5044 | |
| NGC5044 | 131524.0162308 | 52 | 2474 | 245 | 480 | 11.96 | 13.72 | 1.76 | 1.14 | NGC5044 | |
| NGC5054 | 131658.5163805 | 7 | 1556 | 101 | 76 | 11.15 | 12.95 | 1.80 | 1.01 | NGC5044 | |
| IC4214 | 131742.7320606 | 4 | 2109 | 67 | 495 | 11.03 | 12.80 | 1.77 | 2.22 | NGC5078 | |
| NGC5077 | 131931.7123925 | 9 | 2731 | 111 | 202 | 11.45 | 12.83 | 1.38 | 1.44 | NGC5044 | |
| NGC5078 | 131950.0272436 | 26 | 1849 | 138 | 620 | 11.81 | 13.48 | 1.67 | 0.03 | NGC5078 | |
| NGC5084 | 132016.9214939 | 12 | 1560 | 141 | 452 | 11.50 | 13.20 | 1.70 | 0.76 | NGC5078 | |
| NGC5109 | 132052.4573841 | 4 | 2253 | 44 | 124 | 10.05 | 11.50 | 1.45 | 0.24 | NGC5473 | |
| NGC5090 | 132112.8434216 | 16 | 3167 | 218 | 337 | 12.01 | 13.74 | 1.73 | 0.58 | NGC4696 | |
| NGC5121 | 132445.6374056 | 5 | 1250 | 38 | 184 | 10.45 | 11.89 | 1.44 | 3.16 | NGC5128 | |
| NGC5145 | 132513.9431602 | 7 | 1310 | 21 | 226 | 10.40 | 11.44 | 1.04 | 0.16 | NGC5194 | |
| NGC5128 | 132527.6430109 | 15 | 299 | 94 | 402 | 11.21 | 12.52 | 1.31 | 0.52 | NGC5128 | |
| NGC5170 | 132948.8175759 | 4 | 1313 | 86 | 223 | 10.83 | 12.63 | 1.80 | 2.57 | NGC5247 | |
| NGC5194 | 132952.7471143 | 9 | 574 | 84 | 182 | 11.29 | 12.93 | 1.64 | 0.12 | NGC5194 | |
| NGC5198 | 133011.4464015 | 15 | 2678 | 101 | 301 | 11.16 | 12.69 | 1.53 | 1.15 | NGC5198 | |
| NGC5188 | 133128.3344740 | 6 | 2129 | 30 | 599 | 11.22 | 12.08 | 0.86 | 0.11 | NGC5188 | |
| NGC5218 | 133210.4624604 | 4 | 3033 | 55 | 174 | 11.07 | 12.08 | 1.01 | 0.66 | NGC5218 | |
| UGC08603 | 133633.7443557 | 5 | 2726 | 50 | 224 | 10.26 | 11.94 | 1.68 | 1.05 | NGC5198 | |
| NGC5236 | 133700.9295157 | 12 | 321 | 77 | 149 | 10.78 | 12.29 | 1.51 | 3.63 | NGC5128 | |
| NGC5248 | 133732.1085306 | 5 | 1087 | 48 | 133 | 10.77 | 12.21 | 1.44 | 4.91 | NGC4472 | |
| NGC5297 | 134623.7435219 | 8 | 2399 | 51 | 182 | 10.91 | 12.00 | 1.09 | 1.92 | NGC5371 | |
| NGC5308 | 134700.4605823 | 7 | 2172 | 85 | 191 | 10.93 | 12.59 | 1.66 | 5.00 | NGC5473 | |
| NGC5302 | 134849.7303040 | 4 | 3444 | 84 | 210 | 11.37 | 12.58 | 1.21 | 0.67 | IC4296 | |
| NGC5322 | 134915.2601126 | 21 | 1937 | 169 | 421 | 11.44 | 13.12 | 1.68 | 1.45 | NGC5473 | |
| NGC5371 | 135539.9402742 | 55 | 2616 | 195 | 455 | 12.07 | 13.69 | 1.62 | 0.01 | NGC5371 | |
| NGC5363 | 135607.2051517 | 17 | 1161 | 143 | 152 | 11.18 | 12.76 | 1.58 | 0.87 | NGC4472 | |
| NGC5383 | 135704.8415048 | 5 | 2328 | 81 | 173 | 11.02 | 12.41 | 1.39 | 1.45 | NGC5371 | |
| IC4351 | 135754.3291857 | 5 | 2478 | 139 | 99 | 11.28 | 12.85 | 1.57 | 1.69 | IC4351 | |
| NGC5403 | 135950.9381057 | 4 | 2751 | 69 | 12 | 10.79 | 12.18 | 1.39 | 2.22 | NGC5371 | |
| NGC5422 | 140042.0550952 | 12 | 1935 | 121 | 249 | 11.07 | 13.01 | 1.94 | 0.28 | NGC5473 | |
| NGC5430 | 140045.7591942 | 4 | 3158 | 15 | 418 | 11.07 | 11.14 | 0.07 | 1.93 | NGC5430 | |
| NGC5448 | 140250.1491022 | 5 | 2141 | 74 | 459 | 10.82 | 12.67 | 1.85 | 2.18 | NGC5481 | |
| NGC5457 | 140312.6542057 | 6 | 379 | 61 | 150 | 10.56 | 12.05 | 1.49 | 3.97 | NGC5194 | |
| NGC5427 | 140326.0060151 | 5 | 2496 | 55 | 89 | 11.17 | 12.59 | 1.42 | 0.91 | NGC5427 | |
| NGC5473 | 140443.2545333 | 18 | 2162 | 94 | 294 | 11.25 | 12.75 | 1.50 | 0.04 | NGC5473 | |
| NGC5481 | 140641.2504324 | 9 | 2012 | 131 | 154 | 10.86 | 12.87 | 2.01 | 0.08 | NGC5481 | |
| NGC5506 | 141314.9031227 | 4 | 1773 | 29 | 36 | 10.97 | 11.29 | 0.32 | 0.92 | NGC5506 | |
| NGC5529 | 141534.1361336 | 7 | 2956 | 122 | 131 | 11.13 | 12.54 | 1.41 | 5.08 | NGC5557 | |
| IC0996 | 141722.1573747 | 4 | 3231 | 39 | 102 | 10.37 | 11.66 | 1.29 | 0.36 | IC0996 | |
| NGC5557 | 141825.7362937 | 20 | 3325 | 141 | 381 | 11.69 | 13.30 | 1.61 | 1.56 | NGC5557 | |
| NGC5566 | 142019.9035601 | 12 | 1527 | 116 | 186 | 11.31 | 12.89 | 1.58 | 0.44 | NGC5846 | |
| NGC5602 | 142218.8503005 | 5 | 2354 | 79 | 103 | 10.57 | 12.23 | 1.66 | 1.82 | NGC5676 | |
| NGC5600 | 142349.5143819 | 4 | 2266 | 59 | 330 | 10.85 | 12.19 | 1.34 | 0.28 | NGC5600 | |
| NGC5638 | 142940.4031400 | 12 | 1683 | 84 | 184 | 10.82 | 12.28 | 1.46 | 3.03 | NGC5846 | |
| NGC5661 | 143157.4061502 | 4 | 2303 | 48 | 79 | 9.99 | 11.66 | 1.67 | 1.62 | NGC5661 | |
| NGC5678 | 143205.6575517 | 7 | 2081 | 78 | 196 | 11.20 | 12.67 | 1.47 | 0.18 | NGC5473 |
| Group | J2000.0 | N | T | Association | |||||||
|---|---|---|---|---|---|---|---|---|---|---|---|
| NGC5643 | 143240.8441029 | 4 | 986 | 59 | 167 | 10.92 | 12.48 | 1.56 | 0.70 | NGC5643 | |
| NGC5676 | 143246.8492728 | 17 | 2389 | 105 | 348 | 11.57 | 12.99 | 1.42 | 0.48 | NGC5676 | |
| NGC5707 | 143730.8513343 | 7 | 2348 | 87 | 220 | 10.73 | 12.12 | 1.39 | 2.26 | NGC5676 | |
| UGC09476 | 144132.0443046 | 4 | 3401 | 23 | 100 | 10.77 | 11.76 | 0.99 | 0.56 | UGC09476 | |
| NGC5729 | 144206.9090034 | 4 | 1750 | 49 | 106 | 10.43 | 11.76 | 1.33 | 1.71 | NGC5729 | |
| NGC5726 | 144256.0182642 | 4 | 3333 | 54 | 134 | 10.81 | 12.02 | 1.21 | 3.29 | NGC5726 | |
| IC1048 | 144258.0045322 | 4 | 1671 | 59 | 132 | 10.27 | 11.98 | 1.71 | 2.42 | NGC5846 | |
| ESO512–018 | 144333.9242739 | 6 | 3321 | 168 | 103 | 11.33 | 13.09 | 1.76 | 1.09 | ESO512–018 | |
| NGC5746 | 144456.0015717 | 39 | 1679 | 107 | 269 | 11.66 | 13.20 | 1.54 | 1.36 | NGC5846 | |
| ESO580–027 | 144728.5221642 | 4 | 3169 | 20 | 174 | 10.96 | 11.53 | 0.57 | 1.49 | ESO512–018 | |
| NGC5757 | 144746.4190443 | 6 | 2532 | 46 | 268 | 11.10 | 12.05 | 0.95 | 0.75 | NGC5728 | |
| NGC5775 | 145357.6033240 | 8 | 1558 | 105 | 129 | 11.07 | 12.85 | 1.78 | 1.43 | NGC5846 | |
| NGC5792 | 145822.7010528 | 6 | 1822 | 50 | 290 | 11.06 | 12.03 | 0.97 | 4.19 | NGC5846 | |
| NGC5820 | 145839.8535310 | 5 | 3423 | 83 | 218 | 11.11 | 12.47 | 1.36 | 1.50 | NGC5908 | |
| NGC5791 | 145846.2191601 | 11 | 3257 | 129 | 309 | 11.51 | 13.11 | 1.60 | 1.13 | NGC5791 | |
| NGC5796 | 145924.1163726 | 7 | 2901 | 223 | 375 | 11.54 | 13.37 | 1.83 | 1.22 | NGC5796 | |
| NGC5812 | 150055.7072726 | 4 | 1829 | 140 | 132 | 11.02 | 12.37 | 1.35 | 1.97 | NGC5812 | |
| MCG–02–38–030 | 150300.2131658 | 5 | 2697 | 130 | 187 | 10.98 | 13.27 | 2.29 | 0.45 | NGC5796 | |
| NGC5838 | 150526.3020558 | 9 | 1266 | 54 | 148 | 11.01 | 12.16 | 1.15 | 0.87 | NGC5846 | |
| NGC5846 | 150629.3013620 | 74 | 1809 | 228 | 395 | 11.80 | 13.64 | 1.84 | 0.46 | NGC5846 | |
| NGC5861 | 150916.1111918 | 5 | 1825 | 107 | 295 | 10.89 | 12.22 | 1.33 | 0.45 | NGC5861 | |
| NGC5907 | 151553.7561944 | 10 | 950 | 66 | 265 | 11.17 | 12.54 | 1.37 | 0.11 | NGC5907 | |
| NGC5898 | 151813.6240553 | 14 | 2233 | 187 | 131 | 11.49 | 13.09 | 1.60 | 0.03 | NGC5898 | |
| NGC5930 | 152607.9414034 | 8 | 2784 | 85 | 81 | 11.16 | 12.65 | 1.49 | 0.98 | NGC5899 | |
| NGC5961 | 153516.2305152 | 4 | 1887 | 58 | 70 | 9.96 | 12.04 | 2.08 | 2.41 | NGC5961 | |
| NGC5962 | 153631.7163628 | 5 | 2020 | 31 | 51 | 11.07 | 11.98 | 0.91 | 0.63 | NGC5962 | |
| IC1128 | 153752.9014407 | 5 | 3430 | 76 | 172 | 10.74 | 12.38 | 1.64 | 1.18 | IC1128 | |
| NGC5982 | 153839.8592121 | 16 | 3123 | 159 | 512 | 11.82 | 13.31 | 1.49 | 0.00 | NGC5982 | |
| NGC6000 | 154949.6292313 | 4 | 2094 | 30 | 182 | 10.99 | 11.01 | 0.02 | 3.93 | NGC6000 | |
| NGC6181 | 163221.0194936 | 4 | 2571 | 61 | 204 | 11.09 | 12.29 | 1.20 | 1.61 | NGC6181 | |
| NGC6307 | 170740.5604503 | 4 | 3312 | 55 | 81 | 10.96 | 12.06 | 1.10 | 1.37 | NGC6307 | |
| NGC6340 | 171024.9721816 | 6 | 1492 | 59 | 101 | 10.72 | 12.06 | 1.34 | 1.50 | NGC6340 | |
| IC4633 | 171347.0773210 | 6 | 2736 | 96 | 161 | 11.43 | 12.91 | 1.48 | 0.72 | IC4633 | |
| NGC6484 | 175147.0242900 | 4 | 3363 | 38 | 174 | 10.96 | 11.74 | 0.78 | 1.47 | NGC6427 | |
| NGC6501 | 175603.7182223 | 7 | 3312 | 137 | 185 | 11.50 | 13.20 | 1.70 | 0.05 | NGC6501 | |
| IC4704 | 182753.6713635 | 6 | 3429 | 173 | 287 | 11.62 | 13.08 | 1.46 | 0.59 | IC4704 | |
| IC4797 | 185629.7541821 | 8 | 2641 | 150 | 179 | 11.63 | 13.15 | 1.52 | 0.26 | IC4797 | |
| NGC6744 | 190946.1635127 | 9 | 751 | 78 | 229 | 11.12 | 12.59 | 1.47 | 1.11 | NGC6744 | |
| NGC6753 | 191123.6570258 | 5 | 2954 | 106 | 587 | 11.57 | 13.20 | 1.63 | 3.12 | IC4797 | |
| NGC6758 | 191352.3561836 | 7 | 3355 | 111 | 434 | 11.60 | 13.12 | 1.52 | 1.00 | IC4797 | |
| NGC6868 | 200954.1482246 | 19 | 2780 | 182 | 309 | 11.96 | 13.38 | 1.42 | 0.39 | NGC6868 | |
| NGC6903 | 202344.9191932 | 5 | 3449 | 50 | 389 | 11.38 | 12.51 | 1.13 | 3.53 | NGC6903 | |
| NGC6902 | 202428.1433913 | 7 | 2958 | 155 | 246 | 11.41 | 13.07 | 1.66 | 0.12 | NGC6868 | |
| NGC6907 | 202506.7244834 | 4 | 3216 | 32 | 726 | 11.43 | 12.03 | 0.60 | 2.10 | NGC6907 | |
| IC5011 | 202833.8360138 | 4 | 2391 | 59 | 34 | 10.95 | 11.56 | 0.61 | 2.66 | IC5011 | |
| NGC6925 | 203420.6315851 | 6 | 2862 | 105 | 296 | 11.50 | 13.17 | 1.67 | 0.82 | NGC6925 | |
| IC5063 | 205202.3570408 | 4 | 3303 | 64 | 172 | 11.26 | 12.25 | 0.99 | 1.38 | IC5063 | |
| IC5096 | 211821.5634538 | 5 | 2984 | 125 | 453 | 11.56 | 13.23 | 1.67 | 0.37 | IC5096 | |
| NGC7049 | 211900.2483343 | 5 | 2136 | 138 | 185 | 11.55 | 13.16 | 1.61 | 0.97 | NGC7049 | |
| ESO287–013 | 212313.9454623 | 4 | 2710 | 64 | 84 | 10.85 | 12.26 | 1.41 | 1.80 | NGC7079 | |
| NGC7126 | 214918.1603633 | 5 | 2946 | 58 | 87 | 10.86 | 11.95 | 1.09 | 0.46 | NGC7126 | |
| NGC7144 | 215242.4481513 | 5 | 1830 | 34 | 384 | 11.26 | 11.91 | 0.65 | 0.55 | NGC7213 | |
| NGC7166 | 220032.9432323 | 6 | 2385 | 140 | 95 | 11.18 | 13.03 | 1.85 | 1.01 | NGC7166 | |
| NGC7176 | 220208.5315923 | 22 | 2633 | 139 | 190 | 11.75 | 13.11 | 1.36 | 0.31 | NGC7176 | |
| NGC7185 | 220256.7202817 | 4 | 1899 | 22 | 195 | 10.40 | 10.66 | 0.26 | 1.27 | NGC7185 | |
| NGC7196 | 220554.8500710 | 4 | 2820 | 58 | 61 | 11.30 | 12.85 | 1.55 | 1.69 | NGC7196 | |
| NGC7192 | 220650.2641858 | 5 | 2835 | 59 | 441 | 11.38 | 12.73 | 1.35 | 1.07 | IC5250A | |
| NGC7213 | 220916.3471000 | 11 | 1806 | 126 | 180 | 11.55 | 13.16 | 1.61 | 1.14 | NGC7213 | |
| IC5179 | 221609.1365037 | 5 | 3424 | 87 | 404 | 11.25 | 12.64 | 1.39 | 2.91 | IC5179 | |
| IC1438 | 221629.1212550 | 5 | 2716 | 24 | 356 | 10.82 | 11.66 | 0.84 | 2.92 | IC1438 | |
| NGC7302 | 223223.8140714 | 4 | 2822 | 94 | 26 | 10.90 | 12.52 | 1.62 | 3.98 | NGC7302 | |
| NGC7331 | 223704.1342456 | 4 | 1113 | 44 | 276 | 11.29 | 12.34 | 1.05 | 4.50 | NGC7331 | |
| IC5250A | 224717.5650335 | 11 | 3076 | 90 | 192 | 11.83 | 13.23 | 1.40 | 0.12 | IC5250A | |
| NGC7410 | 225501.0393941 | 5 | 1871 | 170 | 273 | 11.28 | 13.41 | 2.13 | 2.79 | NGC7582 |
| Group | J2000.0 | N | T | Association | |||||||
|---|---|---|---|---|---|---|---|---|---|---|---|
| IC1459 | 225710.6362744 | 16 | 1775 | 221 | 336 | 11.66 | 13.54 | 1.88 | 1.57 | NGC7582 | |
| IC5267 | 225713.6432346 | 5 | 1644 | 93 | 185 | 11.21 | 12.48 | 1.27 | 1.14 | NGC7582 | |
| UGC12281 | 225912.8133624 | 4 | 2871 | 39 | 85 | 9.73 | 11.18 | 1.45 | 2.33 | UGC12281 | |
| NGC7454 | 230107.3162258 | 7 | 2248 | 83 | 86 | 10.85 | 12.46 | 1.61 | 0.06 | NGC7454 | |
| NGC7484 | 230704.9361631 | 4 | 2707 | 103 | 40 | 10.95 | 12.37 | 1.42 | 3.38 | NGC7484 | |
| NGC7507 | 231207.6283223 | 4 | 1605 | 80 | 57 | 11.18 | 12.00 | 0.82 | 1.67 | NGC7507 | |
| NGC7582 | 231823.5422214 | 13 | 1578 | 67 | 299 | 11.64 | 12.61 | 0.97 | 0.22 | NGC7582 | |
| IC5328 | 233316.5450057 | 6 | 3084 | 67 | 566 | 11.29 | 12.82 | 1.53 | 3.52 | IC5328 | |
| NGC7716 | 233631.5001750 | 5 | 2797 | 40 | 291 | 10.81 | 11.79 | 0.98 | 2.49 | NGC7716 | |
| NGC7727 | 233953.9121735 | 5 | 2043 | 51 | 314 | 11.37 | 12.19 | 0.82 | 0.59 | NGC7727 | |
| NGC7743 | 234421.1095603 | 4 | 1856 | 81 | 94 | 11.03 | 12.29 | 1.26 | 0.22 | NGC7743 |
5 Basic properties of the groups
The distribution of groups of galaxies over the sky in equatorial coordinates is given in three panels of Fig. 1. The upper, middle and bottom panels correspond to near, intermediate and far volumes, delimited by the mean radial velocities of the groups: km s-1, km s-1 and km s-1. Each group is indicated by a circle, the diameter of which is proportional to the total -luminosity (i.e. the stellar mass) of the group members. The circle colour indicates the morphological type of the main member of the group in the colour spectrum: from the early E, S0 types with an old population (red) to the late Irr, BCD types with a young population (light blue). For comparison, small black dots show the distribution of individual galaxies with radial velocities in the above intervals. The grey ragged ring-shaped region traces the zone of strong absorption in the Milky Way according to Schlegel et al. (1998).
As expected, a complex of groups in the Virgo region, where the core of the Local Supercluster of galaxies is located, stands out in the near volume (km s-1). The richest group ( members) is associated with a giant elliptical galaxy M 49 = NGC 4472. The neighbouring groups with the total number of members amounting to 1558 are located mostly along the equator of the Local Supercluster. The other most massive groups in this volume are the groups around M 105 = NGC 3379 (Leo I) and NGC 1553 (Dorado). Among the nearest groups our criteria identifies practically all the known groups around the main galaxies: M 81, NGC 253, Cen A, M 83, NGC 628, M 51, M 101, NGC 891/1023, M 104 (Sombrero) etc.
In the intermediate volume () the traces of group concentration within the Virgo region are also visible, but in general the effect of the Local Supercluster is barely noticeable. The most massive group in this volume is the Fornax cluster (NGC 1399) with a population of . The aggregate of groups in the Fornax and in the Eridanus (NGC 1332/1395/1407) gathers 379 galaxies in total. In addition to these, in other regions of the sky there are massive groups around NGC 5846 and NGC 5746 .
In the distant part of the studied volume (the bottom panel of Fig. 1) the groups show a tendency to be located along some filaments. The most massive groups: Centaurus (NGC 4696), Antlia (NGC 3268) and Hydra (NGC 3311) have masses comparable with that of the Virgo and Fornax clusters. It is easy to notice that the colour of circles in all the panels is correlated with their sizes, demonstrating the well-known observational fact that the E and S0 galaxies usually occur among the brightest members of rich groups and clusters.
Increasing the clustering parameter in (5), the galaxies can be combined into more extended aggregates (clouds), which no longer meet the condition of virial equilibrium. However, the members of such associations still probably lie within their common ‘zero-velocity surface’, i.e. they will approach each other and be subjected to the subsequent virialization. Three panels in Fig. 2 show the distribution of galaxies in the sky with radial velocities in the same intervals as in Fig. 1. The shaded polygons there represent the zones of such aggregates with their real angular sizes in the sky. In the nearby volume (the top panel) the most extended aggregate is the Virgo cluster, and its angular diameter is approximately equal to the diameter of the ‘zero-velocity surface’ of the cluster, which is according to Karachentsev & Nasonova (2010). In the middle panel in the volume of km s-1, the most extended aggregate is the Fornax+Eridanus association of groups. Its angular size is also close to the diameter , which is equal to as estimated by Nasonova et al. (2011). These correspondences suggest that the dimensions of other associations (overdensities) from Fig. 2 may be also in accordance with sizes of their ‘infall zones’. It will be appropriate to note here that there is a significant fraction of galaxies that are located outside the volumes of both groups and clouds. Their distribution does not appear to be random, but shows some correlation with the distribution of group centres. The most isolated of these ‘field galaxies’ (Karachentsev et al., 2009) are of considerable interest with regard to the effect of their isolation on the population and structure of these objects, and the star formation rate in them.
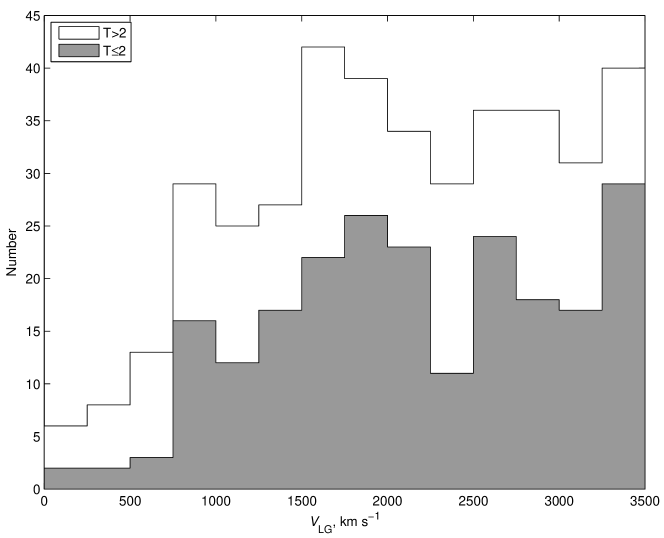
Among 10914 galaxies in the studied volume, the individual distance estimates are so far known for less than 2000 galaxies. Most of them are spiral galaxies, where the distances were determined by the Tully & Fisher (1977) method with the accuracy of per cent from the relation between the luminosity and rotation amplitude of the galaxies. However, to ensure a uniform approach we used only the Hubble distances of galaxies , that, of course, distorts the true picture of distribution of galaxy groups in the Local universe. The distribution of 395 identified groups by their mean radial velocities is presented in Fig. 3. The groups in which the main member is a galaxy with a well-developed bulge ( are marked in the figure in grey. As one can see, the distribution of is markedly different from homogeneous, showing an excess of the group number from the Virgo and Fornax complexes with their velocities around 1500 km s-1. In the Local Volume ( km s-1) there exists a lack of groups with the main galaxies of early type. It reflects the well known effect of the morphological segregation with environment because our Galaxy lies on the edge of Local Supercluster far away from the dense concentration of the galaxies.
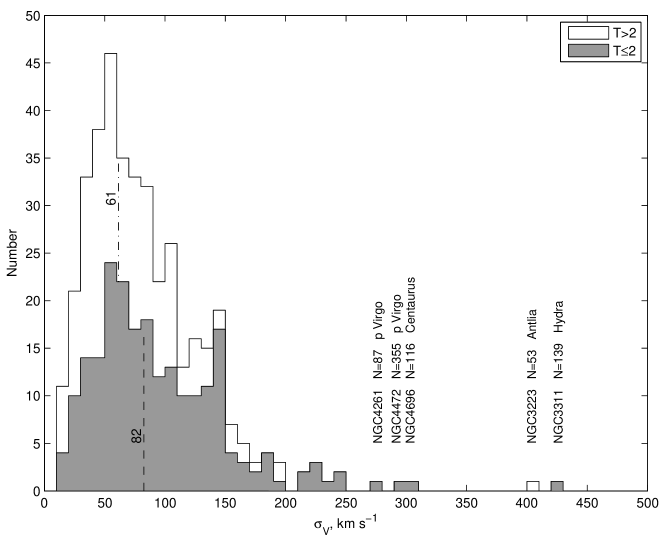
Fig. 4 shows the distribution of groups by their radial velocity dispersion. The value in groups ranges from 10 to 450 km s-1 with the median of 74 km s-1. In the groups where the main galaxy belongs to the E, S0, Sa types, the median dispersion (82 km s-1) is slightly higher than in the groups with the late-type main galaxy (61 km s-1). Since in the modern optical redshift surveys the typical velocity measurement errors amount to km s-1, their effect on the virial motion amplitude is significant. The groups, presented in the tail of the distribution are in general those, dominated by the early-type galaxies; they are marked in the figure in grey.
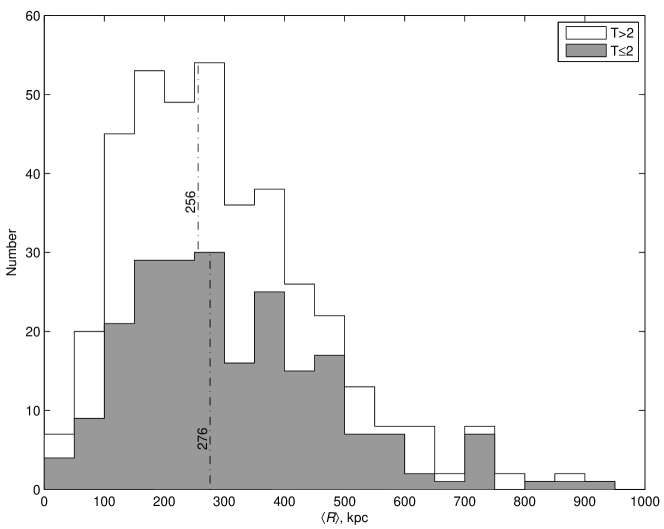
According to data from Fig. 5, the mean projected radius of the groups is distributed over a wide range from 33 kpc to 903 kpc with a median of 268 kpc. The groups with a dominant early-type galaxy (shown in grey) have the linear size on the average slightly larger (276 kpc) than the others (256 kpc). It is obvious that the observed diversity of linear sizes of groups has a physical origin, rather than being caused simply by the projection factors.
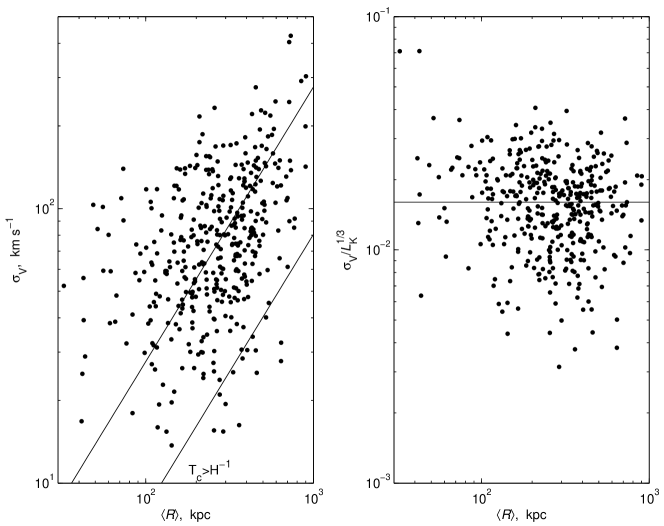
A two-dimensional distribution of 395 groups by linear dimension and velocity dispersion is presented in the left panel of Fig. 6. Despite a large scatter, a weak positive correlation between and is visible. A straight line in the lower right corner indicates the region where the ‘crossing time’ of the group exceeds the Hubble time of the Universe Gyr. Only 3 per cent of all groups outreachs this limit mainly due to the projection factors. The right panel in Fig. 6 depicts a similar distribution, but with the radial velocity dispersion normalized over the total -luminosity of the group. The straight line corresponds to the case where the velocity dispersion is proportional to the linear size of the group, , and the integral luminosity of the group is proportional to its volume, .
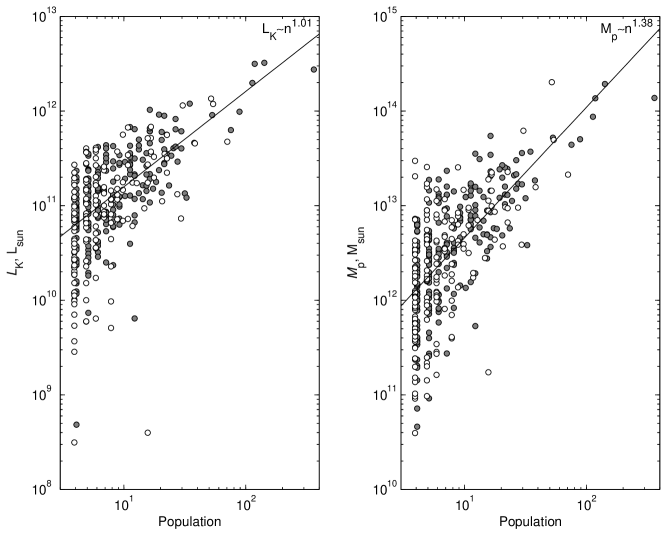
Fig. 7 shows how the total -luminosity (left) and projected mass (right) change with an increasing number of group members. Solid and open circles denote, respectively, the systems with a bulge-dominated and disc-shaped main members. The straight lines in the panels correspond to the linear regressions: and , different slopes of which indicate that the mass of the group grows with the population faster than its luminosity. It might imply that either the baryon fraction is lower in more massive groups or, more plausibly, that the cumulative star-formation efficiency is lower.
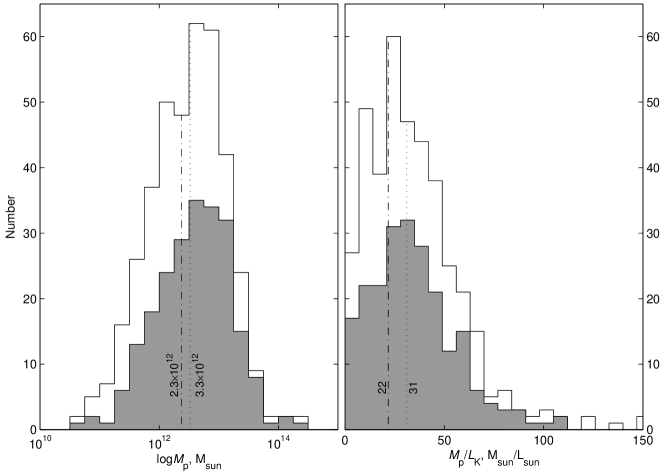
As we have noted, modern optical surveys provide an insufficient accuracy of radial velocity measurements even for relatively nearby galaxies. This is reflected in a noticeable way on the estimates of group masses. A histogram of the distribution of the number of groups over the logarithm of the projected mass is demonstrated in the left panel of Fig. 8. The distribution has a fairly symmetrical shape with the median . Here the median mass of the groups which are dominated by early-type galaxies (the grey part of the histogram) amounts to . A transition to the unbiased mass estimates via a quadratic subtraction from of the velocity measurement errors reduces the median to . A similar effect manifests itself in the distribution of groups by the value of the projected mass-to-luminosity ratio (right panel in Fig. 8), where the medians of the biased and unbiased estimates are 31 and 22 , respectively. Thus, neglecting the real accuracy of galaxy velocity measurements, one overestimates the mass of groups on the average by 30 per cent. Someone might suspect the discrepancy between adopted value , based on training the group-finding algorithm in the Local Volume, and the derived value of from the groups found with this algorithm. There is no contradiction here. The criterion (3–4) does not use any assumptions about projection effects. These inequalities are true for observable values because projection only decreases real separation and velocity difference between galaxies. For virialized systems the projection factor is for criterion 3. Thus the expected value of is about 28 that is in good agreement with derived value of mass-to-light ratio.
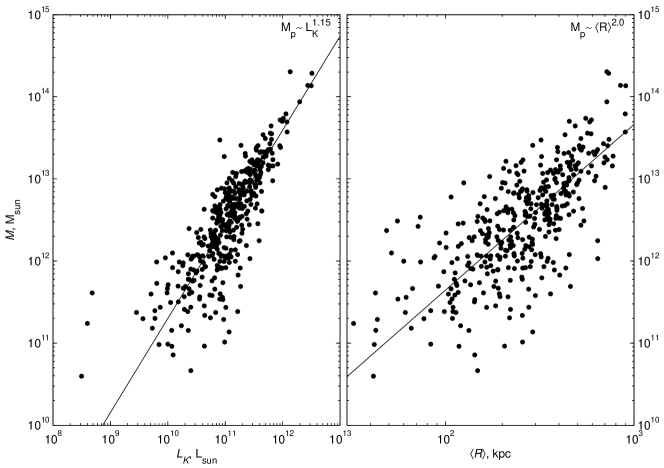
The relations between the projected mass of the group and its luminosity , as well as its linear size are represented in the panels of Fig. 9. The lines of robust regression weighted by dispersion of scatter in the left and right panels are and , respectively. Here the correlation of the mass with the linear size of a group is significantly less pronounced than with the luminosity.
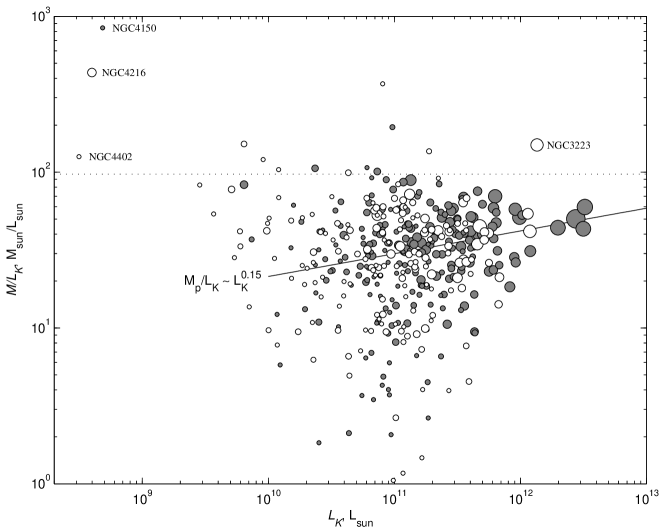
Fig. 10 demonstrates the distribution of 395 groups by the total luminosity and by the projected mass-to-luminosity ratio. The groups, where the dominant galaxy belongs to the early types are shown with solid circles, and the rest of groups — with open circles. The size of the circles is proportional to the group population. The horizontal dotted line captures the ratio , which corresponds to -luminosity density Mpc-3 (Jones et al., 2006) assuming Hubble constant km s-1 Mpc-1 and the cosmic parameter of matter density in the standard CDM model.
We can see that the region of low values is occupied by the groups with the population . An example of this is a group around the spiral galaxy NGC 660 with kpc and velocity dispersion of only 29 km s-1. In the region of high values there are 10 groups, most of which with members are in this region due to a random projection factors game. In fact, only one group in the zone : NGC 3223 (Antlia) is a massive group (cluster) with a big number of measured radial velocities, n=53. In addition, the region of values contains three groups with low luminosities: NGC 4216 (n=16), NGC 4402 (n=4) and NGC 4150 (n=4). The first two groups are located in the Virgo cluster core and have mean radial velocities of km s-1 and km s-1, respectively. Consistent with these velocities, the distances and luminosity of these groups are anomalously low, what led to their fictitiously high ratios. The disadvantage of our algorithm, where the distance of a group is determined by the mean radial velocity of its galaxies, is most pronounced in the regions with large peculiar motions. Some groups we identified in the Virgo cluster core are, most probably, false groups, rather than physical subsystems in the Virgo cluster. The highest value falls within the group of 5 galaxies around NGC 4150 in the Coma I region. The mean radial velocity of the group, km s-1, corresponds to the distance of 2.9 Mpc, whereas the individual distances of NGC 4150 and the other members are 4–5 times more distant. It is likely that these galaxies with low radial velocities have a large component of peculiar velocity, moving towards the Virgo cluster.
The line on Fig. 10 corresponds to correlation between mass and luminosity from Fig. 9. It shows that the mass-luminosity ratio of a group on the average increases from poor to rich groups. Interestingly, its intersection with the line can occur for group with luminosity , which is comparable with total luminosity of the Local Supercluster.
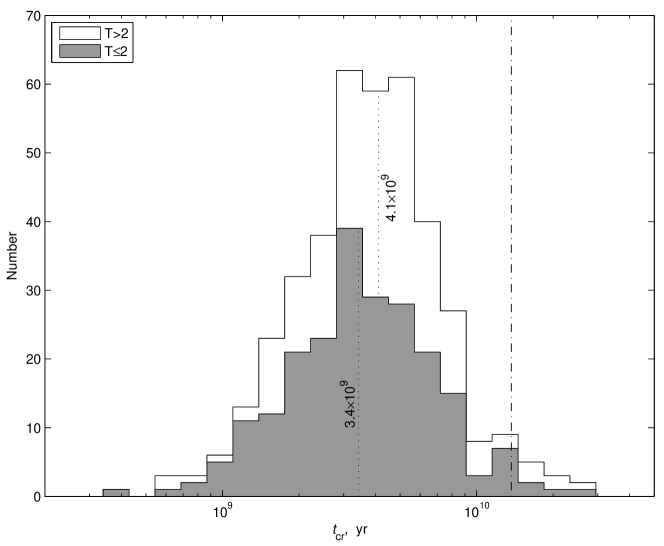
An important parameter of galaxy system is the crossing time. Taking into account the effects of projection the crossing time is
| (6) |
where the mean projected pairwise separation, , is characteristic size and the velocity dispersion, , is characteristic inner motion in the group. The distribution of 395 groups by , presented in Fig. 11, has a fairly symmetrical shape with the median at 3.8 Gyr. The groups with a dominant E, S0, Sa galaxy (hatched) are characterized by a slightly shorter crossing time (3.4 Gyr) than the others (4.1 Gyr). Only 3 per cent of groups fall into the region Gyr. The correction for velocity error increases this value up to 19 per cent. Consequently, the essential fraction of the groups selected by our criterion can be considered as dynamically evolved systems.
6 Discussion
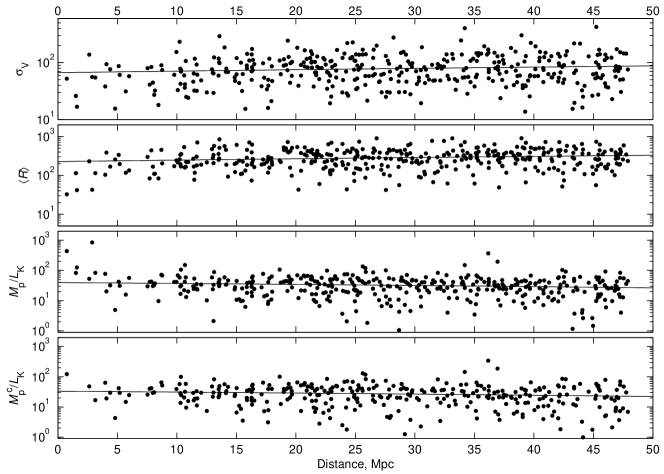
As the data in Fig. 12 show, the radial velocity dispersion and the linear diameter of group trend to increase slightly with distance. However, the mean projected mass-to-luminosity ratio (corrected or uncorrected for velocity measurement errors) practically does not depend on the distance. In other words, the physical requirements we used for galaxy clustering (the negative value of the total energy of a virtual pair, and its component separation to be within the radius of the zero-velocity surface) appear to be weakly sensitive to a loss of dwarf galaxies, which increases with a distance. Therefore, our criterion does not need special tuning of dimensionless parameter as a function of the group distance.
It should be remind that the population of groups , presented in our catalogue, corresponds to the number of group members with already measured radial velocities. Besides these galaxies, the group volume may contain a lot of dwarf galaxies without radial velocity estimates. Such dwarf systems (dSph and dIrr), usually having a low surface brightness, were found in large quantities in nearby ( Mpc) groups by Karachentseva & Karachentsev (1998); Karachentsev & Karachentseva (2004); Karachentsev et al. (2007) at the visual examination of the POSS-II prints. Recently, Eigenthaler & Zeilinger (2010) used the SDSS survey data to search for dwarf members of the NGC 5846 group. Mahdavi et al. (2005); Tully & Trentham (2008); Trentham & Tully (2009) looked for the dwarf population in the groups NGC 5846, NGC 5353/4 and NGC 1023, using high-resolution images taken with the MegaCam CCD camera on the CFHT telescope. A large number of dwarf members in the Virgo and Fornax clusters were found by Binggeli et al. (1985); Ferguson (1989); Ferguson & Sandage (1990); Mieske et al. (2007). The physical membership of these objects needs to be confirmed via the distance and/or radial velocity measurements. A consolidated list of the most probable dwarf galaxies in the nearby groups from our catalogue as potential targets for measuring new radial velocities is under preparation by Karachentseva et al. (2011).
A comparison of galaxy membership in our groups with its affiliation in groups in other catalogues is quite difficult to perform due to essential differences in the volumes of space covered by different catalogues, as well as the sets of original data on radial velocities of galaxies used, which are rapidly growing with time. Nevertheless, well-known groups, such as NGC 5371, NGC 5846, show a fairly detailed agreement in their member composition.
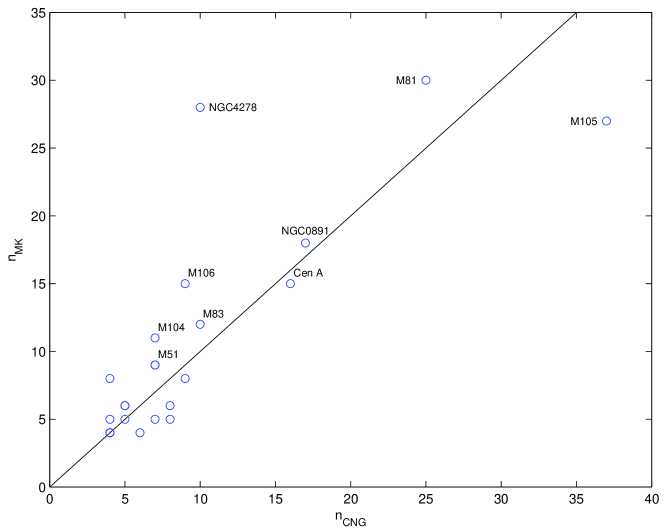
Using the data of ‘A Catalog of Neighboring Galaxies’ (CNG) (Karachentsev et al., 2004), which presents individual distances to many galaxies with Mpc, and indicates in the comments their membership in the nearby groups, we compared the populations of these groups in the old () and new ) catalogues. As we can see from Fig. 13, for the majority of 23 nearby groups there is a good agreement between the numbers of group members. An exception is a group of galaxies NGC 4278 (Coma I), which is located in a complex region near Virgo, where several groups overlap at the equator of the Local Supercluster and a significant role is played by the Virgocentric infall effect. It should be emphasized, however, that a comparison we made generally refers to a rather ‘cold’ region of the Local Volume. An application of our algorithm to the cluster zones (Virgo, Fornax) with large non-Hubble velocities can generate fictitious, phantom groups.
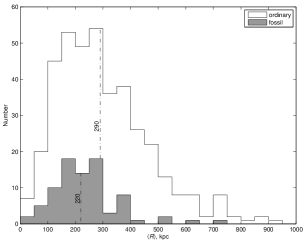
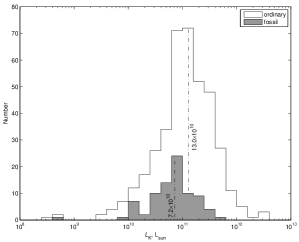
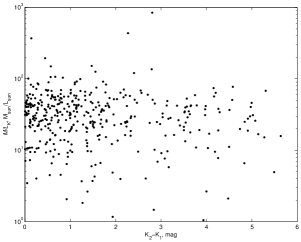
Some authors (Jones et al., 2003; Díaz-Giménez et al., 2008; von Benda-Beckmann et al., 2008) propose to distinguish a special category of ‘fossil’ groups, where the main galaxy significantly surpasses all the other members on the luminosity scale. The dynamical evolution of such groups could have evolved on a different scenario than that of other groups. An example of a ‘fossil’ group in the Local Volume can be a group of companions around M 104 (Sombrero), where the K-magnitude difference between the second and the first brightest galaxies is , or M 101 with the difference of . The NGC 2903 group has the biggest difference in the Local Volume, . The groups around M 51 (), NGC 4244 , NGC 55 , Cen A and M 81 are located at the opposite end of the scale in the Local Volume. If we attribute as fossil groups those with , then our catalogue contains 81 such groups or 21 per cent of their total number. Two upper panels in Fig. 14 show the distribution of 395 groups by linear size and integral luminosity . Here the fossil groups are given in grey. The third panel exhibits a relation between the projected mass-to-luminosity ratio and . The fossil groups with tend to have a bit lower mean size, luminosity and ratio than the others.
As noted above, our algorithm of galaxy clustering is not entirely reliable in the ‘hot’ areas with large non-Hubble motions. In the Virgo as in the core of the Local Supercluster our criterion identifies 46 groups and pseudogroups. At a lower density contrast with the parameter they all merge into the association M 49, which is easily tracked in column (12) Table 1. In general this association (i.e., the Virgo cluster) contains 1558 galaxies with a total luminosity of and the projected mass sum of . This mass is close to the total virial mass of Virgo as a single dynamic aggregate according to Hoffman et al. (1980); Tully & Shaya (1984); Tonry et al. (2000). Note as well that for the conglomerate of the groups identified by us in the Virgo cluster, the ratio practically coincides with the virial estimate , obtained by McLaughlin (1999) within the radius 1.8 Mpc.
In the region of another nearby cluster, Fornax, our algorithm identifies 27 multiple systems with the total number of members equal to 379, which at the low density contrast () join into the association NGC 1399=Fornax (see the last column of Table 1). The total luminosity of the Fornax+Eridanus association is , and the sum of projected masses of 27 systems is . The ratio of these quantities, is somewhat higher than the ratio , obtained by Desai et al. (2004) for the Fornax cluster itself at and .
We assume that among the 27 multiple systems identified by us in the Fornax+Eridanus region, the majority are real substructures of the complex that have not yet reached dynamic equilibrium. Interestingly, the group NGC 1386 with the mean radial velocity km has the greatest value in the complex, . The corresponding Hubble distance to the group is 10.3 Mpc. However, Tonry et al. (2001) determined the individual distances to three galaxies in this group: NGC 1386, NGC 1395 and E 358–59, and the mean distance deduced from them is Mpc. Obviously this group is falling from the far side onto the Fornax cluster. With a more precise distance, the projected mass-to-luminosity ratio of NGC 1386 group drops to 57 .
A comparison between two rich complexes in the Virgo and Fornax+Eridanus yielded the ratio of the galaxy number in them as 4.1, the ratio of the total K-luminosities as 2.7, and the ratio of projected masses as 2.8. As a curiosity, note that Crook et al. (2007) estimated the ratio of the projected masses as , what is contrary to numerous observational data.
As the most massive structure within the distance of Mpc, the Virgo cluster amounts to 18 per cent of galaxies in this volume, 15 per cent of the total -luminosity and 15 per cent of the projected mass. Such a proportion of baryons as well as dark matter contained in rich clusters is quite consistent with the generally accepted ideas.
In Table 1 the group of 9 galaxies around M 51 stands out among the remaining 394 groups due to its weak isolation. The clustering of galaxies into associations at a low density contrast results in a sharp increase in the number of galaxies, joining this group. Being a group of middle compactness with kpc, and uniting with other groups: NGC 4244, NGC 4258, NGC 4490, NGC 4736, the M 51 group turns at into an extended association with 405 members, the total -luminosity of and the ratio of the projected mass sum to the sum of group luminosities . This loose formation became known in the literature as a Cloud of Galaxies in the Canes Venatici, CVn I.
7 Budget of cosmic matter in the Local universe
The data on galaxies in groups, pairs and in the field available at our disposal allow making judgements on the principal features of the distribution of bright and dark matter in the Local universe with the diameter of 80–90 Mpc. On this scale we expect to reach the mean density of the Universe with accuracy about 15 per cent (Pápai & Szapudi, 2010).
Fig. 15 reproduces the distribution of matter in the Local Supercluster and its environs, projected onto the planes {SGX,SGY} and {SGY,SGZ} in the Cartesian supergalactic coordinates. The distance scale is shown by concentric rings around the Local Group with a step of 10 Mpc. The horizontal cones in the left figure are formed by the ‘Zone of Avoidance’ at the galactic latitudes . The Virgo cluster with the adjacent ridges is located up from the centre at a distance of Mpc. There is a chain of groups/clusters: Antlia, Hydra, Centaurus seen to the left from Virgo. This structure extends outside the figure’s limits towards the region of the so-called Great Attractor. The Local Void as a zone of low density is seen on the upper side (+Z) of the right panel, adjoining with the cone caused by the Galactic extinction. The surface -luminosity density in the units of Mpc2 is shown in grey scale.
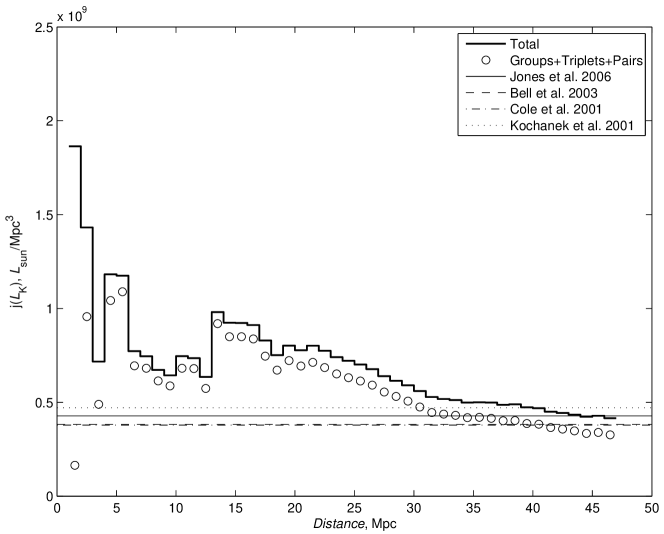
Fig. 16 shows the variation of mean density of -luminosity in the sphere with the radius and a step of 1 Mpc. The circles mark the values of the integral luminosity density of the galaxies belonging to our groups, triplets and pairs. The histogram reflects the course of the mean density with distance for all the galaxies, including the galaxies of the field. The solid, dashed and dotted horizontal lines mark the level of the mean cosmic -band luminosity density according to Jones et al. (2006); Bell et al. (2003); Cole et al. (2001); Kochanek et al. (2001), who used the 2MASS survey data, but with slightly different assumptions on the proportion of light absorbed by dust inside the galaxies. Within the 40 Mpc radius sphere, the mean density of -luminosity according to our data amounts to Mpc-3 versus the estimates of the mean space density Mpc-3 from the above sources.
Note that in this volume the total -luminosity of the galaxies associated into the systems of different multiplicity amounts to 82 per cent of the luminosity of all galaxies. In other words, only 18 per cent of stellar baryons are located outside the boundaries of the virial zones of the galaxy systems. This is in good accordance with luminosity function measurements in groups and overall. For instance, using the data of (Blanton et al., 2003) on total luminosity density and (Zandivarez et al., 2006) on luminosity function in groups from SDSS survey and taking into account the fraction of galaxies in groups (54 per cent), we receive that only 20 per cent of the total light is associated with field galaxies. Comparing the proportion of clustered luminosity in the -band (82 per cent) with the relative number of clustered galaxies (54 per cent), we conclude that the degree of crowding in dwarf galaxies is significantly lower than that in the galaxies with high -luminosity.
Another feature of the Local universe is revealed in that the approximation of the mean stellar density with increasing to its asymptotic cosmic value occurs exactly from the top, i.e. the broad LG neighbourhood represents a vast zone of overdensity. At that, the fluctuations occur even on the scales of Mpc.


The distribution of mean density of matter in the Local universe is shown in two panels of Fig. 17 in the units of critical density. The contribution of the masses produced by pairs and triplets of galaxies from the catalogues of Karachentsev & Makarov (2008); Makarov & Karachentsev (2009) is shown by the triangles, and the contribution of the masses of groups with a population of is marked by the squares. Apart from the group members, we have to take into account the contribution to the total mass made by the field galaxies. As noted above, their relative number amounts to 46 per cent, and relative luminosity in the -band is only 18 per cent. We believe that the isolated galaxies differ little in their physical properties from the galaxies in binary or triple systems, as corroborated by the mass estimates from the effects of weak gravitational lensing (Mandelbaum et al., 2006). Attributing to the isolated galaxies the same total mass-luminosity ratios as those possessed by the components of low-multiplicity systems, we have depicted the behaviour of the total matter density in the volumes of radii in the form of a histogram. Compiling the catalogues of groups, triplets and pairs of galaxies, we were limited by the systems, the mean radial velocities of which satisfy the condition km s-1, to which at km s-1Mpc-1 corresponds the distance of =47.9 Mpc. However, in the process of galaxy clustering we took into account the galaxies beyond this volume with km s-1. Therefore, the values of in the Mpc distance range can be regarded as not highly susceptible to various boundary effects. The histogram in the top panel of Fig. 17 shows that the mean local density of matter within the distance of 40–47 Mpc amounts to .
As noted above, the galaxy redshift surveys (CfA, 2dF, 6dF, SDSS) contain a ‘noise’ component km s-1, induced by the velocity measurement errors. It affects the mass estimates in an asymmetric way, overestimating them on the average by 30 per cent. The distribution of the mean density of matter, based on the statistically unbiased estimates of the projected mass is presented in the bottom panel of Fig. 17. The designations here are the same as those on the top panel. In the volumes of radii from 40 to 47 Mpc the mean corrected values of the local density of matter lie in the range of , which is 3–4 times lower than the global cosmological density in the standard CDM model (Fukugita & Peebles, 2004).
In addition to the galaxy velocity measurement errors, there is another source of uncertainty in the estimation of the local value of . As we have noted, the clustering algorithm we used does not work reliably enough in the regions of large non-Hubble motions. Summing the mass of groups we identified in the Virgo cluster volume (), we found that it was smaller than the virial mass estimate . In the case of the Fornax cluster, the total mass of the groups turned out to be larger than the virial mass ( versus ). Therefore, at the total mass of the local sphere with the radius of 40 Mpc equal to (, the errors of mass determination result in the error in the estimations of less than 10 per cent.
Another reason, distorting the local estimate of , can be the fact that we neglected the galaxies that do not yet have their radial velocities measured. In order to determine the significance of their contribution, we assumed that the luminosity function of galaxies is described by the Schechter (1976) function with the parameters and (Bell et al., 2003; Cole et al., 2001). In the galaxy redshift surveys (6dF, SDSS) the completeness of radial velocity measurements is assured up to the limiting apparent magnitude . At the boundary of the volume under consideration (40–47) Mpc, this corresponds to the absolute magnitude of , by fainter than . With the above parameters of the luminosity function, the contribution of the fainter galaxies in the integral luminosity on the edge of the considered volume is only about 12 per cent. In general, the correction to the mean luminosity density over the entire volume is less than 10 per cent. Consequently, the neglect of galaxies without measured radial velocities, and an imperfection of the group criterion we used may not be the causes of such a strong difference in the estimates of local and global densities of matter.
8 Concluding remarks
The main objective of our work was to create a catalogue of galaxy groups, covering the entire sky and extending up to the distances of 40–45 Mpc from the Local Group. To this end, we used the clustering algorithm that takes into account individual characteristics of galaxies. Applying this criterion to the observational data on 10914 galaxies with the velocities km s-1, we have identified 509 pairs, 168 triple systems and 395 groups with the populations of four or more members. Totally these samples include 54 per cent of all galaxies, or 82 per cent of the total luminosity of the Local universe of the given volume. At that, we have not used any special conditions that would restrict the initial sample of galaxies by morphological type or other characteristics (apart from the availability of radial velocity measurements). Minimal selectivity of our sample makes it attractive for the analysis of various properties of galaxy systems depending on their environment.
We consider that the most important result here is the estimation of the mean density of matter in the Local universe. According to our data, its value amounts to in the spherical volume with the diameter of 80–90 Mpc. As noted above, the low estimates of also follow from the virial masses in galaxy groups derived from the lists by Vennik (1984); Tully (1988); Magtesyan (1988). In a recent paper by Crook et al. (2007) the estimates of were obtained ranging from 0.10 to 0.23, depending on the choice of parameters for galaxy association into groups, and on the way of computing the virial masses of groups. Earlier, Bahcall et al. (2000) studied the published estimates of the mass-luminosity ratio in the groups and clusters, and deduced the value . Recently, Abate & Erdoğdu (2009) analysed the peculiar velocity field for the 2MASS galaxies, using the SFI++ survey data (Springob et al., 2007), and concluded that in the Local universe with a characteristic scale of km s-1 the density of matter lies within the interval of .
At least, three different ideas can be proposed to explain the drastic difference between the local and the global estimates of .
-
1.
Dark matter in groups and clusters extends far beyond their virial radius traced by galaxies. To reduce the discrepancy, one ought to assume that the total mass of each group and cluster is about 3 times its virial mass. However, as it was shown by Karachentsev (2005); Karachentsev & Nasonova (2010); Nasonova et al. (2011), the total mass of nearby groups and Virgo, Fornax clusters within the radius of zero velocity surface is almost the same as their virial mass. Note that is . Therefore, the existence of large amount of dark matter at periphery of systems is inconsistent with the observational data.
-
2.
One can image a possibility that the local Universe is significantly (3 times) under-dense relative to the global density. The largest structure in the Universe detected to date is the Sloan Great Wall, filamentary aggregation of galaxies of 450 Mpc long, at distance of 310 Mpc (Gott et al., 2005). In principle, we can reside in a “valley” between such kind large scale walls. But, Fig. 16 tells us that we are living in the luminous matter overdensity extending till to about 40 Mpc. Of course, this local overdensity can be only a peak surrounded by wider under-dense region. However, numerous -band counts of galaxies in the range of (Djorgovski et al., 1995; Bershady et al., 1998; Huang et al., 2001; Totani et al., 2001) do not show the presence of any significant cosmic lacuna around us within Mpc.
-
3.
It is possible that essential part of dark matter in the Universe (about 2/3) is scattered outside virial (and even collapsing) regions being concentrated in dark clumps or distributed as a homogeneous dark “sea”. Some observational arguments favourable to the existence of massive dark clumps have been presented by Natarajan & Springel (2004); Jee et al. (2005) from weak lensing, and by Karachentsev et al. (2006) from properties of disturbed isolated galaxies.
Acknowledgments
The authors are grateful to V.E. Karachentseva for the great work on the verification and refinement of the original observational data. We are thankful to Brent Tully, Stefan Gottlöber and Helene Courtois for discussions and useful comments. We acknowledge the usage of the HyperLEDA database333http://leda.univ-lyon1.fr. This research has made use of the NASA/IPAC Extragalactic Database444http://nedwww.ipac.caltech.edu/ which is operated by the Jet Propulsion Laboratory, California Institute of Technology, under contract with the National Aeronautics and Space Administration. We acknowledge the usage of the HIPASS public data release555http://www.atnf.csiro.au/research/multibeam/release/. This work was supported by the RFBR grants 10–02–00123, 08–02–00627, RUS-UKR 09–02–90414.
References
- Abate & Erdoğdu (2009) Abate A., Erdoğdu P., 2009, MNRAS, 400, 1541
- Abazajian et al. (2009) Abazajian K. N., Adelman-McCarthy J. K., Agüeros M. A., Allam S. S., Allende Prieto C., An D., Anderson K. S. J., Anderson S. F., Annis J., Bahcall N. A., Bailer-Jones C. A. L., Barentine J. C., Bassett B. A., Becker A. C., Beers T. C., Bell E. F., Belokurov V., Berlind A. A., Berman E. F., Bernardi M., Bickerton S. J., Bizyaev D., Blakeslee J. P., Blanton M. R., Bochanski J. J., Boroski W. N., Brewington H. J., Brinchmann J., Brinkmann J., Brunner R. J., Budavári T., Carey L. N., Carliles S., Carr M. A., Castander F. J., Cinabro D., Connolly A. J., Csabai I., Cunha C. E., Czarapata P. C., Davenport J. R. A., de Haas E., Dilday B., Doi M., Eisenstein D. J., Evans M. L., Evans N. W., Fan X., Friedman S. D., Frieman J. A., Fukugita M., Gänsicke B. T., Gates E., Gillespie B., Gilmore G., Gonzalez B., Gonzalez C. F., Grebel E. K., Gunn J. E., Györy Z., Hall P. B., Harding P., Harris F. H., Harvanek M., Hawley S. L., Hayes J. J. E., Heckman T. M., Hendry J. S., Hennessy G. S., Hindsley R. B., Hoblitt J., Hogan C. J., Hogg D. W., Holtzman J. A., Hyde J. B., Ichikawa S., Ichikawa T., Im M., Ivezić Ž., Jester S., Jiang L., Johnson J. A., Jorgensen A. M., Jurić M., Kent S. M., Kessler R., Kleinman S. J., Knapp G. R., Konishi K., Kron R. G., Krzesinski J., Kuropatkin N., Lampeitl H., Lebedeva S., Lee M. G., Lee Y. S., Leger R. F., Lépine S., Li N., Lima M., Lin H., Long D. C., Loomis C. P., Loveday J., Lupton R. H., Magnier E., Malanushenko O., Malanushenko V., Mandelbaum R., Margon B., Marriner J. P., Martínez-Delgado D., Matsubara T., McGehee P. M., McKay T. A., Meiksin A., Morrison H. L., Mullally F., Munn J. A., Murphy T., Nash T., Nebot A., Neilsen E. H., Newberg H. J., Newman P. R., Nichol R. C., Nicinski T., Nieto-Santisteban M., Nitta A., Okamura S., Oravetz D. J., Ostriker J. P., Owen R., Padmanabhan N., Pan K., Park C., Pauls G., Peoples J., Percival W. J., Pier J. R., Pope A. C., Pourbaix D., Price P. A., Purger N., Quinn T., Raddick M. J., Fiorentin P. R., Richards G. T., Richmond M. W., Riess A. G., Rix H., Rockosi C. M., Sako M., Schlegel D. J., Schneider D. P., Scholz R., Schreiber M. R., Schwope A. D., Seljak U., Sesar B., Sheldon E., Shimasaku K., Sibley V. C., Simmons A. E., Sivarani T., Smith J. A., Smith M. C., Smolčić V., Snedden S. A., Stebbins A., Steinmetz M., Stoughton C., Strauss M. A., Subba Rao M., Suto Y., Szalay A. S., Szapudi I., Szkody P., Tanaka M., Tegmark M., Teodoro L. F. A., Thakar A. R., Tremonti C. A., Tucker D. L., Uomoto A., Vanden Berk D. E., Vandenberg J., Vidrih S., Vogeley M. S., Voges W., Vogt N. P., Wadadekar Y., Watters S., Weinberg D. H., West A. A., White S. D. M., Wilhite B. C., Wonders A. C., Yanny B., Yocum D. R., York D. G., Zehavi I., Zibetti S., Zucker D. B., 2009, ApJS, 182, 543
- Bahcall et al. (2000) Bahcall N. A., Cen R., Davé R., Ostriker J. P., Yu Q., 2000, ApJ, 541, 1
- Barnes et al. (2001) Barnes D. G., Staveley-Smith L., de Blok W. J. G., Oosterloo T., Stewart I. M., Wright A. E., Banks G. D., Bhathal R., Boyce P. J., Calabretta M. R., Disney M. J., Drinkwater M. J., Ekers R. D., Freeman K. C., Gibson B. K., Green A. J., Haynes R. F., te Lintel Hekkert P., Henning P. A., Jerjen H., Juraszek S., Kesteven M. J., Kilborn V. A., Knezek P. M., Koribalski B., Kraan-Korteweg R. C., Malin D. F., Marquarding M., Minchin R. F., Mould J. R., Price R. M., Putman M. E., Ryder S. D., Sadler E. M., Schröder A., Stootman F., Webster R. L., Wilson W. E., Ye T., 2001, MNRAS, 322, 486
- Bell et al. (2003) Bell E. F., McIntosh D. H., Katz N., Weinberg M. D., 2003, ApJS, 149, 289
- Bershady et al. (1998) Bershady M. A., Lowenthal J. D., Koo D. C., 1998, ApJ, 505, 50
- Binggeli et al. (1985) Binggeli B., Sandage A., Tammann G. A., 1985, AJ, 90, 1681
- Binney & Merrifield (1998) Binney J., Merrifield M., 1998, Galactic astronomy, Binney, J. & Merrifield, M., ed.
- Blanton et al. (2003) Blanton M. R., Hogg D. W., Bahcall N. A., Brinkmann J., Britton M., Connolly A. J., Csabai I., Fukugita M., Loveday J., Meiksin A., Munn J. A., Nichol R. C., Okamura S., Quinn T., Schneider D. P., Shimasaku K., Strauss M. A., Tegmark M., Vogeley M. S., Weinberg D. H., 2003, ApJ, 592, 819
- Buzzoni (2005) Buzzoni A., 2005, MNRAS, 361, 725
- Cole et al. (2001) Cole S., Norberg P., Baugh C. M., Frenk C. S., Bland-Hawthorn J., Bridges T., Cannon R., Colless M., Collins C., Couch W., Cross N., Dalton G., De Propris R., Driver S. P., Efstathiou G., Ellis R. S., Glazebrook K., Jackson C., Lahav O., Lewis I., Lumsden S., Maddox S., Madgwick D., Peacock J. A., Peterson B. A., Sutherland W., Taylor K., 2001, MNRAS, 326, 255
- Colless et al. (2001) Colless M., Dalton G., Maddox S., Sutherland W., Norberg P., Cole S., Bland-Hawthorn J., Bridges T., Cannon R., Collins C., Couch W., Cross N., Deeley K., De Propris R., Driver S. P., Efstathiou G., Ellis R. S., Frenk C. S., Glazebrook K., Jackson C., Lahav O., Lewis I., Lumsden S., Madgwick D., Peacock J. A., Peterson B. A., Price I., Seaborne M., Taylor K., 2001, MNRAS, 328, 1039
- Crook et al. (2007) Crook A. C., Huchra J. P., Martimbeau N., Masters K. L., Jarrett T., Macri L. M., 2007, ApJ, 655, 790
- de Vaucouleurs et al. (1976) de Vaucouleurs G., de Vaucouleurs A., Corwin J. R., 1976, in Second reference catalogue of bright galaxies, 1976, Austin: University of Texas Press., pp. 0–+
- Desai et al. (2004) Desai V., Dalcanton J. J., Mayer L., Reed D., Quinn T., Governato F., 2004, MNRAS, 351, 265
- Díaz-Giménez et al. (2008) Díaz-Giménez E., Muriel H., Mendes de Oliveira C., 2008, A&A, 490, 965
- Djorgovski et al. (1995) Djorgovski S., Soifer B. T., Pahre M. A., Larkin J. E., Smith J. D., Neugebauer G., Smail I., Matthews K., Hogg D. W., Blandford R. D., Cohen J., Harrison W., Nelson J., 1995, ApJ, 438, L13
- Eigenthaler & Zeilinger (2010) Eigenthaler P., Zeilinger W. W., 2010, A&A, 511, A12+
- Ferguson (1989) Ferguson H. C., 1989, AJ, 98, 367
- Ferguson & Sandage (1990) Ferguson H. C., Sandage A., 1990, AJ, 100, 1
- Fukugita & Peebles (2004) Fukugita M., Peebles P. J. E., 2004, ApJ, 616, 643
- Fukugita et al. (1995) Fukugita M., Shimasaku K., Ichikawa T., 1995, PASP, 107, 945
- Giovanelli et al. (2005) Giovanelli R., Haynes M. P., Kent B. R., Perillat P., Saintonge A., Brosch N., Catinella B., Hoffman G. L., Stierwalt S., Spekkens K., Lerner M. S., Masters K. L., Momjian E., Rosenberg J. L., Springob C. M., Boselli A., Charmandaris V., Darling J. K., Davies J., Garcia Lambas D., Gavazzi G., Giovanardi C., Hardy E., Hunt L. K., Iovino A., Karachentsev I. D., Karachentseva V. E., Koopmann R. A., Marinoni C., Minchin R., Muller E., Putman M., Pantoja C., Salzer J. J., Scodeggio M., Skillman E., Solanes J. M., Valotto C., van Driel W., van Zee L., 2005, AJ, 130, 2598
- Gott et al. (2005) Gott III J. R., Jurić M., Schlegel D., Hoyle F., Vogeley M., Tegmark M., Bahcall N., Brinkmann J., 2005, ApJ, 624, 463
- Heisler et al. (1985) Heisler J., Tremaine S., Bahcall J. N., 1985, ApJ, 298, 8
- Hoffman et al. (1980) Hoffman G. L., Olson D. W., Salpeter E. E., 1980, ApJ, 242, 861
- Huang et al. (2001) Huang J., Thompson D., Kümmel M. W., Meisenheimer K., Wolf C., Beckwith S. V. W., Fockenbrock R., Fried J. W., Hippelein H., von Kuhlmann B., Phleps S., Röser H., Thommes E., 2001, A&A, 368, 787
- Huchra & Geller (1982) Huchra J. P., Geller M. J., 1982, ApJ, 257, 423
- Jarrett et al. (2000) Jarrett T. H., Chester T., Cutri R., Schneider S., Skrutskie M., Huchra J. P., 2000, AJ, 119, 2498
- Jarrett et al. (2003) Jarrett T. H., Chester T., Cutri R., Schneider S. E., Huchra J. P., 2003, AJ, 125, 525
- Jee et al. (2005) Jee M. J., White R. L., Benítez N., Ford H. C., Blakeslee J. P., Rosati P., Demarco R., Illingworth G. D., 2005, ApJ, 618, 46
- Jones et al. (2006) Jones D. H., Peterson B. A., Colless M., Saunders W., 2006, MNRAS, 369, 25
- Jones et al. (2004) Jones D. H., Saunders W., Colless M., Read M. A., Parker Q. A., Watson F. G., Campbell L. A., Burkey D., Mauch T., Moore L., Hartley M., Cass P., James D., Russell K., Fiegert K., Dawe J., Huchra J., Jarrett T., Lahav O., Lucey J., Mamon G. A., Proust D., Sadler E. M., Wakamatsu K., 2004, MNRAS, 355, 747
- Jones et al. (2003) Jones L. R., Ponman T. J., Horton A., Babul A., Ebeling H., Burke D. J., 2003, MNRAS, 343, 627
- Karachentsev (1994) Karachentsev I., 1994, Astronomical and Astrophysical Transactions, 6, 1
- Karachentsev (2005) Karachentsev I. D., 2005, AJ, 129, 178
- Karachentsev & Karachentseva (2004) Karachentsev I. D., Karachentseva V. E., 2004, Astronomy Reports, 48, 267
- Karachentsev et al. (2006) Karachentsev I. D., Karachentseva V. E., Huchtmeier W. K., 2006, A&A, 451, 817
- Karachentsev et al. (2007) —, 2007, Astronomy Letters, 33, 512
- Karachentsev et al. (2004) Karachentsev I. D., Karachentseva V. E., Huchtmeier W. K., Makarov D. I., 2004, AJ, 127, 2031
- Karachentsev & Kutkin (2005) Karachentsev I. D., Kutkin A. M., 2005, Astronomy Letters, 31, 299
- Karachentsev & Makarov (2008) Karachentsev I. D., Makarov D. I., 2008, Astrophysical Bulletin, 63, 299
- Karachentsev et al. (2008) Karachentsev I. D., Makarov D. I., Karachentseva V. E., Melnik O. V., 2008, Astronomy Letters, 34, 832
- Karachentsev et al. (2009) Karachentsev I. D., Makarov D. I., Karachentseva V. E., Melnyk O. V., 2009, ArXiv e-prints
- Karachentsev & Nasonova (2010) Karachentsev I. D., Nasonova O. G., 2010, MNRAS, 405, 1075
- Karachentseva & Karachentsev (1998) Karachentseva V. E., Karachentsev I. D., 1998, A&AS, 127, 409
- Karachentseva & Karachentsev (2000) —, 2000, A&AS, 146, 359
- Karachentseva et al. (2011) Karachentseva V. E., Melnyk O. V., Karachentsev I. D., Makarov D. I., 2011, in preparation
- Kochanek et al. (2001) Kochanek C. S., Pahre M. A., Falco E. E., Huchra J. P., Mader J., Jarrett T. H., Chester T., Cutri R., Schneider S. E., 2001, ApJ, 560, 566
- Magtesyan (1988) Magtesyan A. P., 1988, Astrophysics, 28, 150
- Mahdavi et al. (2005) Mahdavi A., Trentham N., Tully R. B., 2005, AJ, 130, 1502
- Maia et al. (1989) Maia M. A. G., da Costa L. N., Latham D. W., 1989, ApJS, 69, 809
- Makarov & Karachentsev (2000) Makarov D. I., Karachentsev I. D., 2000, in Astronomical Society of the Pacific Conference Series, Vol. 209, IAU Colloq. 174: Small Galaxy Groups, M. J. Valtonen & C. Flynn, ed., pp. 40–+
- Makarov & Karachentsev (2009) —, 2009, Astrophysical Bulletin, 64, 24
- Mandelbaum et al. (2006) Mandelbaum R., Seljak U., Kauffmann G., Hirata C. M., Brinkmann J., 2006, MNRAS, 368, 715
- Materne (1978) Materne J., 1978, A&A, 63, 401
- Materne (1979) —, 1979, A&A, 74, 235
- McLaughlin (1999) McLaughlin D. E., 1999, ApJ, 512, L9
- Mieske et al. (2007) Mieske S., Hilker M., Infante L., Mendes de Oliveira C., 2007, A&A, 463, 503
- Nasonova et al. (2011) Nasonova O. G., Peirani S., de Freitas Pacheco J. A., 2011, in preparation
- Natarajan & Springel (2004) Natarajan P., Springel V., 2004, ApJ, 617, L13
- Pápai & Szapudi (2010) Pápai P., Szapudi I., 2010, ArXiv e-prints
- Paturel et al. (2003) Paturel G., Petit C., Prugniel P., Theureau G., Rousseau J., Brouty M., Dubois P., Cambrésy L., 2003, A&A, 412, 45
- Sandage (1986) Sandage A., 1986, ApJ, 307, 1
- Schechter (1976) Schechter P., 1976, ApJ, 203, 297
- Schlegel et al. (1998) Schlegel D. J., Finkbeiner D. P., Davis M., 1998, ApJ, 500, 525
- Spergel et al. (2007) Spergel D. N., Bean R., Doré O., Nolta M. R., Bennett C. L., Dunkley J., Hinshaw G., Jarosik N., Komatsu E., Page L., Peiris H. V., Verde L., Halpern M., Hill R. S., Kogut A., Limon M., Meyer S. S., Odegard N., Tucker G. S., Weiland J. L., Wollack E., Wright E. L., 2007, ApJS, 170, 377
- Springob et al. (2007) Springob C. M., Masters K. L., Haynes M. P., Giovanelli R., Marinoni C., 2007, ApJS, 172, 599
- Tonry et al. (2000) Tonry J. L., Blakeslee J. P., Ajhar E. A., Dressler A., 2000, ApJ, 530, 625
- Tonry et al. (2001) Tonry J. L., Dressler A., Blakeslee J. P., Ajhar E. A., Fletcher A. B., Luppino G. A., Metzger M. R., Moore C. B., 2001, ApJ, 546, 681
- Totani et al. (2001) Totani T., Yoshii Y., Maihara T., Iwamuro F., Motohara K., 2001, ApJ, 559, 592
- Trentham & Tully (2009) Trentham N., Tully R. B., 2009, MNRAS, 398, 722
- Tully (1987) Tully R. B., 1987, ApJ, 321, 280
- Tully (1988) —, 1988, Nearby galaxies catalog, Tully, R. B., ed.
- Tully & Fisher (1977) Tully R. B., Fisher J. R., 1977, A&A, 54, 661
- Tully & Shaya (1984) Tully R. B., Shaya E. J., 1984, ApJ, 281, 31
- Tully & Trentham (2008) Tully R. B., Trentham N., 2008, AJ, 135, 1488
- Vennik (1984) Vennik J., 1984, Tartu Astrofuusika Observatoorium Teated, 73, 1
- Vennik (1987) —, 1987, Dissertation. Tartu
- von Benda-Beckmann et al. (2008) von Benda-Beckmann A. M., D’Onghia E., Gottlöber S., Hoeft M., Khalatyan A., Klypin A., Müller V., 2008, MNRAS, 386, 2345
- Zandivarez et al. (2006) Zandivarez A., Martínez H. J., Merchán M. E., 2006, ApJ, 650, 137