Quantitative Analysis of Bloggers Collective Behavior Powered by Emotions
Abstract
Large-scale data resulting from users online interactions provide the ultimate source of information to study emergent social phenomena on the Web. From individual actions of users to observable collective behaviors, different mechanisms involving emotions expressed in the posted text play a role. Here we combine approaches of statistical physics with machine-learning methods of text analysis to study emergence of the emotional behavior among Web users. Mapping the high-resolution data from digg.com onto bipartite network of users and their comments onto posted stories, we identify user communities centered around certain popular posts and determine emotional contents of the related comments by the emotion-classifier developed for this type of texts. Applied over different time periods, this framework reveals strong correlations between the excess of negative emotions and the evolution of communities. We observe avalanches of emotional comments exhibiting significant self-organized critical behavior and temporal correlations. To explore robustness of these critical states, we design a network automaton model on realistic network connections and several control parameters, which can be inferred from the dataset. Dissemination of emotions by a small fraction of very active users appears to critically tune the collective states.
pacs:
05.65.+b; 89.20.Hh; 07.05.Tb; 89.75.Fb1 Introduction
Online social interactions among users of different Web portals, which are mediated by the posted material (text on blogs, pictures, movies, etc.), or via direct exchange of messages on friendship networks, represent a prominent way of human communications. It has been recognized recently [1, 2] that the unsupervised online interactions, involving ever larger number of users through the self-organized dynamics may lead to new social phenomena on the Web. Understanding the emergent collective behavior of users thus appears as one of the central topics of the contemporary science of the Web, beside the structure and the security issues [2, 3].
Role of emotions known in conventional social contacts has been increasingly perceived in the Web-based communications. The empirical analysis of sentiment and mood, and opinion mining through user-generated textual data are currently developing research fields [4, 5, 6]. Different dimensions of the emotional state, i.e., arousal, valence and dominance of an individual user can be measured in the laboratory [6]. The amount of emotions expressed in a written text and transfered from/to a user have been studied [7, 6]. On the other hand, methods are devised to measure group emotional states and public mood, e.g., related to a given event [8, 9]. However, the emergence of the collective emotional states from the actions of individual users over time is a nonlinear dynamical process, that has not been well understood.
Physics and computer science research of the Web have been independently developing own methodologies and goals. For instance, large efforts in the computer science are devoted to improve the algorithms to retrieve information and sentiment from written text [10, 7]. Different methods have been developed for social sciences to analyze particular phenomena [11, 12, 13]. Whereas, physics research is chiefly focused on the underlying processes from the perspective of complex dynamical systems [14, 15, 16]. The quantitative approaches are based on the network representations and application of the graph theory (for a recent review see [17]).
Here we use the theory of complex networks and the methods of statistical physics of self-organized dynamical phenomena, which we combine with recent developments in computer science focused towards the emotion contents of the text, and study the emergence of collective emotional states among Web users. This combined research framework offers new insight into genesis and structure of the collective emotional states. At the same time it introduces a set of quantitative measures and parameters which characterize users behavior and can be inferred from the information embedded in the original data. For further understanding of the observed collective states, we design a network-automaton model on the realistic network structure, within which we tune the control parameters of the dynamics and monitor their effects.
The organization of the paper is as follows. In section 2 we explain our methodology and the structure collected data needed for the quantitative analysis of this type. In section 3 we define the quantities necessary to characterize the collective emotional states of users and perform the systematic analysis of the data to determine these quantities. In section 4 the network-automaton model is introduced and its parameters estimated from the empirical data. The results of simulations are presented. Finally, a short summary and conclusions are given in section 5. Some related technical details are given in the appendix.
2 Data Structure and Methodology
Fine structure of the data is required for this type of analysis. Specifically, we consider a large dataset collected from digg.com, described in the Appendix. Typically, a user posts a story by providing a link to other media and offering a short description. Then all users may read the story as well as already existing comments, and post own comments, dig (approve), or bury (disapprove) the story. Each user has a unique ID. Every action of a user is registered with high temporal resolution and clearly attributed to the post (main story) and/or to a given comment on that story. Our data also contain full text of all comments.
Developing an emotion classifier, which is based on machine-learning methods [18] and trained on large dataset of blog texts (see more details in the Appendix), we determine the emotional content of each comment in our dataset. In particular, a probability is determined for each text to be classified first as either subjective, i.e., having emotional content, or otherwise objective. Then the subjective texts are further classified for containing either negative or positive emotional content. Owing to the high resolution of our data, we are able to study quantitatively the temporal evolution of connected events and determine how the emotions expressed in user’s comments affect it. Here we are particularly interested in the collective dynamical effects that emerge through the actions of individual users. For this purpose we select a subset consisting of popular posts with large number of comments, on which we find over 50% comment-on-comment actions. The dataset, termed discussion-driven-Diggs (ddDiggs), consists of =3984 stories on which =917708 comments are written by =82201 users.
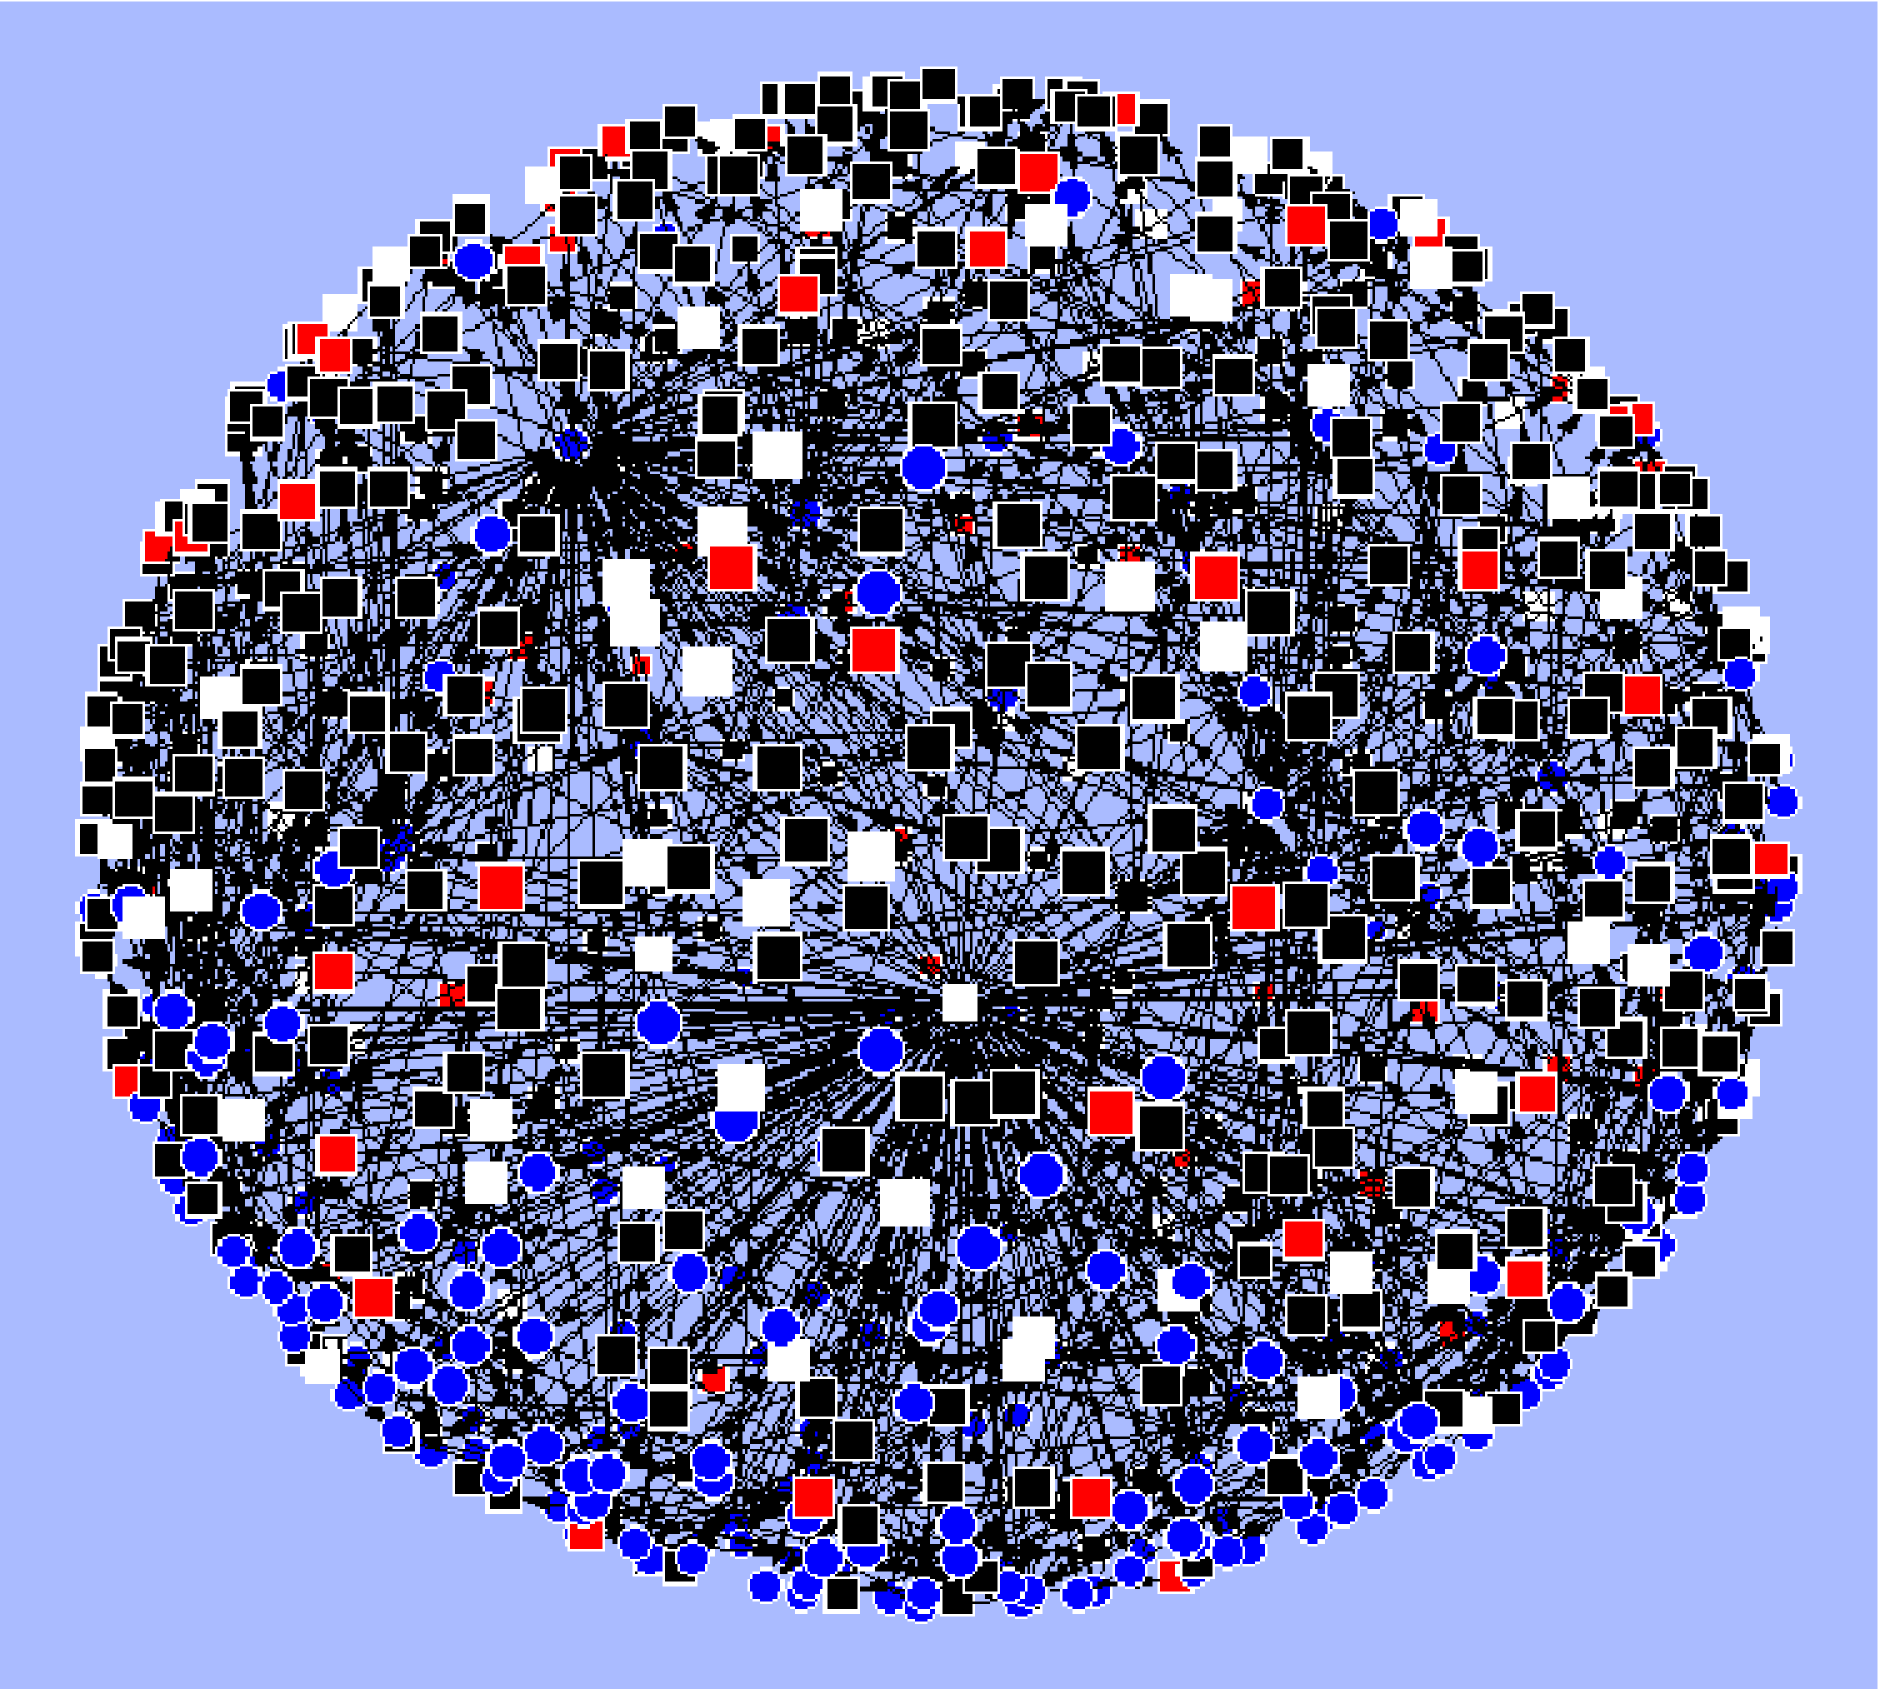
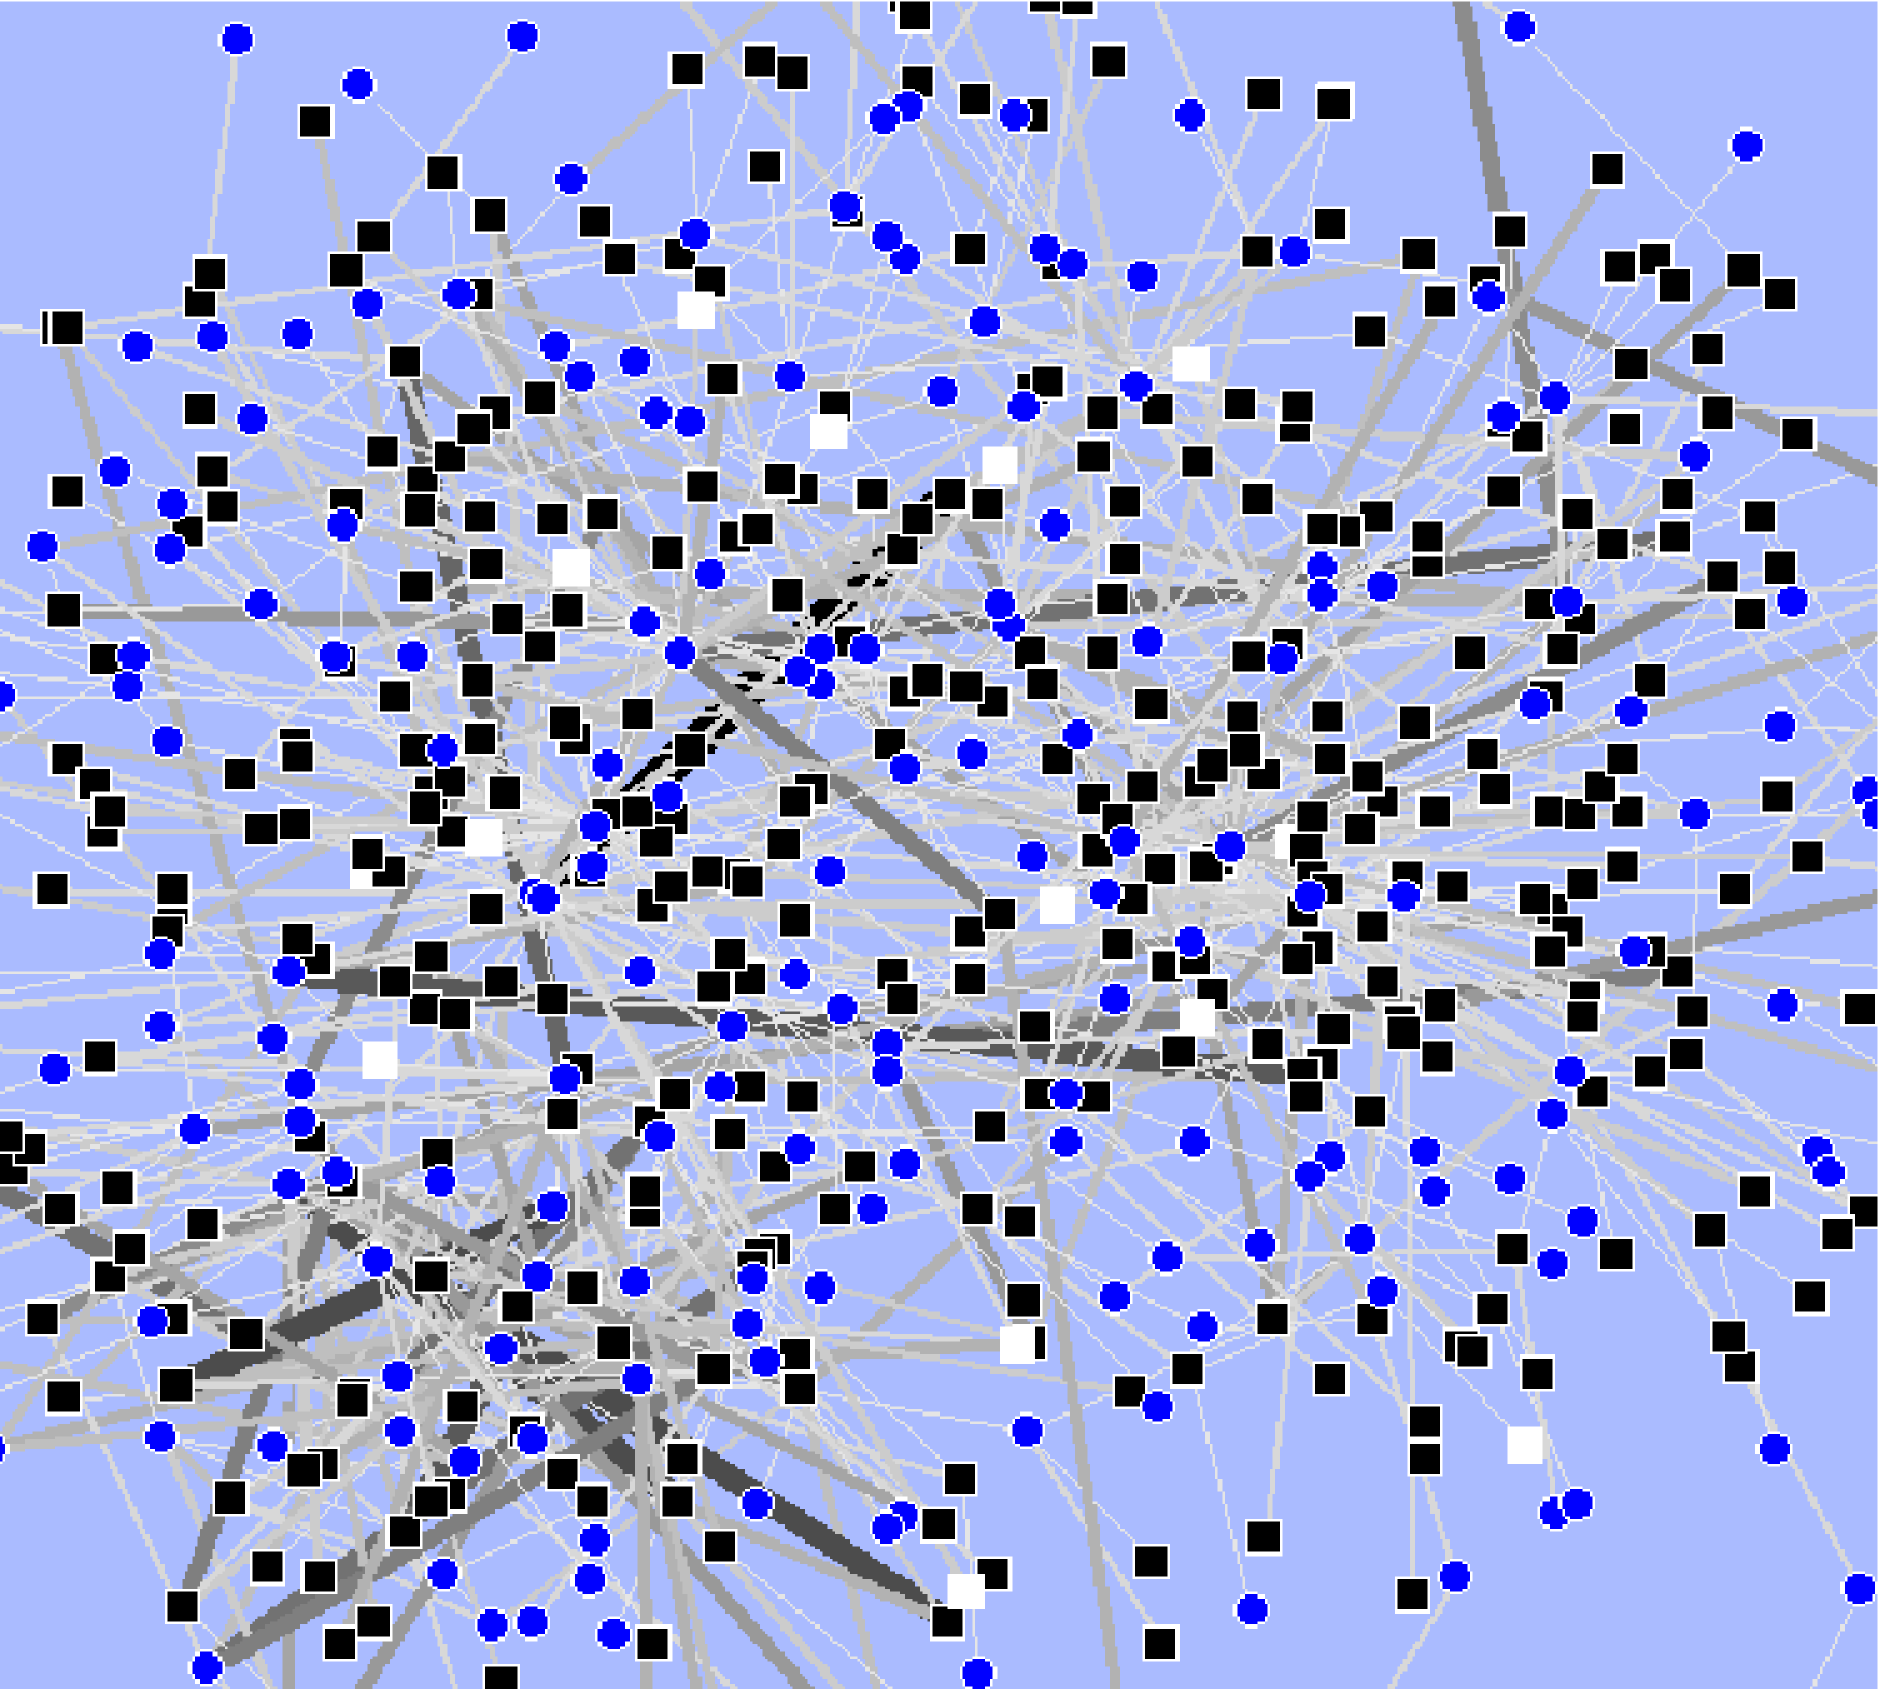
Mapping the data onto a bipartite network is a first step in our methodology. Two partition nodes are user nodes and posts-and-comments nodes, respectively. The resulting network is thus given by nodes. By definition, a link may occur only between nodes of different partitions, thus these bipartite networks represent accurately the post-mediated interactions between the Web users. (Note that the post-mediated communication makes the networks of blog users essentially different from the familiar social networks on the Web, such as MySpace or Facebook, where users interact directly with eachother.) We keep information about the direction of the actions, specifically, a link indicates that user reads the post , while indicates that the user writes the comment . In the data each comment has an ID that clearly attributes it with a given post (original story). The emotional content of the text appears as a property of each post-and-comment node. Fig. 1(left) shows an example of the accurate data mapping onto directed bipartite network: it represents a network of one popular post from our dataset. Note two types of well connected nodes: the main post (white square visible in the lower part), and a user-hub (circle node visible in upper left part of the network), which indicates a very active user on that post.
Mapping of the entire dataset results in a very large network. For different purposes, however, one can suitably reduce the network size. For instance, a monopartite projection on user-partition can be made, using the number of common posts per pair of users as a link [16]. For the purpose of this work, we keep the bipartite representation while we compress the network to obtain a weighted bipartite network of the size , consisting of all popular posts and users attached to them. The weight of a link is then given by the number of comments of the user on the post . A part of such network from our ddDiggs data is shown in Fig. 1(right). These networks exhibit very rich topology and interesting mixing patterns [19, 16] (see also [20, 21] for similar networks constructed from the data of music and movie users).
Based on the network representation and information about the emotional contents of the texts and the action times, here we perform quantitative analysis of the data. Specifically, we determine:
-
•
Community structure on the weighted bipartite networks, where a community consists of users and certain posts which are connecting them. Emotional contents of the comments by users in these communities are analyzed;
-
•
Temporal patterns of user actions for each individual user and for the detected user communities; Correlations between the evolution of a community with the emotional contents of the comments is monitored over time;
-
•
Avalanches of (emotional) comments, defined as sequences of comments of a given emotion which are mutually connected over the network and within a small time bin =5 minutes.
|
|
3 Empirical Data Analysis
3.1 User Communities and Emotions
Time sequence of user activity on all posts, i.e., the number of comments within a small time bin minutes is followed within the entire time period available in the dataset. Similarly, the time-series of the number of emotional comments, , and the number of negative/positive emotion comments, , is determined. An example is shown in Fig. 2(top): Zoom of the initial part of the time-series is shown, indicating bursts (avalanches) in the number of comments (further analysis of the avalanches is given below in Figs. 4 and 3f). The occurrence of increased activity over a large period of time suggests possible formation of a user community around some posts. In this example, the intensive activity with avalanches of comments lasted over 2153 hours, followed by reduced activity with sporadic events for another 1076 hours.
Such communities can be accurately identified on the underlying network by different methods [22, 23, 24]. Here we use the method based on the eigenvalue spectral analysis of the Laplacian operator [26, 25], which is related to the symmetrical weighted network as
| (1) |
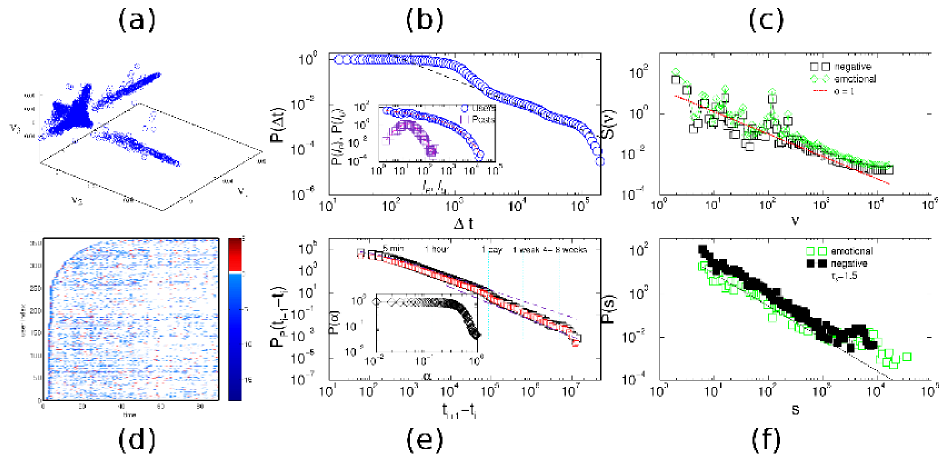
and represents the strength of node . As described in detail in [25], the existence of communities in a network is visualized by the branched structure in the scatter-plot of the eigenvectors corresponding to the lowest non-zero eigenvalues of the Laplacian. The situation shown in Fig. 3a is for the user-projected network of our dataset of popular diggs. In this case represents the number of common posts per pair of users, users with strengths are kept. Branches indicating three large communities are visible. By identifying the nodes’ indexes within a branch, we obtain the list of users belonging to a community that the branch represents. In order to unravel what posts (and comments) keep a given community together, we perform the spectral analysis of the weighted bipartite network described above, where the matrix elements represent the number of comments of a user to post . In this way we identify the list of user- and post-nodes belonging to a community. For each identified community we then select from the original data all comments by the users in that community, together with their time of appearance and the emotional contents.
3.2 Temporal Patterns of User Behavior
The actual evolution of an identified community can be retrieved from the data related to it. The procedure—network mapping, community structure finding, and identifying the active users within the community, is repeatedly applied for successive time periods in the past.
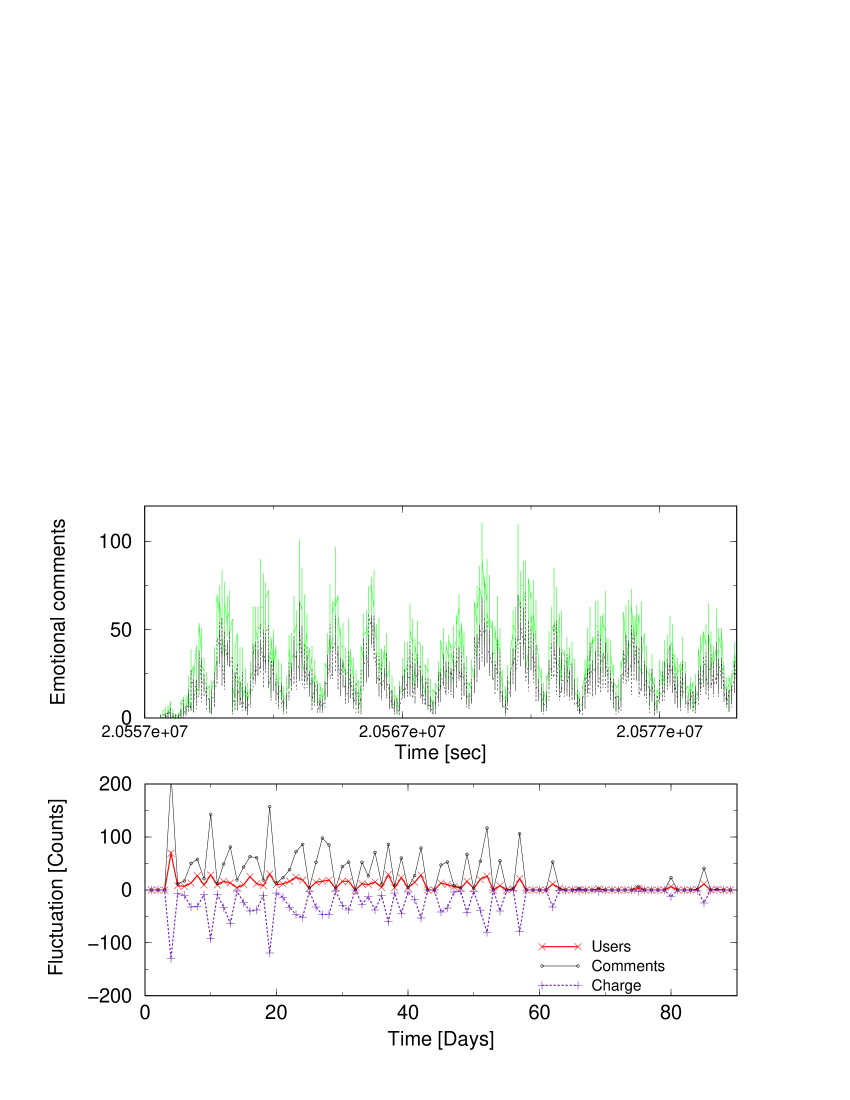
Fluctuations in the number of different users (size) in one of the large communities identified in our ddDiggs dataset is shown in Fig. 2(bottom) with the time interval of one day. Shown are also the fluctuations in the number of all comments, and the “charge” of emotional comments , where and stand for the number of comments of all users in that community on a given day that are classified as positive and negative, respectively. It is remarkable that, the increase in the number of users is closely correlated with the excess of the negative comments (critique) on the posts. In the supportive material [27] we give several snapshots of the networks, indicating the evolution stages of this particular community.
Users activities on posted text exhibit robust features, which can be characterized by several quantities shown in Figs. 3(b,c,d,e). Specifically, pattern of a user activity represents a fractal set along the time axis, with the intervals between two consecutive actions obeying a power-law distribution. In Fig. 3b the histogram averaged over all users in ddDiggs is shown. Consequently, the number of comments of a user within a given time bin is varying, that is shown graphically in the color plot in Fig. 3d. The color code represents the charge of the emotional comments made by a given user within 12 hours time bin. Different users are marked by the indexes along y-axis and ordered by the time of first appearance in the dataset. Occurrence of the diagonal stripes indicate the activity that involves new users potentially related with the same story. (Note that mutually connected comments are accurately determined using the network representation, as discussed below). Another power-law dependence is found in the delay time of comments made by anyone of the users to a given post, measured relative to its posting time [16, 28]. In view of the emotional comments on a given post, in the present study it is interesting to consider the delay between two emotional comments. The histograms for the case of negative (positive) comments from our dataset is given in Fig. 3e, averaged over all post in the dataset. Both distributions have a power-law tail with the slope for the delay time in the range [24h,8wk] and a smaller slope for [5min,24h], indicated by dashed lines. However, differences and larger frequency of negative comments is found in the domain 5min.
Further analysis of the time series reveals long-range correlations in the number of emotional comments. In particular, the power-spectrum of the type is found, both for the number of all emotional comments and the number of comments with negative emotion of the time series from Fig. 2(top). The power-spectrum plots are shown in Fig. 3c.
3.3 Structure of the Emergent Critical States
The observed correlations in the time series are indicative of bursting events, which are familiar to self-organized dynamical systems. In our case an avalanche represents a sequence of comments, i.e., a comment triggering more comments within a small time bin , and so on, until the activity eventually stops. In analogy to complex systems as the earthquakes [29] or Barkhausen noise [31], the avalanches can be readily determined from the measured time-series, like the one shown in Fig. 2(top). Specifically, putting a baseline on the level of random noise, an avalanche encloses the connected portion of the signal above the baseline. Thus the size of an avalanche in our case is given by the number of comments enclosed between two consecutive intersections of the corresponding signal with the baseline. The distribution of sizes of such avalanches is shown in Fig. 3f, determined from the signal of emotional comments from Fig. 2(top). A power-law with the slope 1.5 is found over two decades.
The scale-invariance of avalanches is a signature of self-organizing critical (SOC) states [33, 32] in dynamical systems. Typically, a power-law distribution of the avalanche sizes
| (2) |
and other quantities pertinent to the dynamics [34, 38, 31] can be measured before a natural cut-off , depending on the system size. The related measures, for instance the distribution of temporal distance between consecutive avalanches, , also exhibits a power-law dependence, as found in the earthquake dynamics [29, 30].
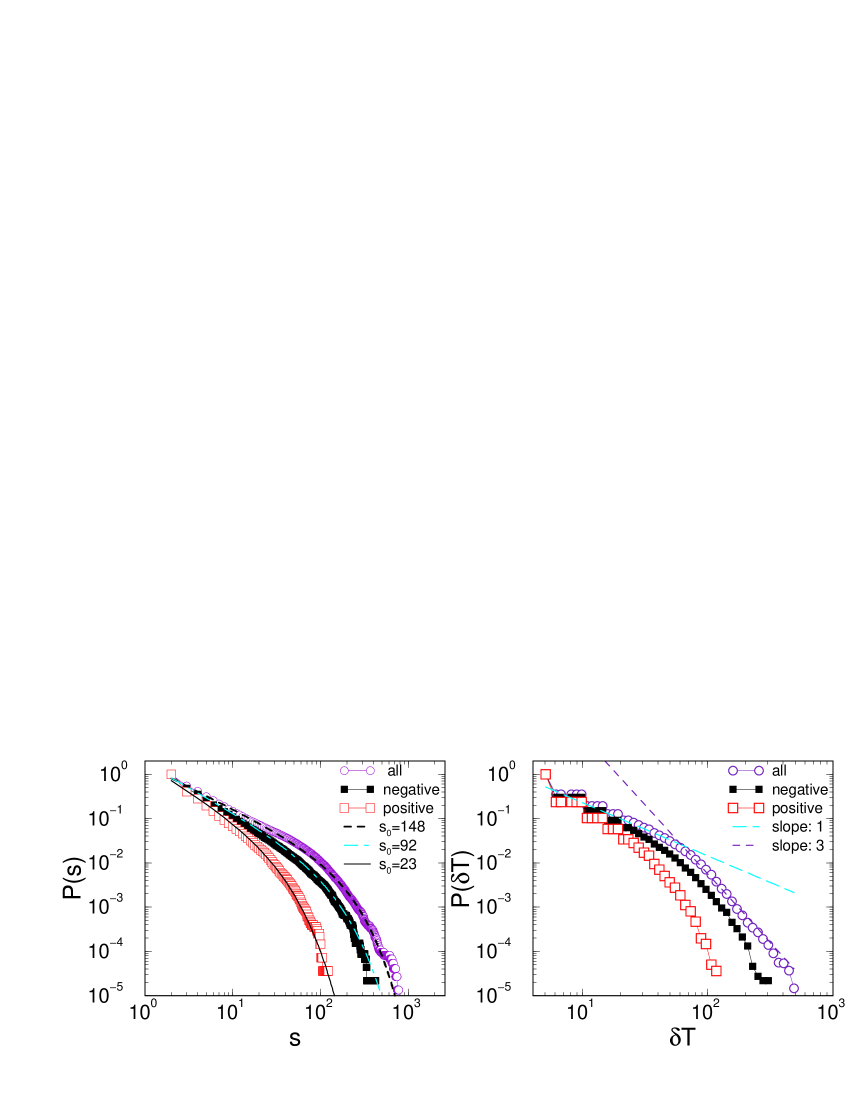
Here we give evidence that the SOC states may occur in the events at individual posts in our dataset. The results of the cumulative distributions of the avalanche sizes, , averaged over all 3984 posts, are shown in Fig. 4. The distributions for avalanches of different emotional contents are fitted with the Eq. (2) with different exponents () and cut-offs. On the single-post networks we can also identify the quiescence times between consecutive avalanches, the distributions, , are also shown in Fig. 4. For comparison, the differential distribution of the avalanche sizes in Fig. 3f, which refers to the simultaneous activity on all posts, shows an excessive number of very large avalanches (supercriticality). Occurrence of different attractors inherent to the dynamics [35, 36] or coalescence of simultaneously driven events [37, 38] may result in nonuniversal scaling exponents, which depend on a parameter. Relevance of the conservation laws is still an opened question [39]. The situation is even more complex for the dynamics on networks. Nevertheless, the SOC states have been identified in different processes on networks [40, 41, 42]. In order to understand the origin of the critical states in the empirical data, and their dependence on the user behavior, in the following we design a cellular-automaton type model on the weighted post–user network, within which we identify the realistic parameters governing the dynamics and vary them.
4 Modeling Avalanche Dynamics on Popular Posts
The microscopic dynamics on Blogs, i.e., a user posting a comment, triggering more users for their actions, etc., can be formulated in terms of update rules and constraints, which affect the course of the process and thus the emergent global states. A minimal set of control parameters governing the dynamics with the emotional comments is described below and extracted from our empirical data of ddDiggs. Specifically:
-
•
User delay to posted material, extracted from the data is given by a power-law tailed distribution in Fig. 3b, with the slope 1 above the threshold time 300 min;
-
•
User tendency to post a negative comment, measured by the probability , inferred from the data as a fraction of negative comments among all comments by a given user. Averaged over all users in the dataset, the distribution is given in the inset to Fig. 3e.
-
•
Post strength is a topological measure uniquely defined on our weighted bipartite networks as a sum of all weights of its links, i.e., the number of users linked to it with multiplicity of their comments. Thus it is a measure of attractiveness (relevance) of the posted material. Histograms of the strengths of posts and users in our dataset are given in the inset to Fig. 3b.
-
•
User dissemination probability is a measure of contingency of bloggers’ activity. It is deduced from the empirical data as the average fraction of the users who are active more than once/at different posts within a small time bin ( min). In the model we vary this parameter, as explained below.
-
•
Network structures mapped from the real data at various instances of time underlying the evolution of connected events. Here we use the weighted bipartite network of the ddDiggs data, Fig. 1(right).
Within the network automaton model these parameters are implemented as follows: First, the weighted bipartite network is constructed from the selected data and given time interval. To each post on that network we associate its actual strength , and to each user a (quenched) probability taken from the actual distribution . A well connected user is selected to start the dynamics by posting a comment on one of its linked posts. The lists of active users and exposed posts are initiated.
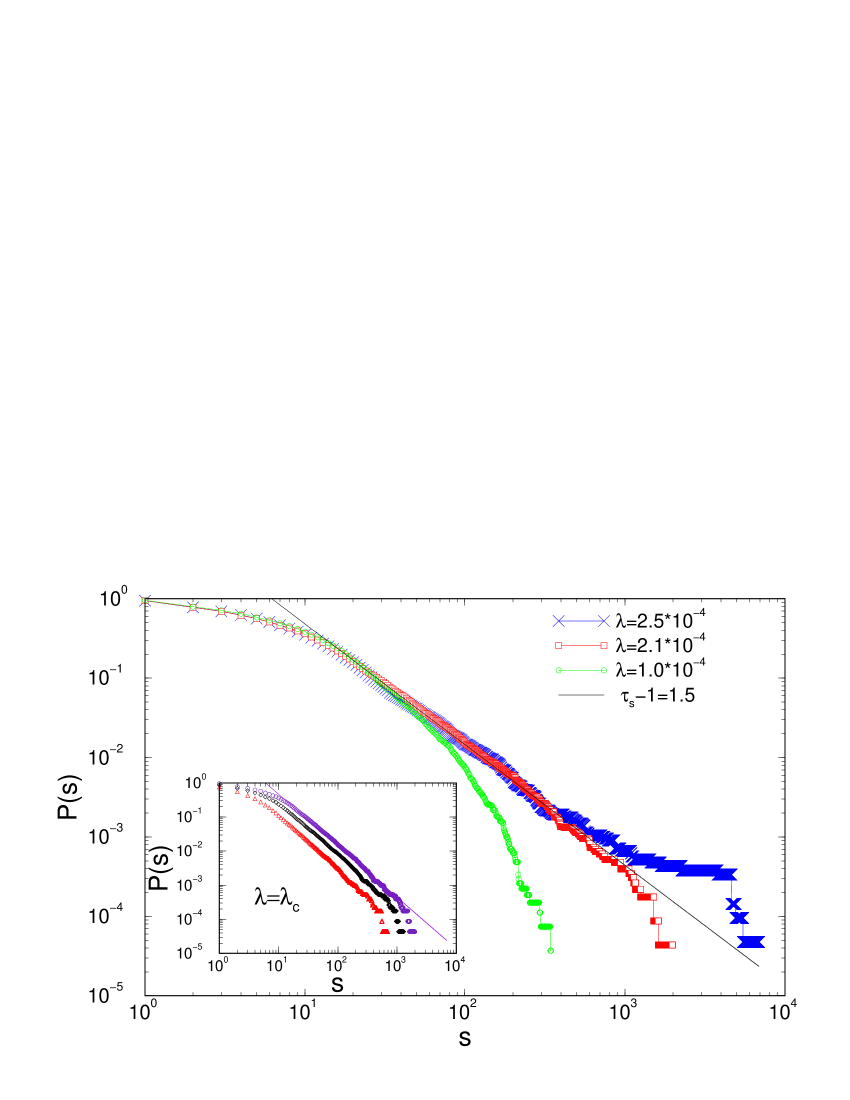
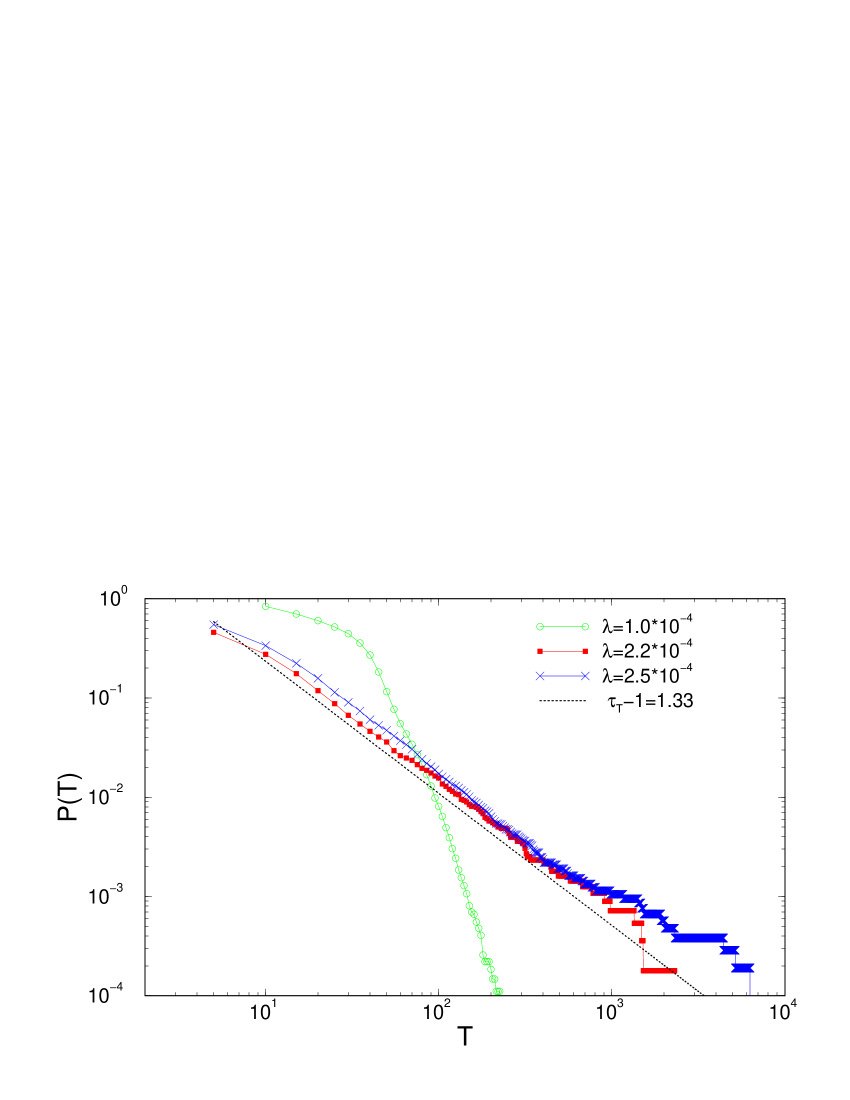
Then at each time step all users linked along the network to the currently exposed posts are prompted for action. A prompted user takes its delay time from the distribution of the actual dataset. Only the users who got are considered as active within this time step and may comment one of the exposed posts along their network links. The posted comment is considered as negative with the probability associated with that user, otherwise equal probability applies for the positive and objective comment. With the probability each active user may make an additional comment to anyone of its linked (including unexposed) posts. The post strength is reduced by one with each received comment. Commented post are added to the list of currently exposed posts. In the next time step the activity starts again from the updated list of exposed posts, and so on. Note that the activity can stop when: (a) no user is active, i.e., due to long delay time ; (b) strength of the targeted post is exhausted; (c) no network links occur between currently active areas. In the simulations presented here we vary the parameter while the rest of the parameters are kept at their values inferred from the considered dataset, as described above. The resulting avalanches of all comments and of the positive/negative comments are identified. The distributions of the avalanche size and duration are shown in Fig. 5 for different values of the dissemination parameter .
| (a) | (b) |
|---|---|
|
|
The simulation results, averaged over several initial points, show that the power-law distributions (2) of the avalanche size occur for the critical value of the dissemination, for this particular dataset. Whereas, varying the parameter in the simulations appear to have major effects on the bursting process. Specifically, the power-law becomes dominated by the cut-off for , indicating a subcritical behavior. Conversely, when , we observe excess of large avalanches, compatible with supercriticality. The critical behavior at has been confirmed by several other measures. The slopes of the distributions of size and suration, shown in Fig. 5 are and , respectively. The critical behavior persists, but with changed scaling exponents, when the other control parameters are varied. In particular, assuming the distribution of user-delay as leads to the power-law avalanches with the slopes and depending on the parameter .The results are shown in the supporting material [27].
5 Conclusions
We have analyzed a large dataset with discussion-driven comments on digg stories from digg.com as a complex dynamical system with emergent collective behavior of users. With the appropriate network mappings and using the methods and theoretical concepts of statistical physics combined with computer science methods for text analysis, we have performed quantitative study of the empirical data to:
-
•
Demonstrate how the social communities emerge with users interlinked via their comments over some popular stories;
-
•
Reveal that an important part of the driving mechanisms is rooted in the emotional actions of the users, overwhelmed by negative emotions (critiques);
-
•
Show that the bursting events with users’ emotional comments exhibit significant self-organization with the critical states.
Properties of the emergent collective states can be captured within a network-automaton model, where the real network structure and the parameters native to the studied dataset are taken. Despite several open theoretical problems related with the self-organized criticality on networks, the observed critical states appear to be quite robust when the parameters of users behavior are varied within the model. However, they are prone to overreaction with supercritical emotional avalanches triggered by a small fraction of very active users, who disseminate activity (and emotions) over different posts. Within our approach, the activities and related emotions of every user and of the identified user communities are traced in time and over the emerging network of their connections. In view of the complex dynamical systems, the statistical indicators of the collective states and the numerical values of the parameters governing the dynamics of cybercommunities are readily extracted from the empirical data.
Appendix A
Data-Collection:The Digg data set was collected through the website’s publicly available API111http://apidoc.digg.com/, which allows programmers to directly access the data stored at its servers, such as stories, comments, user profiles etc. The data set is comprised of a complete crawl spanning the months February, March and April 2009. It contains 1,195,808 stories, 1,646,153 individual comments and 877,841 active users. More information can be found in [43]. The data set is freely available for scientific research.
Emotion Classifier:The emotion classifier is based on supervised machine-learning approach, according to which a general inductive process initially learns the characteristics of a class during a training phase, by observing the properties of a number of pre-classified documents, and applies the acquired knowledge to determine the best category for new, unseen documents [10]. Specifically, it represents an implementation of the hierarchical Language Model (h-LM) classifier [44, 45], according to which a comment is initially classified as objective or subjective and in the latter case, as positive or negative. The h-LM classifier was trained on the BLOGS06 data set [46], which is a uncompressed 148GB crawl of approximately 100,000 blogs, a subset of which has been annotated by human assessors regarding whether they contain factual information or positive/negative opinions about specific entities, such as people, companies, films, etc. Because the resulting training data set is uneven, the probability thresholds for both classification tasks were optimized on a small subset of humanly annotated Digg comments, in a fashion similar to [18].
References
References
- [1] Kleinberg J, 2008 The Convergence of Social and technological Networks. Communications of the ACM, 51 66
- [2] Berners-Lee T, Hall W, Hendler J, Shadbolt N, and Weitzner J, 2006 Creating a Science of the Web. Science, 313769–771
- [3] Cho A, 2009 Ourselves and Our Interactions: The Ultimate Physics Problem? Science, 325
- [4] Bollen J, Pepe A, and Mao H, 2009 Modeling public mood and emotion: Twitter sentiment and socio-economic phenomena. arxiv:0911.1583
- [5] Norcross J C, Guadagnoli E, and Prochaska J O, 2006 Factor structure of the profile of mood states (POMS): Two parallel replications. J. Clinical Psychology, 40 1270-1277
- [6] Thelwall M, Buckley K, Paltoglou G, Cai D, and Kappas A, 2010 Sentiment Strenght Detection in Short Informal Text, Journal of the Americal Society for Information Science and Technology, (in press)
- [7] Pang B and Lee L, 2008 Opinion Mining and Sentiment Analysis. Now Publishers Inc.
- [8] Dodds P S and Danforth C M, 2009 Measuring the Happiness of Large-Scale Written Expression: Songs, Blogs, and Presidents. Journal of Happiness Studies
- [9] Gonzalez-Bailon S, Banchs R E and Kaltenbrunner A, 2010 Emotional Reactions and the Pulse of Public Opinion: Measuring the Impact of Political Events on the Sentiment of Online Discussions. arXiv:1009.4019v1
- [10] Sebastiani F, 2002 Machine learning in automated text categorization. ACM Comput. Surv., 34:1–47
- [11] Brumfiel G, 2009 Breaking the convention? Nature 459 1050–1051
- [12] Panzarasa P, Opsahl T and Carley K M, 2009 Patterns and dynamics of users’ behavior and interactions: network analysis of and online community. Journal of the American Society for Information Science and Technology 60 911–932
- [13] Leskovec J, McGlohon M, Faloutsos Ch, Glance N, and Hurst M, 2007 Cascading behavior in large blog graphs. In Proceedings of 7th SIAM International Conference on Data Mining (SDM) p 29406-13
- [14] Cattuto C, Barrat A, Baldassarri A, Schehr G and Loreto V, 2009 Collective dynamics of social annotation. PNAS 10610511–10515
- [15] Sano Y and Takayasu M, 2009 Macroscopic and microscopic statistical properties observed in blog entries. arXiv:0906.1744
- [16] Mitrović M and Tadić B 2010 Bloggers behavior and emergent communities in blog space. Eur. Phys. Journal B 73 293–301
- [17] Boccaletti S, Latora L, Moreno Y, Chavez M and Hwang D U, 2006 Complex networks: Structure and dynamics. Physics Reports 424 175–308
- [18] Paltoglou G, Gobron S, Skowron M, Thelwall M and Thalmann D, 2010 Sentiment analysis of informal textual communication in cyberspace. In Proceedings of ENGAGE 2010, Springer LNCS State-of-the-Art Survey, p 13–23
- [19] Mitrović M and Tadić B 2010 Emergence and Structure of Cybercommunities. in Springer Handbook of Networks, Vol. 2, part 2 “Online Social Networks”, Eds. M.M. Thai and P. Pardalos (in press)
- [20] Lambiotte R and Ausloos M 2005 Uncovering collective listening habits and music genres in bipartite networks. Phys. Rev. E 72 066107
- [21] Grujić J, Mitrović M and Tadić B, 2009 Mixing patterns and communities on bipartite graphs on web-based social interactions, IEEEXplore DOI: 10.1109/ICDSP.2009.5201238, Digital Signal Processing 16th International Conference, 5-7 July 2009, Santorini, Greece, ISBN: 978-1-4244-3297-4
- [22] Fortunato S, 2010 Community detection in graphs. Physics Reports 486 75–174
- [23] Rosvall M and Bergstrom C T, 2008 Maps of random walks on complex networks reveal community structure. PNAS 105 1118–1123
- [24] Evans T S and Lambiotte R, 2009 Line Graphs, Link Partitions and Overlapping Communities. Phys. Rev. E 80 016105
- [25] Mitrović M and Tadić B, 2009 Spectral and dynamical properties in classes of sparse networks with mesoscopic inhomogeneities. Phys. Rev. E 80 026123
- [26] Dorogovtsev S N, Goltsev A V, Mendes J F and Samukhin A N, 2003 Spectra of complex networks. Phys. Rev. E 68 046109
- [27] Mitrović M, Paltoglou G and Tadić B, 2010 Supportive Information for: Quantitative Analysis of Bloggers Collective Bahvior Powered by Emotions. http://www-f1.ijs.si/tadic/sup/SI10.pdf
- [28] Crane R, Schweitzer F and Sornette D, 2010 Power Law Signature of Media Exposure in Human Response Waiting Time Distributions. Phys. Rev. E 81 056101
- [29] Corral A, 2004 Long-term clustering, scaling and universality in the temporal occurrence of earthquakes. Phys. Rev. Lett. 92 108501
- [30] Sornette D, Utkin S and Saichev A, 2008 Solution of the nonlinear theory and tests of earthquake recurrence times, Phys. Rev. E 77 066109
- [31] Spasojević D, Bukvić S, Milošević S and Stanley G, 1996 Barkhausen noise: Elementary signals, power laws, and scaling relations, Phys. Rev. E 54 2531–46
- [32] Jensen J H, 1998 Self-organized Criticality. Emergent Complex Behavior in Physical and Biological Systems. Cambridge University Press
- [33] Dhar D, 2006 Theoretical studies of self-organized criticality. Physica A 369 29–70
- [34] Dhar D, 1990 Self-Organized Critical State of Sandpile Automaton Models. Phys. Rev. Lett. 64 1613–16
- [35] Tadić B and Dhar D, 1997 Emergent spatial structures in critical sandpiles. Phys. Rev. Lett. 79 1519–22
- [36] Tadić B 1999 Dynamic criticality in driven disordered systems: Role of depinning and driving rate in Barkhausen noise, Physica A 270 125–32
- [37] Corral A and Paczuski M, 1999 Avalanche Merging and Continuous Flow in a Sandpile Model. Phys. Rev. Lett. 83 572–575
- [38] Tadić B, 1996 Nonuniversal scaling properties of Barkhausen noise. Phys. Rev. Lett. 77 3843–6
- [39] Bonachela J A and Muñoz M A, 2009 Self-organization without conservation: true or just apparent scale-invariance?, J. Stat. Mechanics: Theory and Experiment, P09009
- [40] Goh K I, Lee D S, Kahng B and Kim D, 2003 Sandpile on scale-free networks, Phys. Rev. Lett. 91 148701-3
- [41] Tadić B, Malarz K and Kulakowski K, 2005 Magnetization reversal in spin patterns with complex geometry, Phys. Rev. Lett. 94 137204-7
- [42] Cajueiro D O and Andrade R F S, 2010 Controlling self-organized criticality in complex networks, Eur. Phys. J. B. 00229-8
- [43] Paltoglou G, Thelwall M and Buckely K, 2010 Online textual communcation annotated with grades of emotion strength. In Proceedings of the Third International Workshop on EMOTION (satellite of LREC): Corpora for research on emotion and affect, p 25–31
- [44] Peng F, Schuurmans D and Wang S, 2003 Language and task independent text categorization with simple language models. In NAACL ’03 (Morristown, NJ, USA, Association for Computational Linguistics) p 110–117
- [45] Pang B and Lee L, 2004 A sentimental education: sentiment analysis using subjectivity summarization based on minimum cuts. In ACL ’04 (Morristown, NJ, USA) p 271
- [46] Ounis I, Macdonald C and Soboroff I, 2008 Overview of the trec-2008 blog trac. In The TREC 2008 Proceedings NIST