Time-resolved spectroscopy of DROXO X-ray sources: Flares and Fe K emission
Abstract
We present a systematic search for Fe K emission from young stellar objects of the Ophiuchi star forming region observed in the Deep Rho Ophiuchi XMM-Newton Observation.
1 The Deep Rho Ophiuchi XMM-Newton Observation (DROXO)
The Deep Rho Ophiuchi XMM-Newton Observation, DROXO, is an XMM-Newton Large Project with a nominal exposure time of ksec centered on core F of the Oph star forming region. A catalog of X-ray sources, more than % of which identified with known cloud members, was presented by Pillitteri et al. (2010). That paper also comprises a detailed description of the general data analysis steps including data filtering, source detection, treatment of the background etc. Here we present the results of a systematic search for Fe K emission in all DROXO X-ray sources. The Fe K emission of one DROXO source, the Class I protostar Elias 29, has already been discussed in a separate paper (Giardino et al. 2007). Our analysis also includes this object and we confirm the results by Giardino et al.
2 Fe K emission in Young Stellar Objects
The X-ray spectra of Young Stellar Objects (YSOs) can be explained by thermal emission from their coronae that are a few times K hot. In roughly a dozen YSOs an emission line at keV has been identified that can not be attributed to highly ionized coronal material (e.g. Imanishi et al. 2001; Tsujimoto et al. 2005). In the Sun this line represents K fluorescence of neutral iron in the photosphere irradiated with X-rays from the solar corona during flares. In YSOs this line is usually attributed to fluorescence from neutral iron in the accretion disk following X-ray illumination from the star’s corona. In some cases the line equivalent widths have been shown to be incompatible with fluorescence calculations (e.g. Giardino et al. 2007; Czesla & Schmitt 2007). An alternative excitation mechanism for the line is electron impact ionization. Giardino et al. suggest the accretion streams between the disk and the stellar surface as possible location for this process. Another possible scenario that may explain the large observed equivalent widths in these cases without the need to invoke collisional excitation is the (partial) occultation of the illuminating continuum flux, e.g. a stellar flare behind the limb (Drake et al. 2008). The identification of the origin of the Fe K line in YSOs can greatly benefit from time-resolved spectroscopy that enables a direct evaluation of the continuum visible at the moment when the line is produced.
3 Fe K spectroscopy of DROXO X-ray sources
We have carried out systematic spectral fitting of all DROXO sources with XSPEC v.12. Spectra were generated for a variety of good-time-intervals, spectral binnings, all EPIC detectors individually as well as joint pn+MOS 1+MOS 2, such that for each X-ray source a total of time-averaged X-ray spectra are available. Time-resolved spectroscopy is performed in intervals defined using a maximum likelihood technique that divides the lightcurve in time-intervals of constant intensity (see e.g. Stelzer et al. 2007).
We limit the energy range for spectral fitting to keV. At these high energies the photo-absorption, generally an important factor for YSOs in Oph (median for DROXO sources is ; see Pillitteri et al. 2010), has negligible influence. We adapt a one-temperature APEC model plus Gaussian feature with fixed energy of keV to the data. The keV feature is considered detected if the normalization of the Gaussian is non-zero with % confidence.
3.1 Results from time-averaged spectra
The time-averaged spectra include data from satellite orbits. The keV line is detected in of DROXO sources: Class I, Class II, Class III objects.
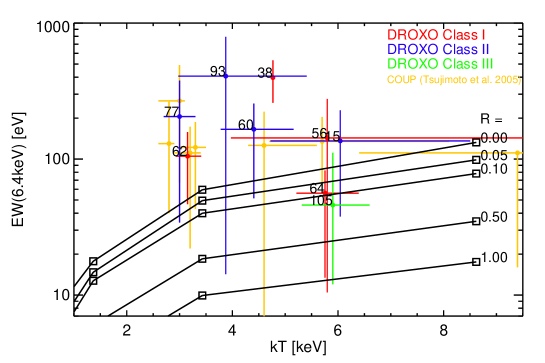
Searching for the origin of the line, we compare the observed line equivalent widths to calculations for photospheric fluorescence (Drake et al. 2008). The fluorescence model consists in a single coronal flare illuminating the photosphere from a height, . The flux in the fluorescence line depends essentially on four parameters: the iron abundance in the fluorescence medium, the temperature of the ionizing coronal plasma (), its height (), and the heliocentric angle (); Basko (1979). The models shown in Fig. 1 are based on the assumption of , i.e. a flare erupting on the star in the direction of the line-of-sight, the case that gives the highest fluorescence flux. The calculations for apply also to a fluorescent disk illuminated by a stellar flare.
The sample of equivalent widths observed in DROXO is complemented in Fig. 1 by YSOs with Fe K detections from the Chandra Orion Ultradeep Project (COUP) discussed by Tsujimoto et al. (2005). Most observed equivalent widths are compatible with the predictions of the photospheric fluorescence model with a flare at moderate height above the photosphere or a flare irradiating a disk. We detect the keV line from one Class III object, GY 463, where material related to a disk is not a viable option for the line emission site (see also Sect.3.2).
3.2 Results from time-resolved spectra
There are several reasons to expect the Fe K flux to be variable in time. Generally, any variation of the ionizing spectrum (in terms of temperature or emission measure) has an impact on the strength of the line. Specifically, if flares are responsible for its excitation a correlation between the presence of Fe K emission and flaring is predicted. In practice, the relation between flares and K emission may be concealed by occultation effects as proposed by Drake et al. (2008), and time-delays between these two phenomena may yield geometrical constraints.
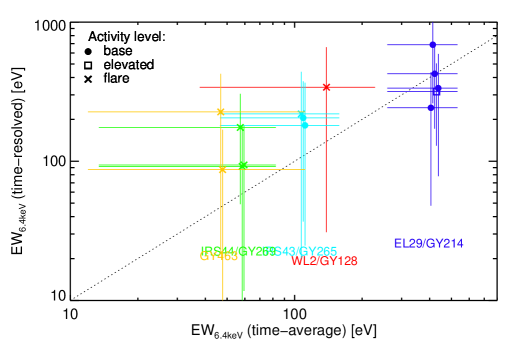
Our time-resolved spectroscopy of DROXO sources results in Fe K detections in individual time segments for YSOs. In Fig. 2 we show the equivalent width of the keV feature in individual time segments vs. the equivalent width in the time-averaged spectrum for those objects. This comparison demonstrates how mixing different activity states by averaging over long time intervals yields a smaller equivalent width than the actual maximum value achieved during the observation.
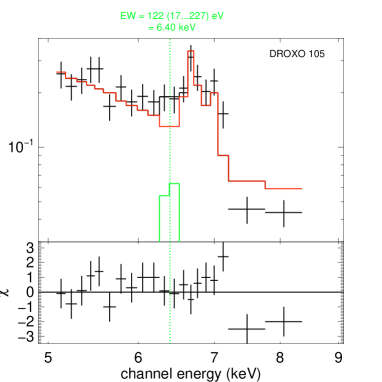
In Fig. 2 we distinguish three activity states (base level, elevated level and flare) defined by different intensity in the lightcurve. Remarkably, the keV line is detected not only during flares but in some cases during quiescence (‘base level’). Especially, for Elias 29 we recover the result of Giardino et al. (2007). Elias 29 is also the star with the highest equivalent width (up to Å). It is the only object in our sample that is incompatible with the fluorescence model taking into account the uncertainties (Source 38 in Fig. 1). The second star in which the Fe K emission is observed outside evident flares is IRS 43. This source is discussed in more detail in Sect. 3.3. For the only Class III object with Fe K emission, GY 463, the time-resolved spectral analysis shows that the detection of this line is related to a large flare identified in the lightcurve. The spectrum corresponding to the time-interval where the line was detected is shown in Fig. 3.
3.3 The puzzling Fe K emission of IRS 43
The Fe K emission is located at keV for neutral and low ionized iron with very little dependence of the fluorescence energy on the charge state (Kallman et al. 2004). This justifies our choice of fixing the line position in the spectral fitting process. However, in the time-averaged spectrum of IRS 43 (alias YLW 15) this approach results in a clear residual between the model and the data that stems from an excess flux at energies between the Gaussian (fixed at keV) and the coronal iron line at keV; see Fig. 4 top right.
![[Uncaptioned image]](/html/1011.6174/assets/x4.png)
![[Uncaptioned image]](/html/1011.6174/assets/x5.png)
![[Uncaptioned image]](/html/1011.6174/assets/x6.png)
IRS 43 is a binary with separation. The northern component is identified only at radio and mid-IR wavelengths, i.e. it is probably either a very young protostar or a knot in the outflow (e.g. Girart et al. 2000; Haisch et al. 2002). The X-ray emission is most likely produced on the brighter object, IRS 43 S, a Class I protostar according to the (unresolved) spectral energy distribution. Greene & Lada (2002) detected stellar absorption features in near-IR spectra of IRS 43 that point to a spectral type of K5 IV/V. From the near-IR photometry they derive an extinction of mag and a stellar luminosity of leaving % of its bolometric luminosity (; Wilking et al. 1989) to the accretion process. However, the conclusion on the accretion luminosity relies on the interpretation of the second radio and mid-IR source as a jet and not as an embedded binary companion that would contribute to the luminosity derived from the spectral energy distribution.
A fit of the DROXO spectrum with free line position results in a line energy of keV where the uncertainty is for a % confidence level (Fig. 4 bottom left). This line is apparently produced by significantly ionized ions (Fe XIX – Fe XXIII). Those ions are dominating the ionization balance of a collisional plasma in a small temperature range of MK. It is therefore difficult to attribute this line to fluorescence from a photosphere or an accretion disk where such high temperatures are not reached. It seems like in this case the fluorescence takes place in the corona itself. However, the coronal column density is probably too small to produce the observed equivalent width of eV. Another hypothesis is that this fluorescence line is emitted in denser plasma such as the one present in the chromosphere or transition region. The emitting material may then be photo-ionized rather than collisionally ionized, and this would allow for lower temperature. Comparison of the observed line energy with the high-resolution profiles for a photo-ionized plasma calculated by Kallman et al. (2004) suggests an ionization parameter of . For this value of , the temperature of the photoionization calculations is and the Fe K line emissivity is dominated by Fe XIX.
Inspection of the lightcurve and the time-resolved spectroscopy for IRS 43 reveals that the Fe K line is detected during time-segments. Only one of them shows the energy shift. This time-interval corresponds to a small flare during the last orbit of the observation. The spectrum of this time segment is shown in the bottom right panel of Fig. 4. One of the remaining three time-intervals with Fe K emission has a larger flare, while the other two represent the quiescent X-ray state. A possible scenario for the shifted line energy may be fluorescence from the chromosphere or transition region illuminated by a flare occuring near or partially behind the limb.
Acknowledgments
We acknowledge the support of the ASI/INAF agreement
I/099/10/0.
References
- Basko (1979) Basko, M. M. 1979, Soviet Ast., 23, 224
- Czesla & Schmitt (2007) Czesla, S., & Schmitt, J. H. H. M. 2007, A&A, 470, L13. arXiv:0706.3097
- Drake et al. (2008) Drake, J. J., Ercolano, B., & Swartz, D. A. 2008, ApJ, 678, 385. 0710.0621
- Giardino et al. (2007) Giardino, G., Favata, F., Pillitteri, I., Flaccomio, E., Micela, G., & Sciortino, S. 2007, ArXiv e-prints, 710. 0710.1947
- Girart et al. (2000) Girart, J. M., Rodríguez, L. F., & Curiel, S. 2000, ApJ, 544, L153
- Greene & Lada (2002) Greene, T. P., & Lada, C. J. 2002, AJ, 124, 2185. arXiv:astro-ph/0207515
- Haisch et al. (2002) Haisch, K. E., Jr., Barsony, M., Greene, T. P., & Ressler, M. E. 2002, AJ, 124, 2841. arXiv:astro-ph/0209224
- Imanishi et al. (2001) Imanishi, K., Koyama, K., & Tsuboi, Y. 2001, ApJ, 557, 747
- Kallman et al. (2004) Kallman, T. R., Palmeri, P., Bautista, M. A., Mendoza, C., & Krolik, J. H. 2004, ApJS, 155, 675. arXiv:astro-ph/0405210
- Pillitteri et al. (2010) Pillitteri, I., Sciortino, S., Flaccomio, E., Stelzer, B., Micela, G., Damiani, F., Testi, L., Montmerle, T., Grosso, N., Favata, F., & Giardino, G. 2010, A&A, 519, A34+. 1004.4617
- Stelzer et al. (2007) Stelzer, B., Flaccomio, E., Briggs, K., Micela, G., Scelsi, L., Audard, M., Pillitteri, I., & Güdel, M. 2007, A&A, 468, 463. arXiv:astro-ph/0608651
- Tsujimoto et al. (2005) Tsujimoto, M., Feigelson, E. D., Grosso, N., Micela, G., Tsuboi, Y., Favata, F., Shang, H., & Kastner, J. H. 2005, ApJS, 160, 503. arXiv:astro-ph/0412608
- Wilking et al. (1989) Wilking, B. A., Lada, C. J., & Young, E. T. 1989, ApJ, 340, 823