Hindrance of the excitation of the Hoyle state and the ghost of the state in 12C
Abstract
While the Hoyle state (the isoscalar excitation at 7.65 MeV in 12C) has been observed in almost all the electron and inelastic scattering experiments, the second excited state of 12C at MeV, believed to be an excitation of the Hoyle state, has not been clearly observed in these measurements excepting the high-precision (C experiments at and 386 MeV. Given the (spin and isospin zero) -particle as a good probe for the nuclear isoscalar excitations, it remains a puzzle why the peak of the state could not be clearly identified in the measured (C spectra. To investigate this effect, we have performed a microscopic folding model analysis of the C scattering data at 240 and 386 MeV in both the Distorted Wave Born Approximation (DWBA) and coupled-channel (CC) formalism, using the nuclear transition densities given by the antisymmetrized molecular dynamics (AMD) approach and a complex CDM3Y6 density dependent interaction. Although AMD predicts a very weak transition strength for the direct excitation, our detailed analysis has shown evidence that a weak ghost of the state could be identified in the 240 MeV (C data for the state at 10.3 MeV, when the CC effects by the indirect excitation of the state are taken into account. Based on the same AMD structure input and preliminary (C data at 386 MeV, we have estimated relative contributions from the and states to the excitation of 12C at MeV as well as possible contamination by state.
keywords:
Inelastic C scattering, excitation of 12C, AMD prediction, double-folding model, DWBA and CC analyses.The excited states of 12C lying around the -decay threshold have become a research subject of wide interest recently [1, 2] because of the dominant -cluster structure established in some cases, such as the isoscalar 0 state at 7.65 MeV in 12C (known as the Hoyle state that has a vital role in the stellar synthesis of Carbon). Although the three -cluster structure of the Hoyle state has been shown more than 30 years ago in the microscopic Resonating Group Method (RGM) calculations [3, 4, 5], an interesting -condensate scenario [2] for this state has been established just recently [6, 7], where three clusters were shown to condense into the lowest state of their potential. A more complicated structure of the Hoyle state was found in the Fermionic Molecular Dynamics (FMD) calculation [8] where the condensate wave function is mixed also with the molecular 8Be configuration, but the condensate component still exhausts about 70% of the total wave function. Given such a strong condensate of the three clusters, a question arises naturally about the isoscalar (IS) excitation of the Hoyle state. Namely, if it is a condensate state then the next level in the potential containing three -particles should be a state formed by promoting an -particle from the to level. Such an excited state has been first predicted by Funaki el al. [9] and it must be a 2+ state at the excitation energy of around 10 MeV, with a pronounced 8Be+ structure [1]. This same state has been predicted also by the three-body calculation [10] or the antisymmetrized molecular dynamics (AMD) approach [11], as the second state of 12C lying about 2 MeV above the -decay threshold. The experimental observation of the state of 12C would be very important for a deeper understanding of the Hoyle state, e.g., the measured excitation energy would allow us to determine the moment of inertia and deformation of 12C being in the Hoyle state. The first experimental hint for the state has been found by the Texas A&M University group in the isoscalar strength distribution of 12C in the energy range MeV [12]. However, this peak is located at MeV which is somewhat high compared to the predicted value around 10 MeV. A more convincing experimental measurement of the state has been performed by Itoh et al. in the 386 MeV inelastic C scattering spectrum [13, 14], based on a multipole decomposition analysis (MDA) of the measured (C angular distribution. Given a prominent 3- cluster structure predicted for this state, several experimental efforts [15, 16] have also been made by Freer et al. to search for the peak in the 3- decay spectrum of 12C in the excitation energy range of MeV but no positive identification has been done. Recently, Freer and collaborators have performed the (C experiment at the beam energy of 66 MeV [17] as well as the (12C,12CC experiment at 101.5 MeV [18]. While some enhancement above background has been deduced from the (C spectrum that indicates a possible peak at MeV [17], no conclusive evidence was found in the latter experiment excepting some estimate made for the upper limits in the excitation strength of the state [18]. The present work is our attempt to shed some light into this puzzled situation by a detailed folding model analysis of inelastic C scattering data at 240 MeV [12] and 386 MeV [13, 14].
Because the spin- and isospin zero -particle is a very good projectile to excite the nuclear IS states, the 3- RGM wave function obtained by Kamimura [4] has been used earlier in the folding model analysis [19] of the inelastic C scattering to probe the transition strength of the Hoyle state. This approach has been extended to study also other IS excitations of 12C like 2+ (4.44 MeV), 3- (9.64 MeV), 0+ (10.3 MeV) and 1- (10.84 MeV) states [20], using the same RGM wave functions. The technical details of this folding approach for elastic and inelastic nucleus-nucleus scattering can be found in Ref. [21]. The key quantity in our folding model analysis is the -nucleus form factor (FF) that contains all the information about the -nucleus inelastic scattering as well as structure of the nuclear state under study. Therefore, it is vital to evaluate the FF using a good choice for the effective nucleon-nucleon (NN) interaction and realistic wave functions for the -particle and target nucleus, respectively. In the present work, we apply our folding model approach to study the possible excitation of the state of 12C using the microscopic nuclear transition densities given by the AMD calculation [11] and the (complex) density-dependent CDM3Y6 interaction, whose parameters have been fine tuned recently [22] for the -nucleus scattering at the same incident energies of 240 and 386 MeV.
The AMD approach has been proven to be quite reliable in describing the structure of low-lying excited states in light nuclei, where both the cluster and shell-model like states are consistently reproduced [11, 23]. In the present work, the structure of IS excited states of 12C is generated within the AMD approach using the method of variation after the spin-parity projection (VAP). The main structure properties of these states are summarized in Table 1. While the AMD prediction for the shell-model like state is quite satisfactory in both the excitation energy and transition strength, the predicted excitation energies for higher lying states are slightly larger than the experimental values. However, such a difference in the excitation energies does not affect significantly the calculated inelastic C scattering cross section because it can lead only to a very small change in the kinetic energy of emitted -particle and, thus, can be neglected. Most vital are the strength and shape of the nuclear transition density used to evaluate the inelastic FF that can affect directly the inelastic scattering cross section calculated in the Distorted Wave Born Approximation (DWBA) or coupled-channel (CC) formalism. The details of the AMD calculation for the IS excited states of 12C are given in Ref. [11]. In the present work, the AMD nuclear transition densities enter the folding calculation in the same convention as in Refs. [21, 22] so that the isoscalar transition strength for a -pole nuclear transition is described by the reduced nuclear transition rate , where the -pole transition moment is determined from the corresponding nuclear transition density as
| (1) | |||||
| (2) | |||||
| (3) |
Note that the IS dipole transition moment is evaluated based on higher-order corrections to the dipole operator, with spurious center-of-mass (c.m.) oscillation subtracted [24]. The reduced electric transition rate is evaluated as , where is determined in the same way as but using the proton part of the nuclear transition density only. We will discuss hereafter the transition strength in terms of only because this is the quantity that can be compared with the experimental data whenever possible.
The excitation energies and transition strengths of the IS states considered in the present work are given in Table 1. One can see that the calculated excitation energies and transitions from the ground state to the , and states agree reasonably with the experimental values. As illustrated in Figs. 1 and 2 below, the AMD nuclear transition densities also give good description of the corresponding inelastic (C cross sections. In difference from the shell-model like structure of the state, the state has a well established cluster structure (see Fig. 5 of Ref. [11]), with a more extended and dilute mass distribution that corresponds to the mass radius fm which is even larger than that of the Hoyle state. The more striking are the predicted electric transition rates for the transitions from the Hoyle state to the state and from the state to the state: fm4 and fm4 that are much stronger than those of the transitions between the members of the ground-state rotational band: fm4 and fm4. As a result, the predicted and transition rates strongly suggest that the and states should be the members of the excited rotational band built upon the Hoyle state. The values predicted by the RGM [4] and FMD calculations [25] are even larger than that given by the AMD calculation. Given a very weak direct excitation of the state from the ground state, fm4 predicted by the AMD calculation, we can draw a conclusion that the state should be an IS quadrupole excitation of the Hoyle state [1]. It should be noted that if we take the measured strength of the peak at 11.46 MeV in the 240 MeV (C spectrum, which exhausts of the energy weighted sum rule (EWSR) [12], then we obtain fm4 based on the standard collective model treatment of the MDA [22]. This value agrees surprisingly well with that predicted by the AMD calculation and it is, therefore, not excluded that the observed peak at MeV in the 240 MeV (C spectrum corresponds to the state, although the excitation energy is about 1 MeV above the value predicted by the AMD. The width of this state has been determined from the 240 MeV spectrum to be keV [12], which is somewhat smaller than that ( keV) suggested by Freer et al. [17]. A closer look indicates that the peak at 11.46 MeV in the 240 MeV spectrum might well be the adopted () level of 12C [26] at MeV having a width of keV, observed in the (3He,) stripping reaction at MeV [27]. It should be noted, however, that this state has only been seen once in the 11B(3He,) reaction, and not in other studies. Therefore, it is not excluded that this observation was actually a target contaminant, which it was not possible to establish in the measurements due to limitations in the focal plane detector. We note further that the and states have been shown by the FMD calculation [25] to be nearly degenerate at the excitation energy MeV. Consequently, the probability is high that the state is indeed the peak observed at MeV in the 240 MeV (C spectrum [12].
| Transitions | Calc. | Exp. | Ref. | |||
| (MeV) | (MeV) | (e2fm2λ) | (e2fm2λ) | |||
| 2 | 4.5 | 4.44 | 8.5 | [28] | ||
| 28.5 | ||||||
| 0 | 8.1 | 7.65 | 6.7 | [29] | ||
| 25.5 | [30] | |||||
| 511 | ||||||
| 3 | 10.8 | 9.64 | 106 | [31] | ||
| 137 | ||||||
| 0 | 10.7 | 10.3 | 2.3 | |||
| 1553 | ||||||
| 2 | 10.6 | 0.4 | [12] | |||
| 102 | ||||||
| 13.5 | ||||||
| 1071 | ||||||
| 1 | 12.6 | 10.84 | 1679 | |||
| 2.56 |
To further investigate the excitation of the state in the (C experiment, we have used the AMD nuclear transition densities in our folding model analysis of inelastic C scattering data measured with high precision at MeV [12] and 386 MeV [13, 14]. A generalized double-folding method [21] was used to calculate the complex C potential as the following Hartree-Fock-type matrix element of the complex CDM3Y6 interaction [22, 32].
| (4) |
where and are states of 12C target in the entrance- and exit channels of the C scattering, respectively. Thus, Eq. (4) gives the (diagonal) elastic optical potential (OP) if and inelastic scattering FF if otherwise. The complex density-dependent direct and exchange parts of the CDM3Y6 interaction were taken the same as those parametrized recently [22] for the study of Pb scattering at 240 and 386 MeV. The accurate local density approximation suggested in Refs. [22, 33] has been used for the exchange term in Eq. (4). All the DWBA and CC calculations have been performed using the CC code ECIS97 written by Raynal [34]. The real and imaginary elastic folded potential were scaled by the coefficients and , respectively, for the best optical model (OM) fit of the elastic scattering data: and for and 386 MeV, respectively. These same factors were used to scale the real and imaginary inelastic folded FF for the DWBA calculation, a standard method used so far in the folding + DWBA analysis of inelastic -nucleus scattering [12, 21, 36]. Since and are an approximate way to take into account the higher-order (dynamic polarization) contributions to the microscopic OP [21], they must be readjusted again in the CC calculation to account for those nonelastic channels that were not included into the CC scheme. We then obtained and from the CC calculations for and 386 MeV, respectively. These factors were also used to scale the complex inelastic folded FF used in the CC calculation. The OM and CC descriptions of the elastic C scattering at 240 MeV are shown in upper panel of Fig. 1.
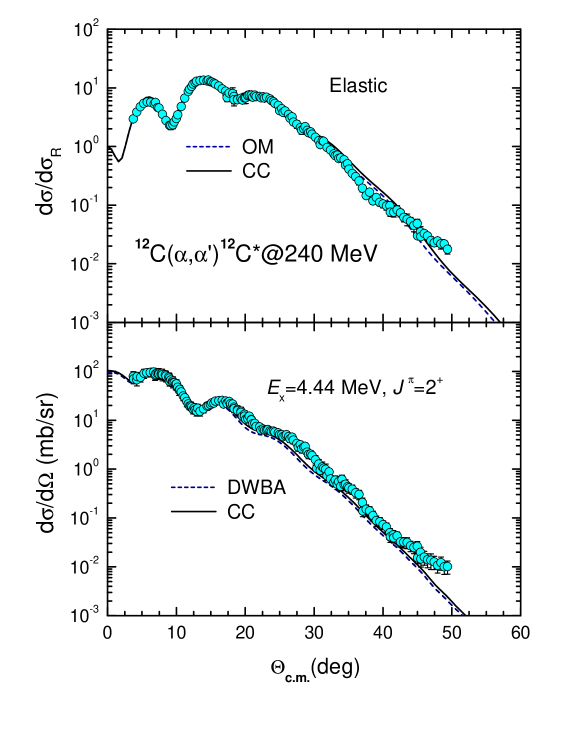
Our OM calculation not only well describes the elastic data but also gives the total reaction cross sections very close to the experimental values measured at the nearby energies. Thus, the (complex) double-folded OP should be accurate enough for the DWBA or CC analysis of inelastic C scattering. For the state, the electric transition rate predicted by the AMD, fm4, agrees perfectly with the measured value of fm4 [28], and the corresponding inelastic FF describes the measured (C cross section quite satisfactory in both the DWBA and CC calculations (see lower panel of Fig. 1). The calculated (C cross section for the state slightly underestimates the data at large angles and this could well be due to a strong refractive effect that implies a weaker absorption in the considered inelastic (C channel [35]. While the state has been observed in the spectra of all inelastic (C experiments, the situation with the state remains quite uncertain. Given the possible peak of the state located at MeV as deduced by Freer et al. from the (C spectrum [17], in the same location as the first state, it is highly suspected that the peak could have been merged with the strong peak of the state and not observed in most of the measured (C spectra. In general, a state should have angular distribution oscillating out-of-phase compared with that of the state and that effect could well be revealed in the (C angular distribution measured for the excitation energy MeV if the cross section is strong enough.
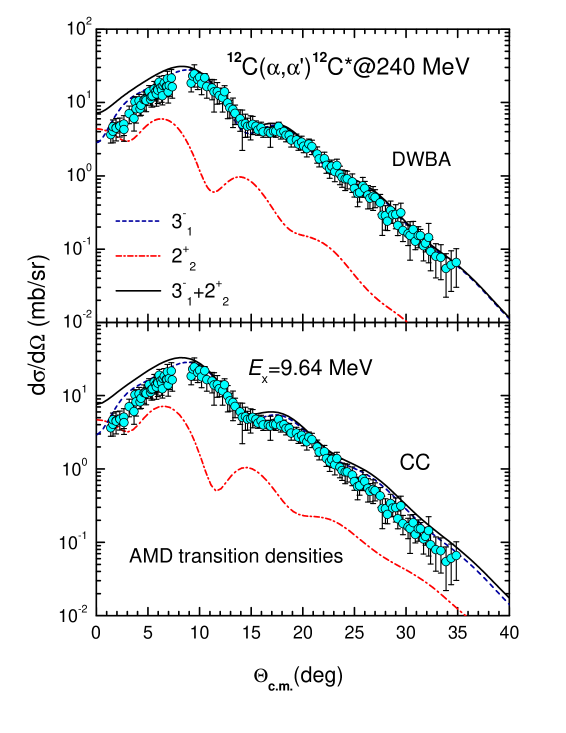
To investigate this effect we have made the DWBA calculation of inelastic C scattering at 240 MeV to the and states and the calculated cross sections are compared with the data for the state in upper panel of Fig. 2. With the AMD transition density giving the electric transition rate rather close to the measured value (see Table 1), the inelastic FF based on the AMD transition density describes the measured (C cross section for the state quite well. Compared to the cross section, the predicted inelastic scattering cross section for the state is much weaker, with the ratio of integrated C cross sections . Such a strength ratio agrees reasonably with the upper limit of about 15% for the excitation strength of the state versus that of the state deduced recently from the (12C,12CC experiment at MeV [18].
Due to the reversed oscillating pattern, the angular distribution is strongest versus the one at the most forward angles. At angles , the total cross section calculated in the DWBA nearly coincides with the cross section. The (C data points at forward angles also indicate strongly that the data are indeed deduced for the cross section and the contamination from the state, if any, must be negligible. Therefore, in the case of 240 MeV data the excitation strength of the state should be much smaller than 12.8% of the excitation strength if it is located at MeV.
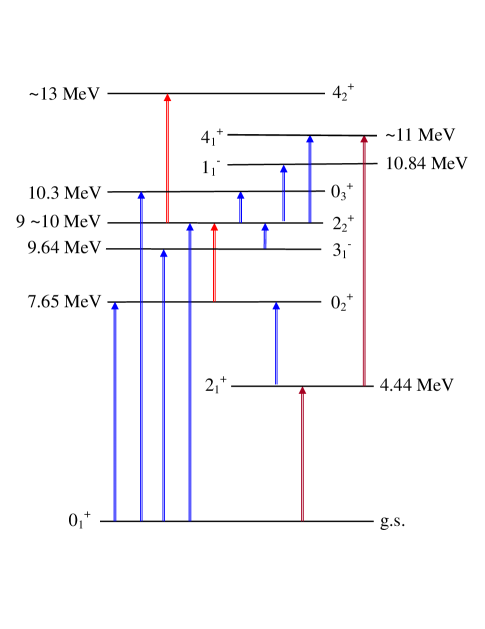
It should be recalled that DWBA only treats the direct excitation and one needs to perform the coupled-channel calculation in order to take into account contribution of the two-step excitation of the state via the excited states of 12C lying around MeV (see, e.g., very strong transitions from the Hoyle state or state to the state in Table 1). For this purpose, we have computed the AMD nuclear transition densities for all 13 transitions listed in Table 1 and obtained the corresponding inelastic scattering FF by the double-folding method (4) for the CC calculation. The coupling scheme is illustrated in Fig. 3 and the CC results for inelastic scattering to the state are shown in lower panel of Fig. 2. One can see that the contribution of the two-step excitation of the state to the (C cross section is rather small but not negligible. It increases the cross section by at least 10% and, hence, gives the ratio of integrated cross sections . Because the transition linking the and states is quite strong (see Table 1), the CC effect also enhances slightly the cross section. Nevertheless, it can be seen from Fig. 2 that the direct (one-step) excitation of the state is still dominant in the inelastic C scattering at 240 MeV. Given a weak transition rate fm4 predicted by the AMD, the peak should be very difficult to disentangle from the (C spectrum if it stands just behind the strong peak. Moreover, the CC results and (C data points at forward angles (lower panel of Fig. 2) confirm consistently that the data points are indeed those for the state and the mixture of the state should be negligible. In other words, the contribution of the state to the inelastic (C cross section at MeV seems to be strongly suppressed in this case. To go down in the beam energy might be a possibility to trace such a contribution because of stronger CC effects. For example, our folding model analysis of the elastic and inelastic C data at MeV [37, 38] has shown that the CC effects substantially increase the ratio (from 12.6% in the DWBA up to about 27% in the CC results). However, no angular distribution has been measured for the state at this energy and it is, therefore, difficult to make a similar discuss about the state.
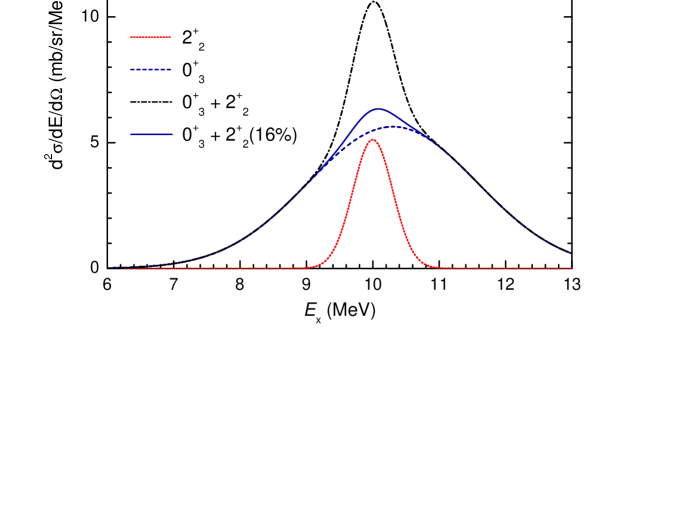
Situation becomes more complicated when we move up by about 500 keV in the excitation energy to the peak at MeV. The predicted ratio of integrated cross sections is in the DWBA calculation of (C scattering at 240 MeV. Therefore, if the state is located around 10 MeV, the (C cross section for the state should strongly interfere with that of the state but such an effect has not been reported experimentally [12]. To investigate this effect we have made an inverse multipole decomposition analysis by spreading the inelastic C scattering cross sections at , predicted in the DWBA for the and states, into the Gaussians of 3 MeV and 0.6 MeV widths, respectively, as deduced for the peak from the (C spectrum at MeV [12] and for the possible peak from the (C spectrum at MeV [17].
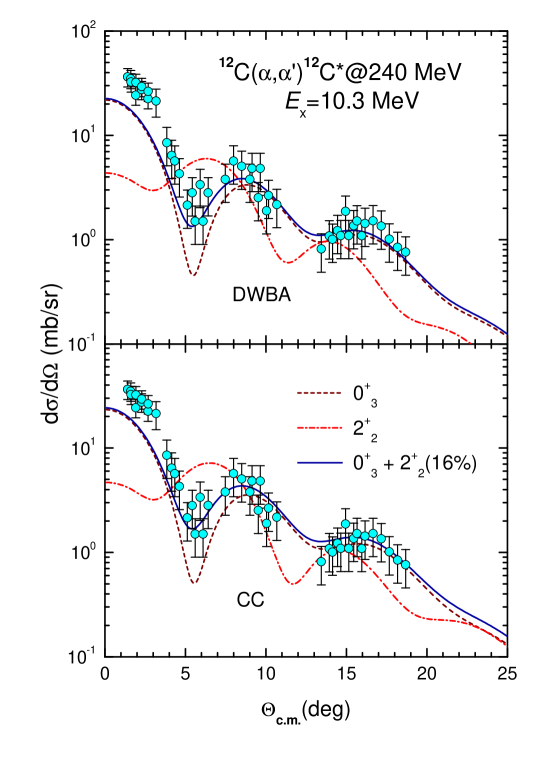
The results of this decomposition analysis are plotted in Fig. 4 where the area of each Gaussian has been normalized to the predicted DWBA cross section and the centroids of the and peaks assumed to be around 10.3 and 10 MeV, respectively. Given no strong interference between the and angular distributions observed in the 240 MeV experiment, we have tried to trace the remnant of the state by reducing its strength in such a way that the centroid of the sum of two Gaussians () remains within the experimental value of MeV as deduced from the 240 MeV data [12] for the peak. Namely, by reducing the cross section to around 16% of its predicted strength at , we obtained the sum of the two () Gaussians centered at MeV (see solid curve in Fig. 4). To further trace such a remnant of the state in the (C cross section at 240 MeV we have made the DWBA calculation using the inelastic FF’s given by the full AMD transition densities for the and states as well as the FF given by the AMD transition density for the state scaled by a factor of 0.4 that corresponds to the 16% reduction of the cross section. From the comparison of these DWBA results with the measured angular distribution for state in upper panel of Fig. 5 one can see that the AMD transition density for the state describes the data quite reasonably and, hence, the monopole transition moment given by the AMD (see Table 1) should be close to the realistic value. Although rather small, the 16% contribution of the cross section helps to significantly improve the agreement with the data at the diffractive minimum around . The scaling of the AMD transition density for the excitation by a factor of 0.4 shows the measure of suppression of the state in this case. If we apply the same scaling to the mixture of the state in the spectrum of the state then the ratio that is too small to be extracted from the measured spectrum for the peak around 9.6 MeV. Independently, such a conclusion can be well drawn from the measured data shown in Fig. 2. Therefore, it is reasonable to assume in the CC calculation of the (C cross sections for the and states at MeV the same scaling for all inelastic FF corresponding to the transitions to and from the state shown in Fig. 3. The CC results obtained with the scaled inelastic FF are shown in lower panel of Fig. 5. We found that the coupling effects enhance the cross section by about 50%, with a slight change of the cross section, and that leads to a much better agreement with the data points over the whole angular region. The improved agreement with the data points by the CC results indirectly indicate that the contribution from the state is not negligible as in the case of the state and it smoothens the measured angular distribution at 240 MeV as shown in Fig. 5. In other words, about 40% of the predicted strength of the AMD wave function could be hidden in (C spectrum measured at 240 MeV for the state. The AMD calculation has shown that the and states have quite similar extended cluster structures (see Fig. 5 of Ref. [11]) and are almost degenerate at MeV. The most striking is a very strong “interband” transition fm4, predicted by the AMD, which helps to enhance the cross section by about 50% in the CC calculation. Thus, we have found that a ghost of the state seems to be present in the measured angular distribution and following conclusions can be drawn from our CC analysis of the 240 MeV (C data:
-
1.
If the state is located at the peak observed at MeV then its width should be large enough to allow a tail of this peak to overlap with the broad peak. A direct CC analysis of the (C cross section measured for the energy bin centered at 11.46 MeV using the AMD wave function might solve this issue but no experimental angular distribution is available for that purpose.
-
2.
If the state is located at MeV, as predicted by some cluster calculations, then it should be hindered by the strong peak and only a weak fraction of its strength (about 16%) is mixed with the broad peak.
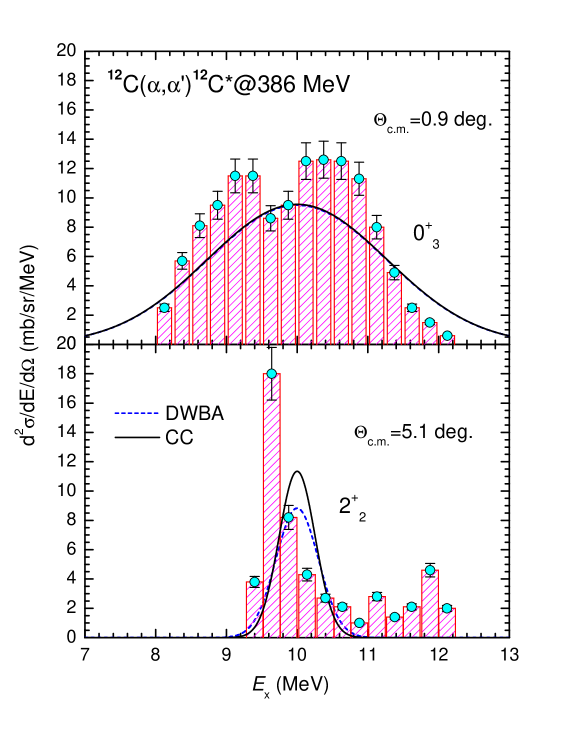
The measured angular distribution has been subjected to a multipole decomposition analysis to disentangle contribution of different multipolarities () to the excitation of 12C in each energy bin, in the same way as done, e.g., in the inelastic -scattering study of IS giant resonances in 208Pb [39]. It is, therefore, possible to compare the predicted AMD transition strengths for the and state with the experimental spectrum at some particular scattering angle. For this purpose, we have done similar decomposition of the 386 MeV (C cross sections at and , predicted in the DWBA and CC formalism for the and states, respectively, and the results are plotted in Fig. 6 together with the corresponding double differential cross section measured at MeV [13]. As can be seen in upper panel of Fig. 6, the AMD transition density for the state accounts fairly well for the data points measured at the forward angle, with the integrated cross section (over the excitation energy) mb/sr compared to the experimental value of around mb/sr. Contrary to the situation for the state in the 240 MeV case, the full transition strength predicted by the AMD still significantly underestimates the observed strength (see lower panel of Fig. 6), with the DWBA integrated cross section mb/sr at compared to the experimental value of around mb/sr.
It becomes obvious now that in the case of the state of 12C one has to deal with about the same experimental difficulty as that in a study of isoscalar giant resonances, in disentangling different IS excitation modes when their energies overlap. In this sense, it is of interest to apply our AMD + folding approach to the inelastic C scattering data measured at MeV by Itoh et al. [13, 14]. We note that these authors were able to measure the (C energy spectrum without contamination from the instrumental background by using the high-resolution magnetic spectrometer Grand Raiden, and the (C angular distribution has been deduced for each 250 keV energy bin in the excitation energy range MeV [13, 14].
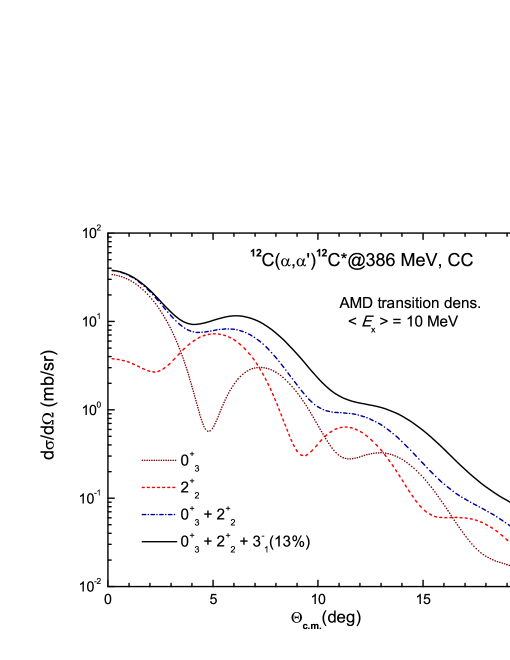
The CC calculation enhances the integrated cross section to mb/sr that is still well below the experimental value. Because the strongest peak in the experimental spectrum of the state is located at MeV, in about the same position as that of the state, it is not excluded that this experimental spectrum has some contamination from the transition strength of the state [40]. Moreover, as shown in our recent folding model analysis of inelastic Pb scattering to the IS giant resonances in 208Pb, the IS transition strengths for a given -pole excitation given by the MDA of the data measured at 240 MeV [41] and 386 MeV [39] could be slightly different due to possible contribution from the pickup/breakup reaction as well as different maximum values taken into account in the MDA. Keeping in mind possible uncertainty of the MDA, we have made an estimation of the contamination in the experimental spectrum measured at 386 MeV for the state, based on the IS transition strengths predicted by the AMD [11]. To achieve a visually good agreement of our CC results with the preliminary data measured at 386 MeV for the total cross section summed over the energy bins around MeV [14], we need to add to the predicted cross section a significant contribution from the cross section. These CC results are shown in Fig. 7 and one can see that the contamination by the cross section in the measured angular distribution could be up to 13% or more. Therefore, we conclude that at least 36% of the predicted strength of the wave function could be hidden in the measured 386 MeV (C cross section shown in Fig. 2 of Ref. [14]. Such a mixture of the state could also affect the angular correlation function of the -decay from the excited 12C∗ nucleus at MeV (see Fig. 3 in Ref. [14]). Nevertheless, the fact that the full (direct and indirect) transition strengths predicted for the state still underestimate the measured (C spectrum (see Fig. 6) and angular distribution (see Fig. 7) indicates that the authors of Refs. [13, 14] were able to extract the full transition strength of the state from the 386 MeV (C spectrum, even though the peak is located right behind the strong peak.
In conclusion, a detailed folding model analysis of the (C data at 240 and 386 MeV in the DWBA and CC formalism has been performed, using the nuclear transition densities predicted by the AMD approach and a complex CDM3Y6 interaction. From the structure point of view, given a very weak transition rate predicted by the AMD, the direct excitation of the state should be an unlikely event in any reaction and that could be the reason why it was so difficult to identify the state in the excitation energy- and/or -decay spectra of 12C. Nevertheless, we have shown here some evidence for a ghost of the state in the 240 MeV (C angular distribution measured at MeV, which should be a tail of the peak located either at 11.46 MeV or right behind the peak at 9.64 MeV. In addition to the weak transition , the strong peak was shown to be the main hindrance for the experimental identification of the state.
The AMD transition densities account reasonably for the relative contributions from the and states to the 386 MeV (C angular distribution measured at MeV. We also found a contamination of about 13% from the state in this angular distribution. Although the state was found to be located near the strong peak, its full strength has been carefully deduced from the 386 MeV (C spectrum and these data [13, 14] remain so far the only experimental evidence of the state at MeV.
Finally, going down in the beam energy might be an alternative to search for the peak in the (C measurement because of very strong indirect transition that can be induced as a two-step excitation of the state in the CC scheme. However, before discussing the indirect excitation of the state, we must check which reaction channel is more likely for the Hoyle state: the direct -decay or isoscalar excitation. That should be an interesting perspective for a future study of inelastic C reaction within the coupled reaction channel formalism.
Our study has been inspired by tireless experimental efforts by Martin Freer to search for the state of 12C. We also thank Peter Schuck for his stimulating and encouraging discussions. Communications with M. Itoh, T. Kawabata and X. Chen on the measured (C data are highly appreciated. The present research has been supported, in part, by the National Foundation for Scientific and Technological Development (NAFOSTED) under Project Nr. 103.04.07.09.
References
- [1] M. Freer, Rep. Prog. Phys. 70 (2007) 2149.
- [2] Y. Funaki, H. Horiuchi, W. von Oertzen, G. Röpke, P. Schuck, A. Tohsaki, T. Yamada, Phys. Rev. C 80 (2009) 064326.
- [3] E. Uegaki, S. Okabe, Y. Abe, H. Tanaka, Prog. Theor. Phys. 57 (1977) 1262.
- [4] M. Kamimura, Nucl. Phys. A 351 (1981) 456; M. Kamimura, private communication.
- [5] R. Pichler, H. Oberhummer, A. Csoto, S.A. Moszkowski, Nucl. Phys. A 618 (1997) 55.
- [6] A. Tohsaki, H. Horiuchi, P. Schuck, G. Röpke, Phys. Rev. Lett. 87 (2001) 192501.
- [7] Y. Funaki, A. Tohsaki, H. Horiuchi, P. Schuck, G. Röpke, Phys. Rev. C 67 (2003) 051306(R).
- [8] M. Chernykh, H. Feldmeier, T. Neff, P. von Neumann-Cosel, A. Richter, Phys. Rev. Lett. 98 (2007) 032501.
- [9] Y. Funaki, A. Tohsaki, H. Horiuchi, P. Schuck, G. Röpke, Eur. Phys. J. A 24 (2005) 321.
- [10] C. Kurokawa and K. Katō, Nucl. Phys. A 738 (2004) 455.
- [11] Y. Kanada-En’yo, Prog. Theor. Phys. 117 (2007) 655.
- [12] B. John, Y. Tokimoto, Y.W. Lui, H.L. Clark, X. Chen, D.H. Youngblood, Phys. Rev. C 68 (2003) 014305.
- [13] M. Itoh et al., Nucl. Phys. A 738 (2004) 268.
- [14] M. Itoh et al., Proc. of the 23rd Intern. Nucl. Phys. Conf. (INPC2007), Elsevier B.V., 2008, p.371.
- [15] M. Freer et al., Phys. Rev. C 76 (2007) 034320.
- [16] C. Aa. Diget et al., Phys. Rev. C 80 (2009) 034316.
- [17] M. Freer et al., Phys. Rev. C 80 (2009) 041303(R).
- [18] T. Muñoz-Britton et al., J. Phys. G 37 (2010) 10510.
- [19] D.T. Khoa, D.C. Cuong, Phys. Lett. B 660 (2008) 331.
- [20] D.T. Khoa, Intern. J. Modern Phys. E 17 (2008) 2055.
- [21] D.T. Khoa, G.R. Satchler, Nucl. Phys. A 668 (2000) 3.
- [22] D.C. Cuong, D.T. Khoa, G. Colò, Nucl. Phys. A 836 (2010) 11.
-
[23]
Y. Kanada-En’yo, H. Horiuchi, A. Ono, Phys. Rev. C 52 (1995) 628;
Y. Kanada-En’yo, H. Horiuchi, Phys. Rev. C 52 (1995) 647. -
[24]
M.N. Harakeh, A.E.L. Dieperink, Phys. Rev. C 23 (1981) 2329;
N.V. Giai, H. Sagawa, Nucl. Phys. A 371 (1981) 1. - [25] T. Neff, private communication on the FMD results (unpublished).
- [26] F. Ajenberg-Selove, Nucl. Phys. A 433 (1985) 1.
- [27] G.M. Reynolds, D.E. Rundquist, R.M. Poichar, Phys. Rev. C 3 (1971) 442.
- [28] S. Raman, C.W. Nestor Jr., P. Tikkanen, At. Data and Nucl. Data Tables 78 (2001) 1.
- [29] P. Strehl, Z. Phys. 234 (1970) 416.
- [30] P.M. Endt, At. Data and Nucl. Data Tables 23 (1979) 3; F. Ajenberg-Selove, Nucl. Phys. A 506 (1990) 1.
- [31] T. Kibedi, R.H. Spear, At. Data and Nucl. Data Tables 80 (2002) 35.
- [32] D.T. Khoa, G.R. Satchler, W. von Oertzen, Phys. Rev. C 56 (1997) 954.
- [33] D.T. Khoa, Phys. Rev. C 63 (2001) 034007.
- [34] J. Raynal, in Computing as a Language of Physics (IAEA, Vienna, 1972) p.75; J. Raynal, coupled-channel code ECIS97 (unpublished).
- [35] D.T. Khoa, W. von Oertzen, H.G. Bohlen, S. Ohkubo, J. Phys. G 34 (2007) R111.
- [36] G.R. Satchler, D.T. Khoa, Phys. Rev. C 55 (1997) 285.
- [37] G. Hauser, R. Löhken, H. Rebel, G. Schatz, G.W. Schweimer, J. Specht, Nucl. Phys. A 128 (1969) 81.
- [38] J. Specht, G.W. Schweimer, H. Rebel, G. Schatz, R. Löhken, G. Hauser, Nucl. Phys. A 171 (1971) 65.
- [39] M. Uchida et al., Phys. Rev. C 69 (2004) 051301(R).
- [40] M. Itoh, private communication (unpublished).
- [41] D.H. Youngblood, Y.W. Lui, H.L. Clark, B. John, Y. Tokimoto, X. Chen, Phys. Rev. C 69 (2004) 034315.