SN 2009bb: a Peculiar Broad-Lined Type Ic Supernova11affiliation: This paper includes data gathered with the 6.5-m Magellan Telescopes located at Las Campanas Observatory, Chile. 22affiliation: Based on observations obtained at the Gemini Observatory, Cerro Pachon, Chile (Gemini Programs GS-2009A-Q-17 and GS-2009A-Q-43).
Abstract
Ultraviolet, optical, and near-infrared photometry and optical spectroscopy of the broad-lined Type Ic supernova (SN) 2009bb are presented, following the flux evolution from 10 to 285 days past -band maximum. Thanks to the very early discovery, it is possible to place tight constraints on the SN explosion epoch. The expansion velocities measured from near maximum spectra are found to be only slightly smaller than those measured from spectra of the prototype broad-lined SN 1998bw associated with GRB 980425. Fitting an analytical model to the pseudo-bolometric light curve of SN 2009bb suggests that 4.11.9 M☉ of material was ejected with 0.22 0.06 M☉ of it being 56Ni. The resulting kinetic energy is 1.80.7 erg. This, together with an absolute peak magnitude of MB 18.360.44, places SN 2009bb on the energetic and luminous end of the broad-lined Type Ic (SN Ic) sequence. Detection of helium in the early time optical spectra accompanied with strong radio emission, and high metallicity of its environment makes SN 2009bb a peculiar object. Similar to the case for GRBs, we find that the bulk explosion parameters of SN 2009bb cannot account for the copious energy coupled to relativistic ejecta, and conclude that another energy reservoir (a central engine) is required to power the radio emission. Nevertheless, the analysis of the SN 2009bb nebular spectrum suggests that the failed GRB detection is not imputable to a large angle between the line-of-sight and the GRB beamed radiation. Therefore, if a GRB was produced during the SN 2009bb explosion, it was below the threshold of the current generation of -ray instruments.
1 Introduction
A decade has passed since the discovery of the association between the long-duration Gamma Ray Burst (GRB) 980425 and the broad-lined Type Ic SN 1998bw (Galama et al., 1998; Patat et al., 2001). This realization led to a renewed interest in the study of stripped-envelope core-collapse supernovae (SNe). In the case of SN 1998bw, the high kinetic energy inferred from the expansion velocity coupled with an exceedingly high luminosity and strong radio emission set it apart from all other previously-observed core-collapse SNe. Since then these attributes have been shown also by other GRB-related SNe like SN 2003lw (Malesani et al., 2004; Gal-Yam et al., 2004) and SN 2003dh (Stanek et al., 2003; Hjorth et al., 2003; Matheson et al., 2003). The X-ray flash SN 2006aj (Pian et al., 2006; Modjaz et al., 2006; Sollerman et al., 2006; Ferrero et al., 2006; Kocevski et al., 2007), was not as extreme as the previous SNe, nevertheless it shows expansion velocity much higher then normal Type Ic SNe.
In addition to these GRB related, broad-lined SNe Ic, there have also been a number of other discovered broad-lined events that are apparently not associated with a GRB, e.g. SN 1997ef, (Matheson et al., 2001), SN 2002ap (Gal-Yam, Ofek & Shemmer, 2002; Foley et al., 2003; Yoshii et al., 2003), SN 2003jd (Valenti et al., 2008) and SN 2007ru (Sahu et al., 2009). Recently two other broad-lined events have been published that underscore the heterogeneous nature of this family of SNe. In particular, early phase spectra of the broad-lined Type Ic SN 2007bg exhibit evidence of helium (Young et al., 2010), while Hamuy et al. (2009) have presented the first case of a hydrogen-rich broad-lined Type IIb SN 2003bg.
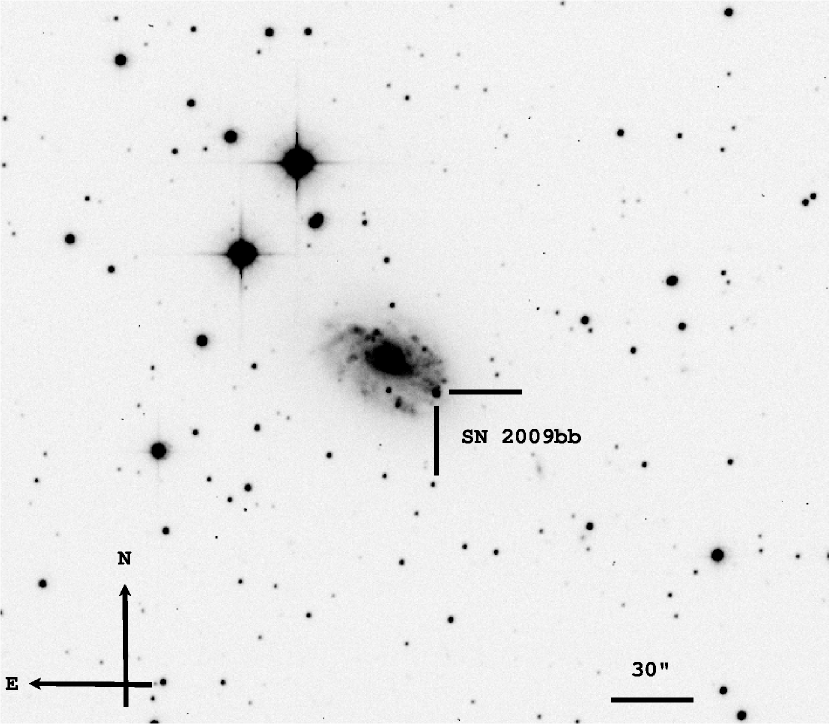
In this paper we present ultraviolet, optical and near-infrared photometry and optical spectroscopy of SN 2009bb. This object was discovered by the CHilean Automated Supernova sEarch CHASE (Pignata et al., 2009a) on 2009 March 21.11 UT with the Panchromatic Robotic Optical Monitoring and Polarimetry Telescope (PROMPT) 3 at the Cerro Tololo Inter-American Observatory (CTIO).161616Cerro Tololo Inter-American Observatory, Kitt Peak National Observatory, National Optical Astronomy Observatories, operated by the Association of Universities for Research in Astronomy, Inc., (AURA), under cooperative agreement with the National Science Foundation. The SN is located (see Figure 1) at and (equinox J2000) (Pignata et al., 2009b), which is about 170 west and 135 south of the center of the host galaxy NGC 3278. SN 2009bb was not visible in an unfiltered CHASE image (mag 19.2) obtained two days prior to the discovery image on 2009 March 19.20 UT. We were therefore able to use this image in combination with the first follow-up images to obtain a tight constraint on the explosion epoch (see section 2.3).
As this was an extremely young SN, an intensive follow-up campaign was organized using the PROMPT telescopes (Reichart et al., 2005) and the facilities available to the Carnagie Supernova Project (CSP; Hamuy et al. 2006) at Las Campanas Observatory (LCO). A week after discovery, Stritzinger et al. (2009) classified SN 2009bb as a broad-lined SN Ic.
Radio and X-ray observations were obtained with the VLA and Chandra telescope. An analysis of these data indicates that SN 2009bb was associated with strong radio emission and mild X-ray emission (Soderberg et al., 2010). These findings are suggestive of the presence of a relativistic outflow typically associated with GRB-related SNe.
The explosion site of SN 2009bb has been studied in detail by Levesque et al. (2010a) who showed that contrary to other jet-driven SN explosions, which to date have always been identified with metal poor environments [see Modjaz et al. (2008) for a review], the explosion site of SN 2009bb exhibits a metallicity between 1.7 to 3.5 Z☉. Levesque et al. (2010b) also found a super-solar metallicity for the environment of the long-duration GRB 020819. These findings present a challenge to the theoretical framework developed to explain GRBs (Woosley & Heger, 2006). However, Dessart et al. (2008) have recently proposed a model in which the progenitor star does not need to be in a low metallicity environment. In this scenario SN 2009bb represents a peculiar object that could open new theoretical developments.
The organization of this article is as follows. The photometric data are analyzed in Section 2, and in Section 3 the pseudo-bolometric light curve is used to estimate some physical parameters of SN 2009bb. An analysis of the spectroscopic evolution of SN 2009bb is carried out in Section 4, and Section 5 presents a discussion and summary of the major results. Observation and data reduction techniques are described in Appendix A.1 and A.2.
2 Optical and Near-Infrared Photometry
2.1 Light Curve
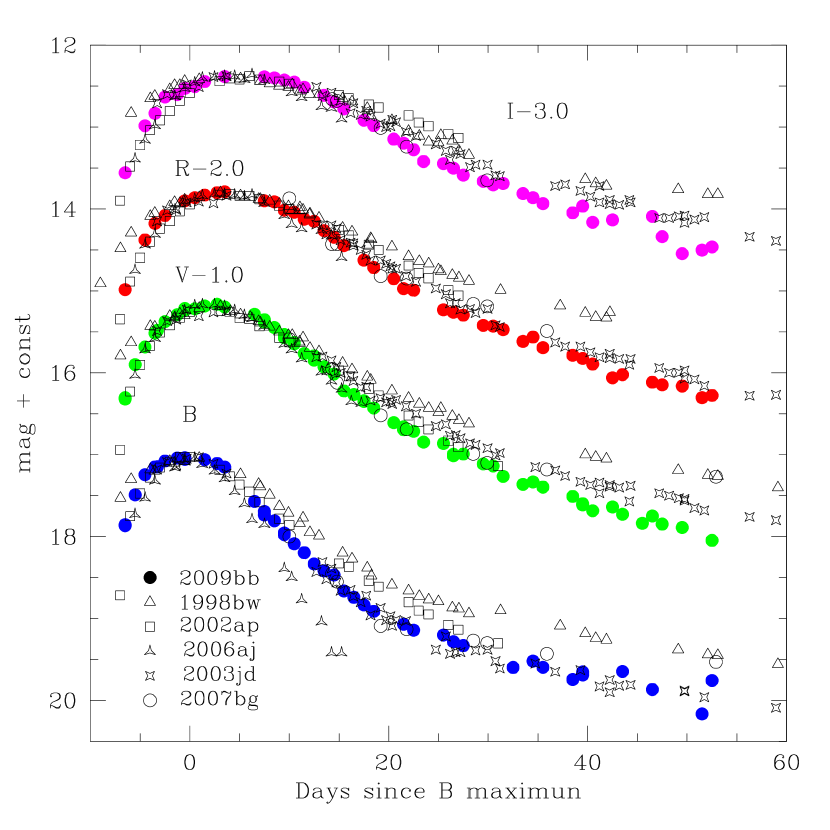
The photometry of SN 2009bb is reported in Table 1, while the light curves are shown in Figure 2. Also plotted in the latter figure are photometry of the broad-lined Type Ic SNe 1998bw, 2002ap, 2003jd, 2006aj and SN 2007bg. From this comparison of light curves, it is clear that in the bands during the pre-maximum phase, SN 2009bb, SN 2006aj and SN 2003jd show a similar evolution, while SN 1998bw and SN 2002ap have a slower and faster rise-time, respectively. In the band, SN 2009bb shows, with the exception of SN 1998bw, a slower rise than all the other SNe included in the plot. At post-maximum phases (epoch 20 days), the light curves of SN 2009bb decrease in magnitude faster than the other objects, except for SN 2006aj, which appears to be quite similar to SN 2009bb. This is not the case in the band where the SN 2006aj decline rate is clearly faster than that of SN 2009bb. In the latter band, the object that most resembles SN 2009bb is SN 2003jd, while SN 2002ap and SN 1998bw display much slower decline rates.
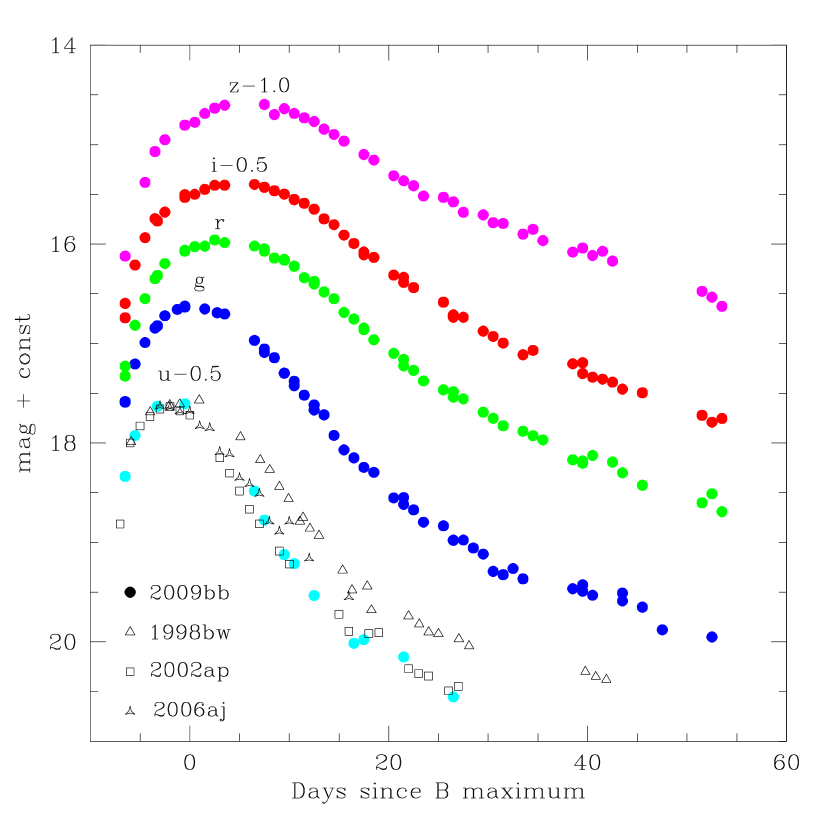
The photometry of SN 2009bb is reported in Table 2, while the light curves are shown in Figure 3. These are the first-ever observations of a broad-lined SN Ic in the Sloan bands. For comparison in the plot, we also include -band light curves of SN 1998bw, SN 2002ap and SN 2006aj. The light curve of SN 2009bb most resembles the -band observations of SN 2002ap, but again declines more rapidly than SN 1998bw. It should be stressed that Figure 3 compares light curves on different photometric systems, and therefore the comparison should be taken with caution.
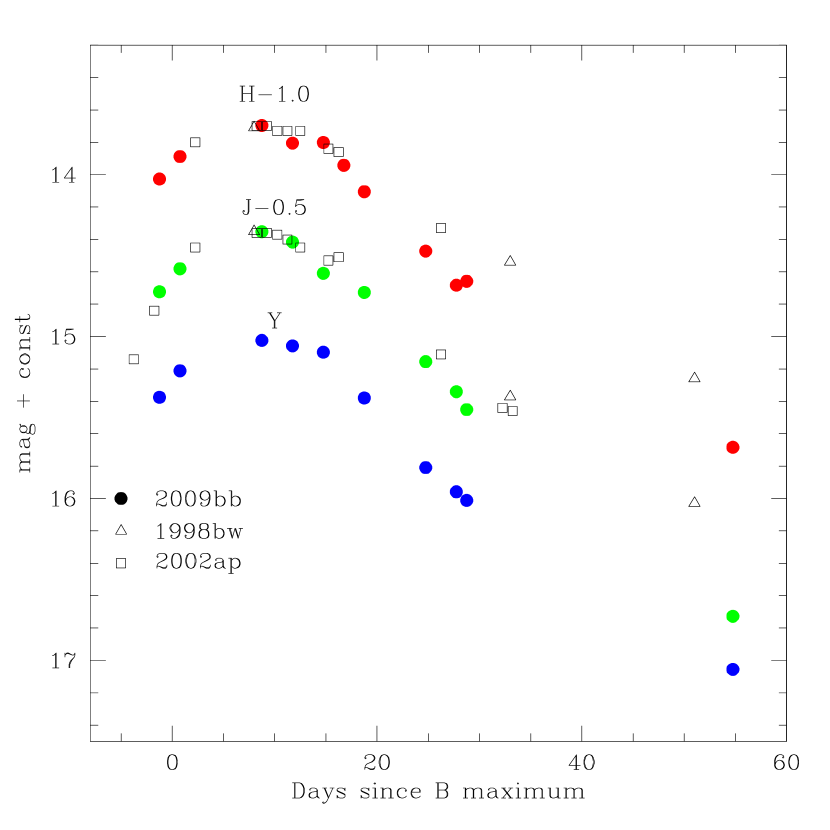
The photometry of SN 2009bb is reported in Table 3. In Figure 4, the near-infrared light curves of our SN are displayed together with those of SN 1998bw and SN 2002ap. As seen in the optical, the post-maximum evolution of SN 2009bb is slightly faster than that of SN 2002ap. In the case of SN 1998bw, the difference is larger, with the latter object being 0.7 and 0.2 magnitudes brighter than SN 2009bb in the and bands, respectively, at 50 days past maximum. Is is worth mentioning that part of this difference could be due to host galaxy contamination affecting the SN 1998bw infrared photometry (Patat et al., 2001).
For each optical and near-infrared band, the time and value of peak magnitude was estimated from low-order polynomial fits. The results are reported in Table 4. Similar to other SNe Ib/c, maximum light occurs in the blue followed by the red bands.
In Figure 5, the count rates in the and UVOT bands at the position of SN 2009bb are plotted. The fluxes were measured in a fixed aperture and, therefore, are the sum of the light coming from the SN and the background galaxy. From the plot, it is clear that in the filter, the background flux is already dominant at 6 days past maximum light. Assuming that the count rate measured in the last three observations is entirely due to the background, the SN 2009bb flux in the first observation can be estimated by subtracting the weighted average of the flux in these last three observations from the total count rate. Adding a zero point for the band of 17.49 0.03 (Poole et al., 2008), a value of 18.1 0.1171717Additional source of uncertainties related with the red wing of the filter are difficult to quantify due to the lack of spectra covering the band. Therefore, they were not included in the error budget is obtained for the magnitude of SN 2009bb at 6 days before maximum light.
2.2 Color Curves
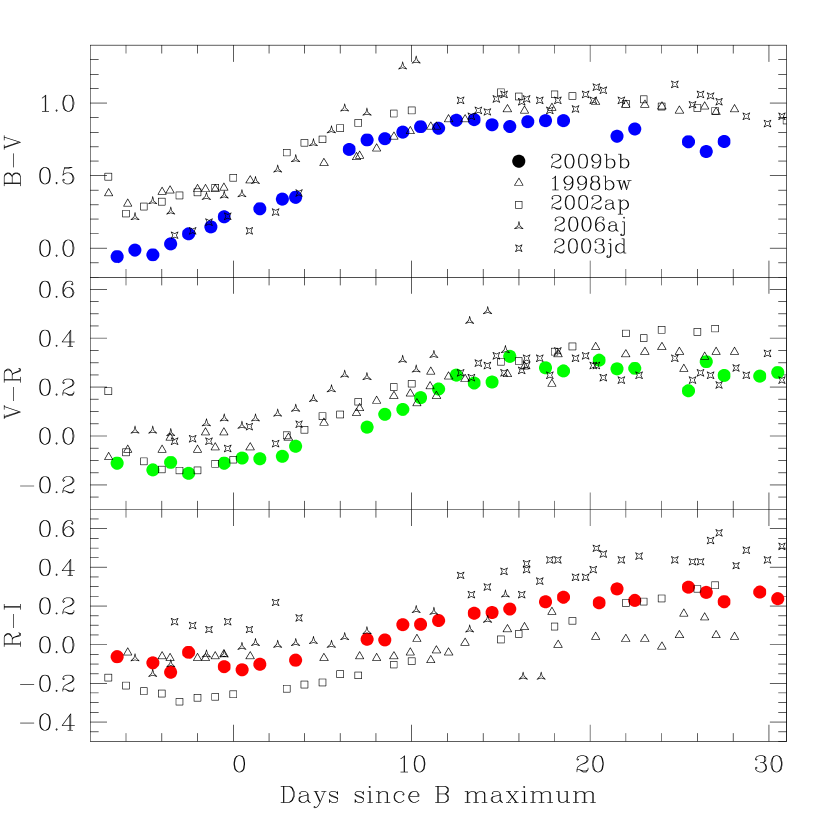
The de-reddened color curves of SN 2009bb are compared in Figure 6 with those of SN 1998bw, SN 2002ap, SN 2006aj, and SN 2003jd. In the case of SN 2009bb, a color excess of E() = 0.58 is assumed (see Section 3), while for SN 1998bw, SN 2002ap, SN 2003jd, and SN 2006aj, values of 0.06 (Patat et al., 2001), 0.08 (Foley et al., 2003), 0.14 (Valenti et al., 2008), and 0.18 (Sollerman et al., 2006; Campana et al., 2006), respectively, were adopted. It is worth mentioning that for all the latter SNe most of the reddening is produced in the Milky Way. All the authors cited above assumed little or no reddening in the host galaxy due to the absence of strong interstellar Na I D absorption in the SNe spectra. Since the correlation between Na I D and reddening has been shown to have a significant dispersion (Folatelli et al., 2010; Olivares et al., 2010; Stritzinger et al., 2010), the reddening estimates for these SNe should be taken with caution. To convert the color excesses to corrections for each band, we adopted an value of 3.1 (Cardelli, Clayton & Mathis, 1989).
As is seen in Figure 6, the color evolution of broad-lined SNe Ic show significant variations. This highlights the inadequacy of color indices to estimate host galaxy extinction for these events. The early phase color evolution of SN 2009bb is seen to be most comparable to that of SN 2003jd, while SN 1998bw is 0.2 mag redder at early and late epochs, but is similar to SN 2009bb between +10 and +20 days. In the case of , all SNe have very similar evolution except for SN 2006aj which is 0.2 redder. The color evolution of SN 2009bb is intermediate between SN 2002ap (bluer) and SN 2003jd (redder).
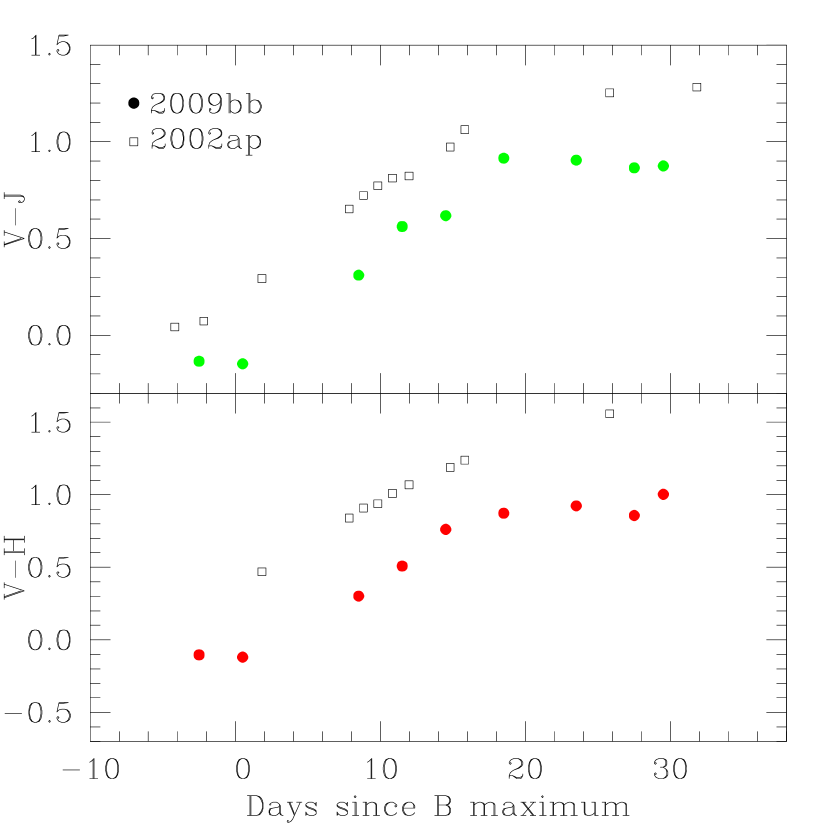
In Figure 7, we compare the reddening-corrected and color curves of SN 2009bb with those of SN 2002ap. The evolution of the two SNe is similar, but SN 2009bb is 0.3 and 0.5 mag bluer in and , respectively.
2.3 Explosion Date
The short time interval between the CHASE images with negative and positive detection of SN 2009bb allows us to place strong constraints on its explosion date. This is done through the use of a simple equation describing an expanding fireball:
| (1) |
where is the luminosity at time, , is a constant that defines the rate of the rise, n=1.8 (Conley et al., 2006), and is the time of explosion. Applying the equation (1) to the unfiltered light curve, we estimate that the explosion occurred on JD=2454909.6 0.6, which corresponds to the time of of our non-detection of SN 2009bb.
As demonstrated in Figure 8, the curve fits reasonably well the unfiltered light curve (reduced =3.1), except for the epoch of first detection.
3 Absolute Luminosity
To compute the absolute luminosity of SN 2009bb requires estimates of the host galaxy dust extinction and distance. One method to estimate the host reddening of SN 2009bb is to measure the Balmer decrement from the spectrum of the H II region located beneath the SN. To this end we use the two SN 2009bb nebular spectra acquired on Jan 9th and Feb 3th 2010181818In this spectrum there is not significant SN signal. In these spectra the signal-to-noise ratio of the H II region is higher than in the spectra taken at earlier epochs, while the SN flux is lower, allowing for a more precise measurement of emission from the Balmer lines. Obtaining an accurate estimate of the Hα and Hβ fluxes requires the removal of the light of the SN and any residual stellar contribution. This was accomplished by fitting a cubic spline to the underlying continuum in the spectrum. The resulting pseudo-continuum was then subtracted from the original spectrum. Comparing the measured flux ratio obtained from the “cleaned” spectra to the values listed in Osterbrock (1989) (for case B recombination, T=10000∘ K) and assuming the standard total-to-selective extinction ratio Rv = 3.1, we obtain a total reddening (host+Milky Way) of = 0.590.10 and = 0.570.10 for the 2010 Jan 9 and 2010 Feb 3 spectra, respectively. There is another (brighter) H II region located 0.3 North, 1.4 East of the SN. A measurement of the Balmer decrement from its spectrum gives a color excess of = 0.560.10, which is in good agreement with that obtained at the SN position. Given the similarity of the three estimates, we will assume the total reddening suffered by SN 2009bb to be the average of the values obtained from its two nebular spectra, i.e. =0.580.07.
An alternative method often used to estimate the reddening suffered along the line-of-sight to a SN is the equivalent width () of the interstellar Na I D absorption. The weighted average of the measured from seven of our low resolution spectra is Å. Taking into account relation between the Na I D EW and color excess reported in Turatto, Benetti & Cappellaro (2003), a value of and is implied for the lower and higher slope, respectively. This confirms that SN 2009bb was significantly extinguished. Nevertheless, since the Na I D lines are almost certainly saturated, this value of should be taken as a lower limit only. Combining the Galactic reddening obtained from the infrared dust maps of Schlegel, Finkbeiner & Davis (1998), 0.098, and the host galaxy value, we obtain a lower limit of the total reddening of and , respectively, bracketing the reddening obtained from the Balmer decrement.
Despite the relative proximity of NGC 3278, there are no direct distance measurements to this galaxy reported in the literature. We therefore must resort to the recession velocity and Hubble’s law to compute the distance to SN 2009bb. In the remainder of this paper we assume a distance modulus of as given in the NASA/IPA Extragalactic Database (NED). This value is obtained from a heliocentric velocity of 296137 km s-1 (Strauss et al., 1992), corrected for Virgo Infall and Great attractor (Mould et al., 2000), and assuming km s-1 Mpc-1 (Spergel et al., 2007). Using the maximum light magnitudes reported in Table 4, and the previously mentioned values of reddening and distance, we compute absolute magnitudes for the various bands that are listed in Table 4.
Figure 9 shows the pseudo-bolometric light curve of SN 2009bb, together with SN 1998bw, SN 2002ap, SN 2003jd and SN 2006aj, obtained by integrating the absolute flux in the bands. The peak luminosity of SN 2009bb is found to be close to that of SN 2006aj, and 60% of that of SN 1998bw.
To estimate the 56Ni content and the ejected mass, we integrated the flux of SN 2009bb contained within the bands. Also included was a band correction based on the SN 2002ap light curves (Yoshii et al., 2003). The resulting pseudo-bolometric light curve was then modeled making use of an analytical description for the peak of the light curve (Arnett, 1982). The model assumes spherical symmetry, homologous expansion, no mixing of 56Ni, radiation-pressure dominance, and the applicability of the diffusion approximation for photons, which restricts it to early phases ( 30 days post-explosion) when the density is sufficiently high to make the ejecta optically thick. We also assume constant opacity = 0.08 cm2 g-1 as computed for SN 1997ef by Mazzali et al. (2000). Chugai (2000) used a time variable opacity for modelling the SN 1998bw bolometric light curve which average value during the first 20 days after the explosion is = 0.07 cm2 g-1. We assume the uncertainty on visible opacity to be the difference of the previously mentioned values i.e. 0.01 cm2 g-1. In Arnett (1982) model, the time-evolution of luminosity is given by
| (2) |
where is the energy produced in 1 second by 1 gram of 56Ni, =t/ and =/2 with being the -folding time of the 56Ni decay and effective diffusion time, which determines the width of the bolometric light curve.
If is expressed as a function of , the ejecta mass, , and the photospheric velocity, at time of bolometric maximum, the effective diffusion time can be written (Arnett, 1982) as
| (3) |
In addition to the Mej and MNi parameters, there is also an additional free parameter, Trise, which is the time interval between explosion and the peak of the bolometric light curve. Finally, as proposed by Valenti et al. (2008), we include the contribution of the 56Co decay in equation 2.
In this analytic model, the photospheric velocity at the time of the maximum of the bolometric light curve is an input parameter. The velocity derived from the minimum of the Si II 6355 feature is often used as a proxy for the photospheric velocity. Nevertheless, several studies have found that in SN Ic the Si II 6355 could be contaminated by other species like detached He I 6678, Ne I 6402, detached Hα or detached C II 6580 (Clocchiatti et al., 1996; Branch et al., 2006; Sauer et al., 2006; Elmhamdi et al., 2006). Contamination from other ions could shift the minimum of the Si II 6355 feature in different direction at different epochs, biasing the estimation of the photospheric velocity. In spite of these shortcomings the Si II 6355 feature is still the most easy feature to measure, but a correction must be applied to derive a velocity as close as possible to the real photospheric velocity at a given epoch. To compute this correction we consider SN 1998bw, SN 2002ap and SN 2006aj, for which the evolution of the photospheric velocity was computed using the Montecarlo code described in Mazzali et al. (2001). Comparing the velocities measured from the minimum of the Si II 6355 absorption with those derived through the spectra modelling mentioned above, a difference of 3000 km s-1 is found. Assuming that this velocity shift also applies to SN 2009bb, we derive 15000 1000 km s-1 at the time of the bolometric maximum light (JD=2454923.1 0.7). The analytical model then yields MNi = 0.22 0.06 M☉, Mej = 4.1 1.9 M☉ and Trise=11.3 0.8 days. The uncertainties in the latter quantities were computed through Montecarlo simulations, taking into account the errors in the photospheric velocity, optical opacity, distance modulus, reddening and photometry. The resulting model is compared to the computed bolometric light curve in the insert of Figure 9.
The ejecta mass and photospheric velocity allow us to estimate the kinetic energy associated with the 2009bb explosion by comparing the pseudo-bolometric light curve of SN 2009bb with that of SN 2002ap, for which detailed modelling have been already carried out (Mazzali et al., 2002). To compute the kinetic energy, equation 3 can be written as follows:
| (4) |
Around maximum the pseudo-bolometric light curves of SN 2002ap and SN 2009bb are similar (see the rescaled pseudo-bolometric light curve of SN 2002ap in the insert of Figure 9). The decline rate of SN 2002ap is slightly slower than SN 2009bb. Around two weeks after maximum, which is the latest time we considered in the bolometric light curve fit, SN 2002ap reaches the same brightness of SN 2009bb 3 days later than the latter SN. Nevertheless, the rise to maximum of SN 2002ap seems to be faster than that of SN 2009bb. Computing the rise time of the bolometric light curve as difference between the explosion date and the epoch on which the bolometric light curve reach the maximum, we obtain a rise time of 13.5 and 10 days for SN 2009bb and SN 2002ap respectively. We therefore can assume . Taking into account that for SN 2002ap and = 4 1 erg (Mazzali et al., 2007), for SN 2009bb we obtain erg.
4 Evidence for a Central Engine
Radio observations of SN 2009bb spanning days after the explosion revealed evidence for an extraordinarily luminous, long-wavelength counterpart, with a spectral luminosity at GHz of (Soderberg et al., 2010). In comparison to the other nearby SNe Ibc observed in the radio on a similar timescale, SN 2009bb is a factor of 10 to more luminous, rivaling the radio afterglow luminosities of the nearest GRB-SNe, including GRB 980425 associated with SN 1998bw (Kulkarni et al., 1998). The multi-frequency radio observations were well described by a self-absorbed synchrotron spectrum, produced as the blast-wave shock-accelerated electrons in the local circumstellar medium. Just as in the case of SN 1998bw, the high brightness temperature of the SN 2009bb radio counterpart required an unusually large emitting region and, in turn, a trans-relativistic blast-wave velocity, . Moreover, the high radio luminosity implied a copious energy coupled to the fastest ejecta, erg. Soderberg et al. (2010) appealed to a model where this trans-relativistic ejecta component was powered by a different mechanism, a “central engine” (rapidly-rotating and accreting black hole or magnetar), as is commonly assumed for long-duration GRBs (MacFadyen, Woosley & Heger, 2001).
This model can be tested using the bulk explosion parameters (, ) for SN 2009bb derived from our well-sampled optical photometry and spectroscopy. Analytic solutions for the distribution of ejecta in Type Ibc SNe predict a steep coupling of energy and velocity within the homologously-expanding material,
| (5) |
(Matzner & McKee, 1999; Berger, Kulkarni & Chevalier, 2002). Based on an analysis of the optical dataset (see Section 3), we find bulk ejecta parameters of erg and . Within the homologous outflow, we therefore expect the ejecta traveling at to carry a kinetic energy of erg. This is at least three orders of magnitude below the energy budget required to power the trans-relativistic radio emitting ejecta. We conclude that the luminous synchrotron emission from SN 2009bb cannot be explained in the framework of a homologous SN explosion and another energy reservoir (i.e. a central engine) is required to explain the distribution of ejecta within this relativistic SN.
5 Spectroscopy
Optical spectra of SN 2009bb were obtained on thirteen epochs spanning phases between 2 and 285 days. Table 5 provides a log of these observations, and Figure 10 illustrates the spectral evolution.
5.1 General evolution
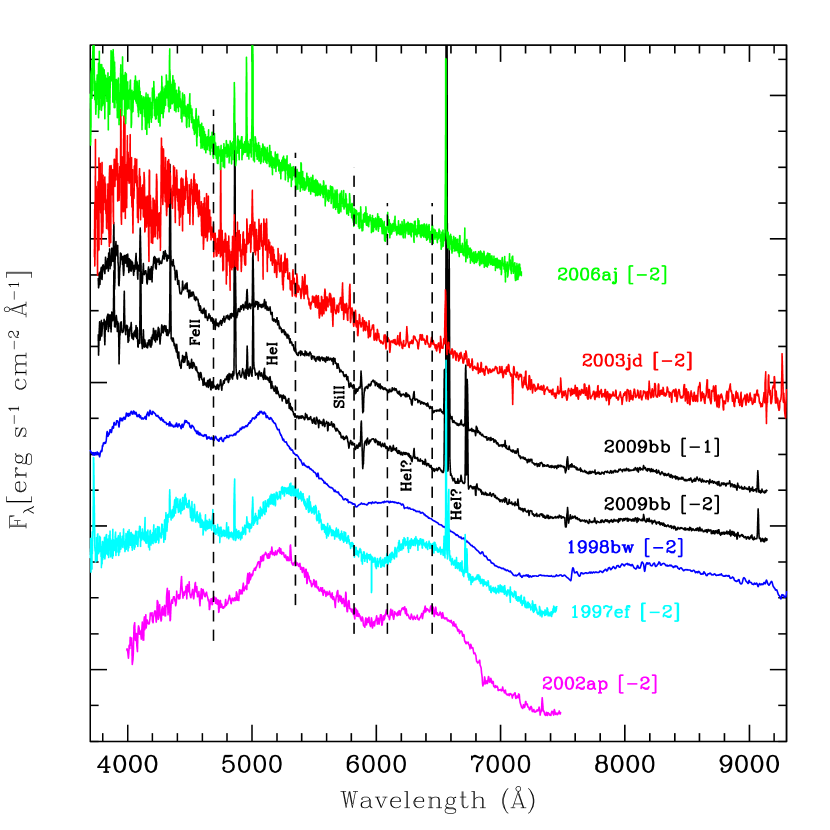
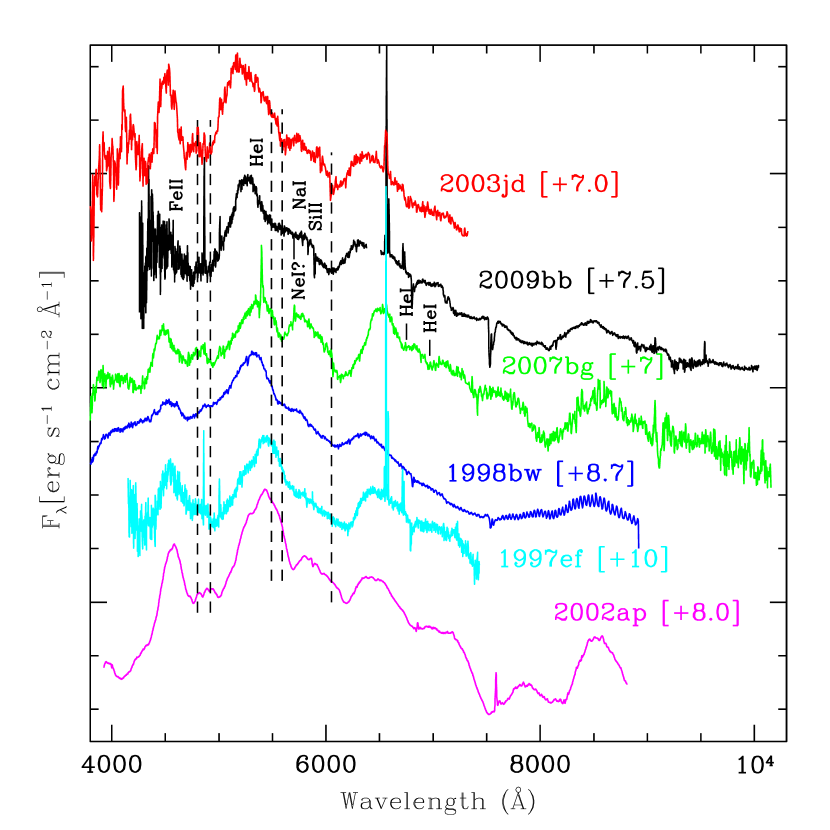
Comparing the de-reddened spectra of SN 2009bb to similar epoch spectra of SN 1998bw, SN 1997ef, SN 2003jd and SN 2002ap, de-reddened using the color excess values mentioned in Section 3, one can note that at early phases SN 2009bb, SN 2003jd and SN 2006aj are characterized by a bluer continuum than SN 1997ef and SN 2002ap (see Figures 11 and 12). Around two week past maximum, the continuum has become similar to that of all the other comparison SNe.
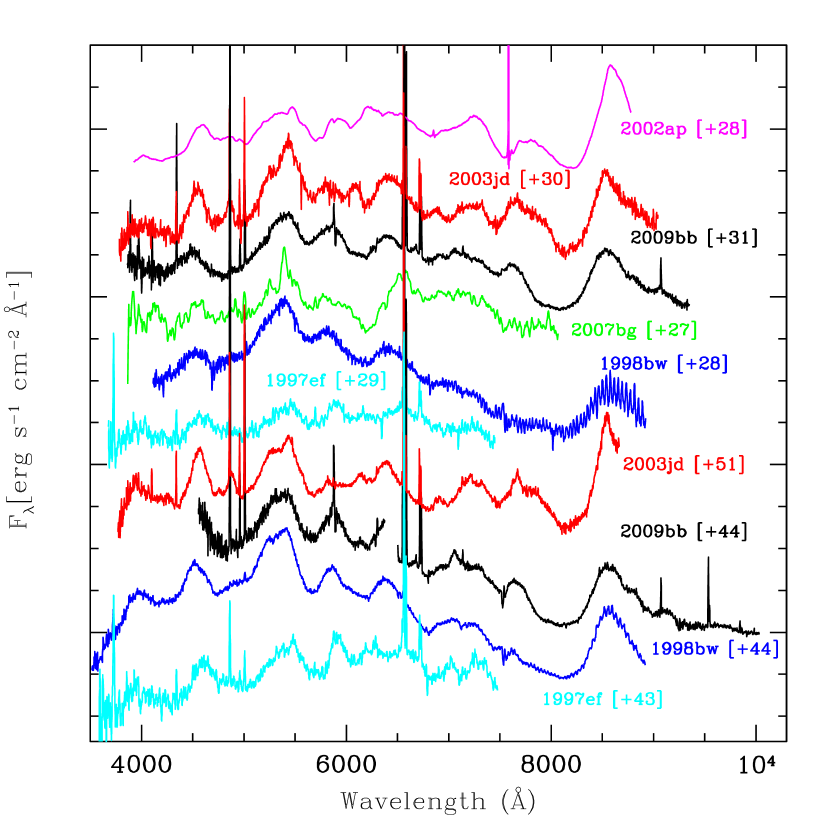
In terms of degree of broadening of the spectral features around maximum, the spectra of SN 2009bb are similar to those of SN 2006aj (see Figure 11 and 12). Looking at the SN 2009bb spectra taken later than a week after maximum (see Figure 13, Figure 14 and 15), the degree of blending is still high in SN 2009bb being intermediate between SN 2003jd and SN 1998bw. This slow spectroscopic evolution in spite of the high expansion velocity is a further indication that SN 2009bb had a massive envelope. The expansion velocity of 2009bb decreases similarly to that of SN 1998bw and slower SN 2002ap (see Figure 16).
5.2 Detailed Comparison: the Helium Detection
In the following, the evolution of some features present in the spectra of SN 2009bb are analyzed in more detail using the supernova spectrum-synthesis code SYNOW (Jeffery & Branch, 1990; Branch, Baron, & Jeffery, 2003). Particular effort is devoted to determining if helium is present in the ejecta of SN 2009bb, as this is very important for constraining the nature of its progenitor and its evolutionary stage at the time of the explosion. We explore qualitatively the presence of helium using SYNOW, but it must be kept in mind that full spectral modeling, including non-thermal effects is necessary to study quantitatively the evolution and strength of the He lines (Lucy, 1991).
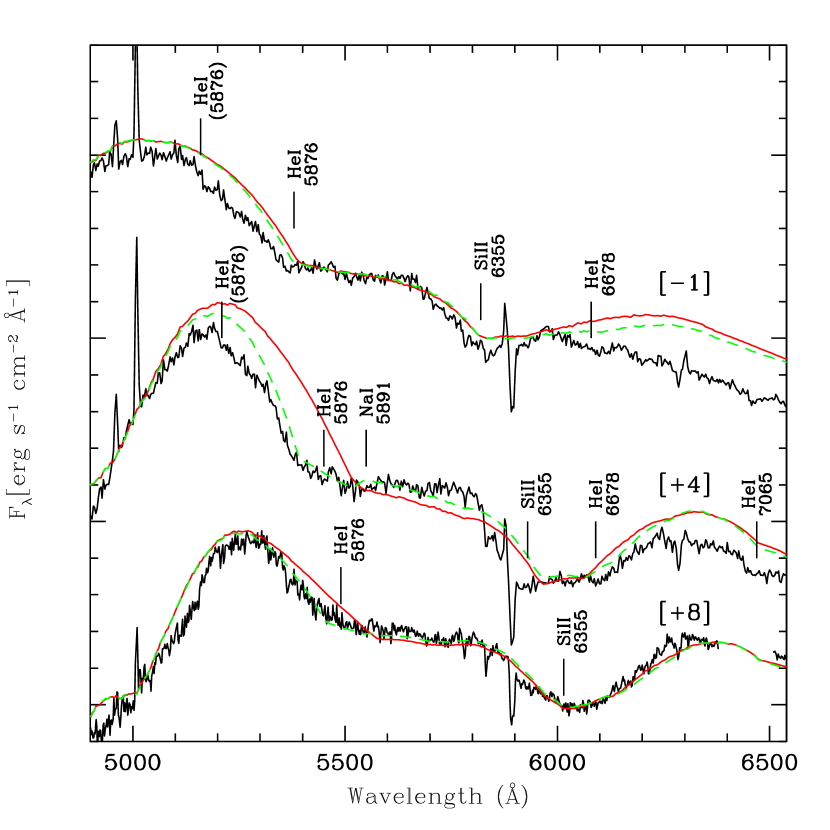
The clearest evidence of the presence of helium in the SN 2009bb ejecta is found in the first two spectra taken at 2 and 1 days (see Figure 11). A striking feature in these two spectra is the absorption around 5400 Å. This line is not visible in the other SNe spectra, and we suggest that it corresponds to He I 5876. Fitting the line profile with SYNOW, we obtain a good match for a velocity in the line forming region of 28000 km s-1 and 27500 km s-1 in the 2 and 1 days spectra, respectively. A similar velocity is also obtained by fitting the absorption around 4800 Å with Fe II 4924, 5018, 5169 and also provides a good match with Si II 6355 for the absorption located at 5800 Å. In Figure 11, the expected positions of the He I 6678 and He I 7065 absorption are also marked. In both the 2 and 1 day spectra, features are present at this wavelength, but due to their weakness and to strong background contamination, should not be over-interpreted.
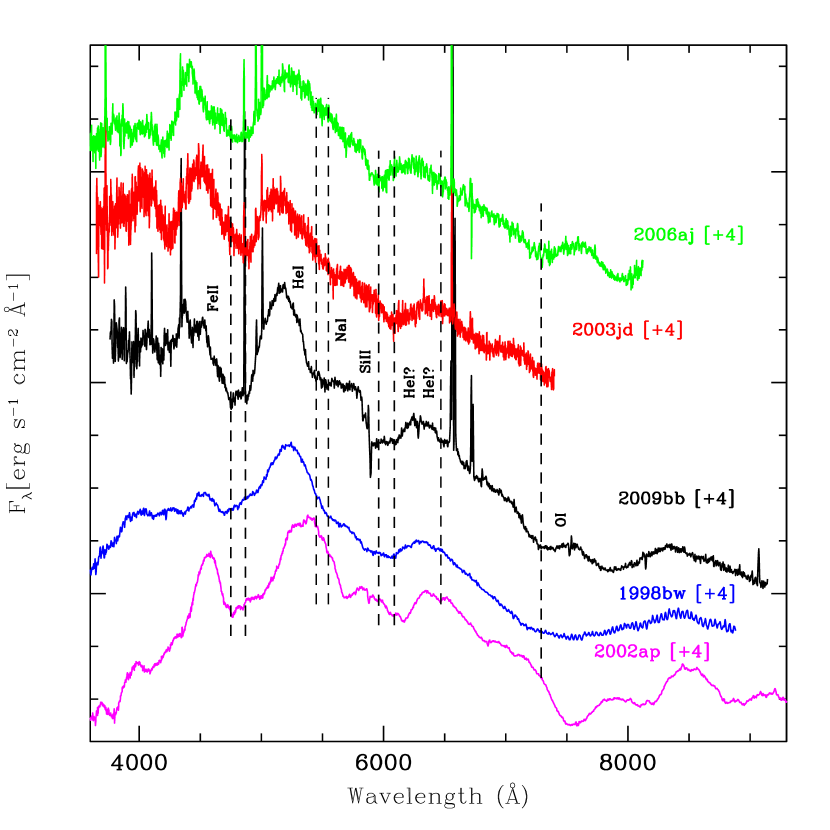
In Figure 12 we show the SN 2009bb spectrum taken at 4 days. The velocity obtained from SYNOW fits to Fe II 4924, 5018, 5169 and Si II 6355 is 18000 km s-1. SN 2009bb shows the closest resemblance to SN 2006aj, but differences are visible particularly around the Si II 6355 absorption and between 5000 and 6000 Å, where SN 2009bb clearly differs compared to the other SNe. Attributing this absorption to detached He I at 25000 km s-1, we obtain a reasonable fit of the observed feature (see short dashed green line in Figure 17).
The expected positions of the other He I features for the assumed detached velocity (25000 km s-1) are indicated in Figure 12. Indeed, an absorption corresponding to He I 6678 appears to be present and helps to fit the boxy profile of the Si II line (see Figure 17). There is also a weak feature corresponding to the expected position of He I 7065, but contamination from Ne I 6929 cannot be excluded.
Figure 13 shows the spectrum of SN 2009bb taken a week after -band maximum. Between 5000 and 5500 Å, SN 2002ap and SN 2003jd show an absorption apparently due to Na I. This feature is absent in the spectra of SN 2009bb, SN 1998bw and SN 1997ef, which is probably due to the broadness of the spectral features in the latter SNe, that tends to wash out weak features. Nonetheless, the absence of a clear feature in the SN 2009bb makes less plausible the possibility that in the earlier SN 2009bb spectra the absorption around 5500 Å is due to Na I. As shown in Figure 17, He I with a detached velocity of 23000 km s-1 gives a good fit to the observed line profile between 5000 and 5500 Å. Figure 13 also shows the spectrum of the broad lined Type Ic SN 2007bg, for which the He I lines (the positions of the He I 7065, 7235 lines are marked in the graph) appear to be even stronger than observed in the spectrum of SN 2009bb. Unfortunately, due to the higher expansion velocity of the absorption features in SN 2009bb, the He I 7065 line falls in the gap between the CCDs, making its presence impossible to confirm.
Figure 14 shows a spectrum of SN 2009bb taken two weeks after -band maximum. The absorption feature around 5500 Å is still deeper in SN 2009bb than in the other two SNe. For SN 2009bb, an equally good fit to this feature is obtained with Na I undetached ( 14000 km s-1), or with He I 5876 detached at 18000 km s-1. Again, the expected positions of the other prominent He I lines are indicated in this Figure, but clear signs of these features cannot be seen in the SN 2009bb spectrum.
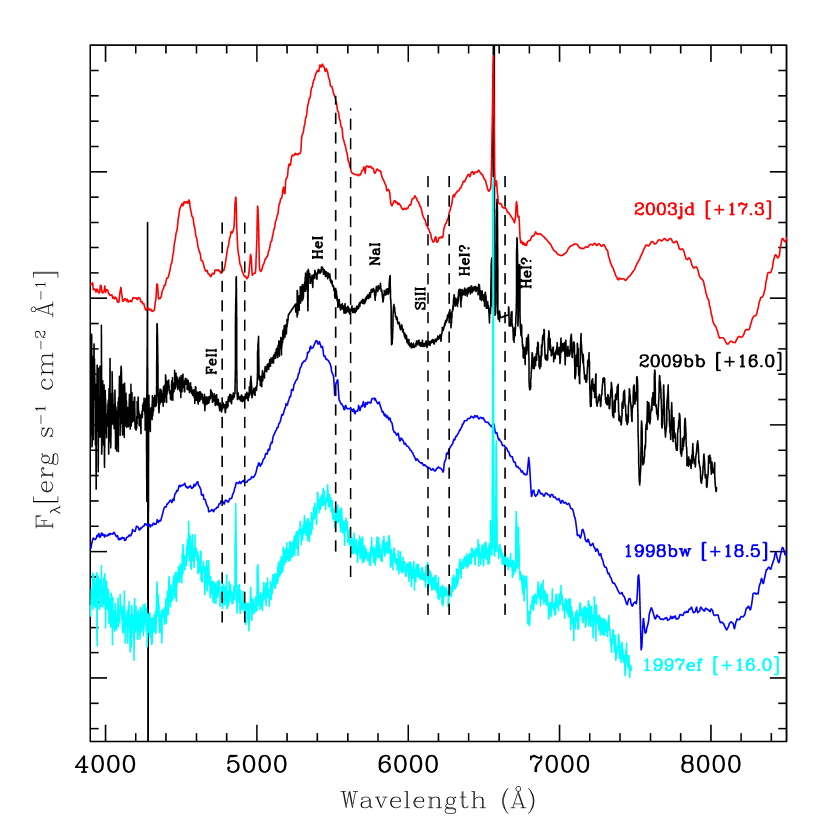
Figure 15 displays the spectra taken on days 30 and 44. The emission redward of the Na I absorption remains stronger in SN 2009bb compared to the the other SNe plotted in this Figure, but the profile around the Na I absorption is now not so different suggesting a reduced strength of the blue wing of the He I 5876 detached component. In both the 33 and 44 spectra of SN 2009bb, there also is no clear signature of the He I 6678 and 7065 features. It should be noted that in the rather noisy spectrum of SN 2007bg, the helium lines, if present, are not as strong as expected. In the case of helium-rich core-collapse SNe (SNe Ib), the He I features are stronger at these later epochs than at maximum (e.g. Matheson et al., 2001). A possible explanation for the lack of strengthening of the He I absorption features in the case of SN 2009bb (and perhaps also for SN 2007bg) is that, due to the higher expansion velocity of broad-lined SNe Ic together with a less massive helium shell, the mass of helium in the line forming region at these later epochs is likely much lower than in normal SNe Ib.
The evolution of the He I 5876 velocity is summarized in the insert of Figure 16. Before maximum He is undetached from the main line forming region, while after maximum is detached. This agrees with the finding of Branch et al. (2002) and Elmhamdi et al. (2006) for Type Ib SNe. The velocity of the detached He decrease with time. The latter also agree with what obtained by Branch et al. (2002).
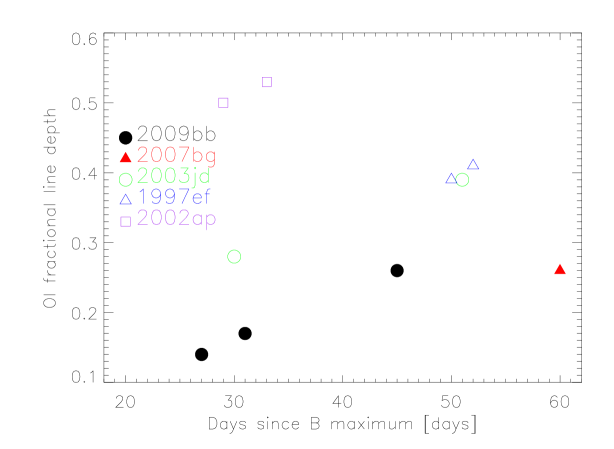
The fractional line depth of the O I 7774 line can, in principle, be used to infer the presence of helium using the formula given by Matheson et al. (2001)
| (6) |
where and represent the values of the continuum and of the line minimum at the wavelength of the minimum, respectively. The latter authors proposed that in SNe Ib, due to the dilution of oxygen by helium, the O I 7774 absorption should be weaker than in SNe Ic. Indeed, they measured an average fractional line depth of 0.27 0.11 and 0.38 0.09 for SNe Ib and SNe Ic, respectively. Matheson et al. (2001) also found that this difference is stronger around maximum than at late time. Unfortunately, in broad-lined SNe Ic, the depth of the O I 7774 Å is difficult to measure at early epochs due to the widths of the other lines in this spectral region. In Figure 18, measurements at phases later than +20 days are plotted. As for normal SN Ibc the fractional line depth for broad-lined SNe Ic increases with time. Interestingly, the two broad-lined SNe Ic which show evidence of helium lines, SN 2009bb and SN 2007bg, have an O I 7774 line depth that is less than those that do not show any sign of helium. Note that Figure 18 does not include SN 1998bw since, even at +50 days, O I 7774 is still strongly blended with the Ca II near-infrared triplet.
5.3 Nebular Spectrum
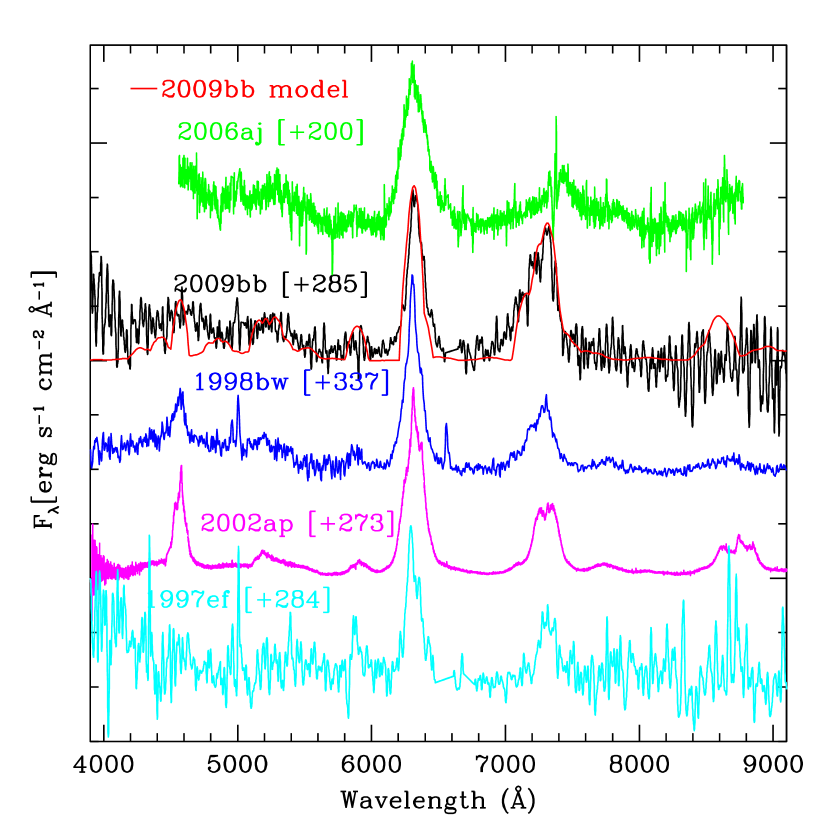
In Figure 19 we show a comparison between the nebular spectra of SN 2009bb, SN 1997ef, SN 1998bw, SN 2002ap and SN 2006aj. To study the line profiles of SN 2009bb, the strong emission lines from the underlying H II region must be removed. This was achieved by subtracting the spectrum of the bright H II region located 0.3 North, 1.4 East of the SN position. The latter spectrum was acquired with the same spectrograph, making more accurate the spectra matching procedure. The spectrum of the bright H II region was rescaled to match the line fluxes of the H II region underlying the SN. Note that the line ratios for the two H II regions are similar to within 10%. This, together with the very similar Balmer decrement measured in the two H II regions (see section 3), gives confidence that the subtraction procedure has not significantly altered the SN spectrum.
The nebular spectrum of SN 2009bb is rather noisy, but several strong emission features can be recognized. The emission in the blue, near 4500Å, should be dominated by [Mg I] 4570. The broad complex near 5200Å is the result of a number of [Fe II] emission lines. Near 5900Å, Na I D emission is possibly detected. The two strongest lines in the spectrum are [O I] 6300, 6363 and Ca II] 7291, 7324.
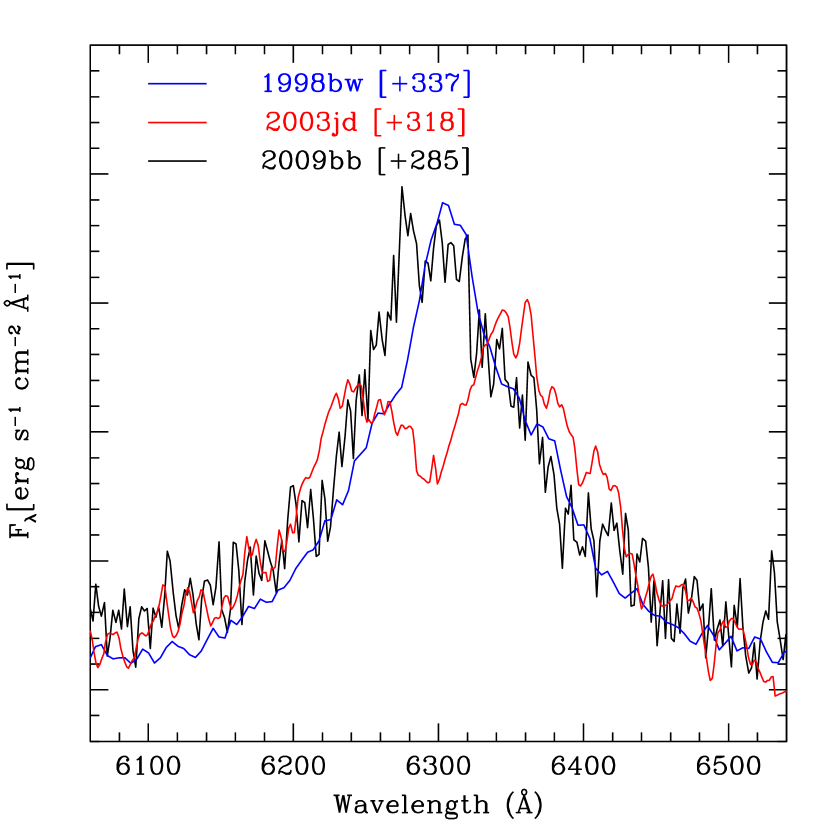
It is immediately clear that the calcium to oxygen ratio is much larger in SN 2009bb than in all the other comparison SNe. It is also evident, when compared to the spectra of SNe 2003jd and 1998bw, that the profile of the [O I] 6300, 6354 emission in SN 2009bb is more similar to that of SN 1998bw than that of SN 2003jd (see Figure 20). Based on spectral modelling, Mazzali et al. (2005) claimed that a double peaked [O I] 6300, 6354 profile as observed in SN 2003jd is produced by an aspherical expansion, but viewed off axis. Assuming that this interpretation is correct [but see also Maeda et al. (2008); Maurer et al. (2010)], in the case of SN 2009bb, the material ejected must have been oriented close to the line of sight as in the case of SN 1998bw.
The nebular spectrum of SN 2009bb can be modelled in order to derive some physical properties of the SN. Nebular spectroscopy reveals the conditions of the innermost part of the SN ejecta, which are not visible when the SN is bright because they lie too deep in regions that are optically thick. At late phases, on the other hand, the inner parts of the SN are transparent, and behave like a nebula.
The code we used computes the energy deposition from the decay of 56Ni to 56Co to 56Fe. These decays emit -rays and high-energy positrons, which can deposit their energy in the SN ejecta and heat the gas by collision excitation. Cooling then takes place via line emission. Our code was described by Mazzali et al. (2001), and is based on the description of Axelrod (1980).
We model the spectrum of SN 2009bb using the simple, one-zone version of the nebular code. This assumes that the SN ejecta are spherical, and bound by an outer velocity, which reflects not so much the extent of the ejecta in radius or velocity (the two are equivalent in the homologously expanding SN ejecta), but rather that of the region which is effectively heated and can therefore emit lines. This may be the result of decreasing density, distribution of 56Ni, or both.
Our model requires an outer velocity of 5500 km s-1. This velocity appears to be adequate to fit all lines. This could be taken as an argument that SN 2009bb was not significantly aspherical. In models where more energy is released in a polar direction, leading to the synthesis of 56Ni and possibly to the production of a GRB, the [Fe II] lines are broader than the [O I] line if the event is viewed close to the polar axis (Maeda et al., 2003). Otherwise, the [Fe II] lines are narrower than the [O I] line, which shows a characteristic double-peaked profile, as in SN 2003jd. Nevertheless, the strongest evidence for asphericity in SN 1998bw was seen in nebular spectra obtained 200 days after maximum (Mazzali et al., 2001), while the difference between the iron and oxygen lines width was smaller at epochs of 340 days, which is closer to the epoch of the only nebular spectrum available for SN 2009bb. Therefore, while from this spectrum only we do not infer major asphericities in SN 2009bb, we cannot rule out that the signature of asphericity might have been seen in earlier nebular data.
The 56Ni mass which is required to reproduce the spectrum, assuming a distance modulus of 33.0 and a reddening , is 0.25 M☉. This is in good agreement with the estimate of 0.220.06 M☉ found from modelling the pseudo-bolometric light curve. The mass of the elements used to generate the synthetic spectra are summarized in Table 6.
6 Discussion and conclusions
We have presented UV, optical and near-infrared photometry, and optical spectroscopy of the broad-lined Type Ic SN 2009bb. Around maximum, the spectra of SN 2009bb were similar to those of SN 2003jd and SN 2006aj. The expansion velocities of SN 2009bb are similar to these of SN 2006aj, but higher than those of SN 2003jd. At phases later than +15 days, the broadness of the spectral features in SN 2009bb was intermediate between SN 1997ef and SN 1998bw. The slow spectroscopic evolution indicates that SN 2009bb had a massive envelope, and this is confirmed by the pseudo-bolometric light curve analysis. With a simple model that includes both the 56Ni and 56Co decay, and making use of analytic equations presented in Arnett (1982), we obtain a 56Ni and ejected mass of 0.220.06 M☉ and 4.1 1.9 M☉, respectively. The resulting kinetic energy is Foe. A similar 56Ni mass is obtained from the nebular spectrum modelling .
An absorption feature is identified in the and day spectra around 5400 Å that we attribute to He I 5876 forming at the photosphere. He I appears to be detached in the later spectra, with the absorption getting weaker with time. The latter evolution is odd compared to what is normally observed in SNe Ib where helium lines become stronger after maximum. The weakening of the helium absorption could be due to a combination of the fast expansion characteristic of broad-lined SNe and a less massive helium shell than in “normal” SN Ib.
The comparison between the kinetic energy carried away by the homologous expanding ejecta at and the energy inferred by the radio observations points to the need for an extra source of energy provided by a central engine.
The modelling of the SN 2009bb nebular spectrum indicates that iron and oxygen lines can be reproduced with a synthetic spectrum where both elements have similar expansion velocities. This suggests that SN 2009bb ejecta structure was not significantly aspherical. Nonetheless, considering the iron and oxygen lines evolution of SN 1998bw, we cannot exclude that the signature of asphericity could have been detected in a SN 2009bb earlier nebular spectrum. The analysis of the [O I] 6300, 6354 reveals that, if the explosion was indeed aspherical, the orientation should have been similar to that of SN 1998bw. Therefore, if a GRB was produced during the SN2009bb explosion, it was below the threshold of the current generation of -ray instruments. Without a detected GRB counterpart, SN 2009bb represents the first engine-driven, relativistic supernova ever discovered by its optical emission alone. The presence of a relatively massive helium layer may have played a role on the failed GRB detection, but a quantitative description of the helium shell is necessary to verify this hypothesis.
Appendix A Observations and data reduction
Imaging of SN 2009bb was acquired with five different instruments in the optical, one in the near-infrared, and one in the ultraviolet. A summary of the characteristics of the facilities used are listed below.
A.1 Photometry
-
•
The SWIFT space telescope is equipped with the UVOT camera that has 256256 physical pixels, but after processing the final combined images has 20482048 pixels with a pixel scale of 05. SN 2009bb was observed with the and filters.
-
•
The PROMPT 3 telescope at CTIO is equipped with a CCD camera Alta U47UV E2V CCD47-10 (10241024, pixel scale = 06 per pixel). SN 2009bb was observed with both a standard Johnson-Kron-Cousins -band and a Sloan filters.
-
•
PROMPT 5 is equipped with a CCD camera Alta U47 E2V CCD47-10 (10241024, pixel scale = 06 per pixel). SN 2009bb was observed with both Johnson-Kron-Cousins and Sloan filters.
-
•
The 1.0 m Henrietta Swope telescope at LCO is equipped with a SITe3 CCD camera (20483150, pixel scale = 0435 per pixel). SN 2009bb was observed with both Johnson-Kron-Cousins and Sloan filters.
-
•
The Swope telescope was also used to obtain near-infrared imaging with the RetroCam camera (HAWAII-1 10241024, pixel scale = 054)
All optical images were reduced following standard procedures including bias, dark (when appropriate), and flat-field corrections. Photometry of the supernova was computed relative to a local photometric sequence in the field of NGC 3278. The photometric sequence itself was calibrated to the standard Johnson Kron-Cousins and Sloan photometric systems using observations of Landolt (1992) and Smith et al. (2006) photometric standard stars obtained over the course of seven photometric nights. Our adopted and photometry of the local sequence is reported in Table 7 and Table 8, respectively. The listed values were computed via a weighted average of the measurements made for each of the seven calibration nights.
Given that the background of SN 2009bb was quite complex due to the presence of a bright H II region, it was necessary to apply template subtractions to all of the optical images. Three template images for each filter were acquired with the PROMPT telescopes between 2010 May 25–30, or 420 days after maximum brightness. To estimate the SN residual flux in these templates, we rescaled the light curves of SN 1998bw in order to obtain the best match with SN 2009bb between +30 and +50 days. The brightness decline of SN 1998bw is slower than that of SN 2009bb (see Figure 2), therefore a rescaling computed around maximum light should grossly overestimate the late-time flux of SN 2009bb. Interpolating the rescaled light curves at the epoch on which the SN 2009bb templates were acquired, we estimate the SN 2009bb brightness to be: 24.6 mag, 24.3 mag, 23.3 mag and 23.1 mag. Assuming zero flux in the templates, these values imply an underestimation of the SN 2009bb real flux in all the bands of less than 0.5% around maximum, and less than 2% on the last measurement published in this paper. These values make us confident that the analysis reported here is not affected by systematic errors related to template subtraction. Using the SN 2009bb spectra acquired on 2010 Jan. 9 UT and the standard bands of the Johnson-Kron-Cousins and Sloan photometric systems, we can estimate the previously mentioned systematic errors also for the PROMPT light curves. As expected, also in this case the flux underestimation turns out to be negligible. Taking into account that the decline rate of SN 1998bw is slower than SN 2009bb the previously reported SN 2009bb late phase magnitudes should be regarded as an upper limit of its real brightness. Nevertheless, possible late time flattening on the light curve cannot be excluded a priori. In order to obtain a direct estimate of the SN 2009bb residual flux in the template images, we examined the IMACS images taken on 28 Dec. 2009 UT. We measured the flux in an aperture centered in the SN position and of a radius equal to 3 times the sigma of the Gaussian profile of the stellar objects present in the image. Through these measurements, we estimate upper limits of 20.9 mag, 20.5 mag and 20.1 mag for the filters respectively. We note that most of the flux measured in the IMACS images is due to the galaxy emission, not from the SN itself. To prove this, we computed synthetic magnitudes on the SN 2009bb nebular spectrum acquired on 9 Jan. 2010 UT once this was cleaned from the H II region and stellar emissions. We obtained: =24.0, =23.9, =23.0, =23.1, =23.84, =23.4, =23.4 and =23.8 mag.
In the case of the Swope telescope, the template images were acquired on 20 Nov 2009 UT. The SN flux in the and bands, was negligible, but this was not the case in the images. In order to reliably calibrate the magnitudes in the light curve tail, we estimated the residual flux in the template images matching the PROMPT and Swope light curves around maximum.
We next proceeded to compute photometry of SN 2009bb in the standard Johnson and Sloan systems using the S-correction technique (Stritzinger et al., 2002), but following the prescription of Pignata et al. (2008). Since the band is not fully covered by any of our SN 2009bb spectra, the SN magnitudes were calibrated in the standard photometric system using the following equation:
| (A1) |
where is the magnitude in the standard photometric system and is the magnitude in the instrumental one, while refers to the photometric zero point.
The near-infrared images were obtained using a standard jitter technique. To reduce the data cubes, we made use of a pipeline developed by the CSP (for details see Contreras et al., 2010). The pipeline applies to each image dark, flat-field, and detector linearity corrections. These altered images are geometrically aligned and then stacked to obtain a master image from which photometry was computed.
Near-infrared photometry of the SN was also obtained relative to a local sequence of stars calibrated against Persson et al. (1998) standard stars obtained during three photometric nights. The photmetry of the local sequence stars are reported in Table 9. Comparing our and magnitudes with these of the 2MASS catalog, we obtain a difference of 0.03 0.03 mag and 0.02 0.05 mag, respectively.
The near-infrared photometry instrumental magnitudes were computed through the template subtraction technique. As the photometry of the SN is computed differentially with respect to the local sequence, we obtained final magnitudes using the following equations:
| (A2) |
| (A3) |
| (A4) |
Here are the magnitudes in the standard photometric system, are the magnitudes in the natural photometric system and , , are the zero points.
The UVOT images were reduced using the customized instrument pipeline that, in addition to preparing the frames for photometry, computes an astrometric solution for them. Aperture photometry was performed on the RA, DEC position of SN 2009bb with the optimum aperture radius of 10” suggested by Poole et al. (2008). To ensure that the aperture includes a constant amount of light, the stability of the PSF size was checked in all the combined images. The of the FWHM variation was 0.2 pixels for both the and UVOT filters.
A.2 Spectroscopy
Optical spectroscopy of SN 2009bb was obtained on thirteen epochs with the du Pont (+ WFCCD & B&C) and Magellan (+IMACS & LDSS3) telescopes at LCO, and the Gemini South (+ GMOS) telescope. Spectra were reduced in a standard manner using IRAF scripts based on tasks contained within the IRAF noao.twodspec and gemini.gmos packages. Optimal extraction was obtained by weighting the signal according to the intensity profile along the slit. Sky subtraction was generally carried out by fitting a low order polynomial to both sides of the extracted SN spectrum, and wavelength solutions were determined from exposures of arc lamps. The wavelength calibration was checked against bright night-sky emission lines. Flux calibration was performed by means of spectrophotometric standard stars (Hamuy et al., 1992, 1994) and checked against the photometry. When discrepancies occurred, the flux of the spectrum was scaled to match the broad-band photometry.
References
- Arnett (1982) Arnett W. D. 1982, ApJ, 253, 785
- Axelrod (1980) Axelrod, T. S. PhD Thesis 1980
- Berger, Kulkarni & Chevalier (2002) Berger E., Kulkarni S. R., Chevalier R. A., 2002, ApJ, 577, L5
- Branch et al. (2002) Branch D., et al. 2002, ApJ, 566, 1005
- Branch, Baron, & Jeffery (2003) Branch D., Baron E. & Jeffery D. J. 2003, in Supernovae and Gamma-Ray Bursters, ed. K. Weiler (Heidelberg: Springer), 47
- Branch et al. (2006) Branch D., Jeffery D. J., Young T. R., Baron E., 2006, PASP, 118, 791
- Campana et al. (2006) Campana S., et al. 2006, Nature, 442, 1008
- Cardelli, Clayton & Mathis (1989) Cardelli J. A., Clayton G. C., Mathis J. S., 1989, ApJ, 345, 245
- Chugai (2000) Chugai N. N., 2000, Astronomy Letters, 26, 797
- Clocchiatti et al. (1996) Clocchiatti A., et al. 1996, ApJ, 462, 462
- Conley et al. (2006) Conley A., et al. 2006, AJ, 132, 1707
- Contreras et al. (2010) Contreras C., et al. 2010, AJ, 139, 519
- Dessart et al. (2008) Dessart L., Burrows A., Livne E., Ott C. D. 2008, ApJ, 673, L43
- Elmhamdi et al. (2006) Elmhamdi A., et al. 2006, A&A, 450, 305
- Ferrero et al. (2006) Ferrero P., et al. 2006, A&A, 457, 857
- Folatelli et al. (2010) Folatelli G., et al. 2010, AJ, 139, 120
- Foley et al. (2003) Foley R. J., et al. 2003, PASP, 115, 1220
- Galama et al. (1998) Galama T. J., et al. 1998, Nature, 395, 670
- Gal-Yam, Ofek & Shemmer (2002) Gal-Yam A., Ofek E. O. & Shemmer O., 2002, MNRAS, 332, L73
- Gal-Yam et al. (2004) Gal-Yam A., et al. 2004, ApJ, 609, L59
- Hamuy et al. (1992) Hamuy M., Walker A. R., Suntzeff N. B., Gigoux P., Heathcote S. R., Phillips M. M., 1992, PASP, 104, 533
- Hamuy et al. (1994) Hamuy M., Suntzeff N. B., Heathcote S. R., Walker A. R., Gigoux P., Phillips M. M., 1994, PASP, 106, 566
- Hamuy et al. (2006) Hamuy M., et al. 2006, PASP, 118, 839
- Hamuy et al. (2009) Hamuy M., et al. 2009, ApJ, 703, 1612
- Hjorth et al. (2003) Hjorth J., et al. 2003, Nature, 423, 847
- Jeffery & Branch (1990) Jeffery D. J. & Branch, D. 1990, in Supernovae, eds. J. C. Wheeler, T. Piran, & S. Weinberg (Singapore: World Scientific). 149
- Kocevski et al. (2007) Kocevski D., et al. 2007, ApJ, 663, 1180
- Kulkarni et al. (1998) Kulkarni S. R., et al. 1998, Nature, 395, 663
- Landolt (1992) Landolt A. U., 1992, AJ, 104, 340
- Levesque et al. (2010a) Levesque E. M., et al. 2010a, ApJ, 709, L26
- Levesque et al. (2010b) Levesque E. M., et al. 2010b, ApJ, 712, L26
- Lucy (1991) Lucy L. B., 1991, ApJ, 383, 308
- MacFadyen, Woosley & Heger (2001) MacFadyen A. I., Woosley S. E., Heger A., 2001, ApJ, 550, 410
- Maeda et al. (2003) Maeda K., et al. 2003, ApJ, 593, 931
- Maeda et al. (2008) Maeda K., et al. 2008, Science, 319, Issue, 1220
- Malesani et al. (2004) Malesani D., et al. 2004, ApJ, 609, L5
- Matheson et al. (2001) Matheson T., et al. 2001, AJ, 121, 1648
- Matheson et al. (2003) Matheson T., et al. 2003, AJ, 599, 394
- Matzner & McKee (1999) Matzner C. D., & McKee C. F. 1999, ApJ, 510, 379
- Maurer et al. (2010) Maurer J. I., et al. 2010, MNRAS, 402, 161
- Mazzali et al. (2000) Mazzali P. A., et al. 2000, ApJ, 545, 407
- Mazzali et al. (2001) Mazzali P. A., et al. 2001, ApJ, 559, 1047
- Mazzali et al. (2002) Mazzali P. A., et al. 2002, ApJ, 572, L61
- Mazzali et al. (2005) Mazzali P. A., et al. 2005, Science 308, 1284
- Mazzali et al. (2007) Mazzali P. A., et al. 2007, ApJ, 670, 592
- Modjaz et al. (2006) Modjaz M., et al. 2006, ApJ, 645, L21
- Modjaz et al. (2008) Modjaz M., et al. 2008, AJ, 135, 1136
- Mould et al. (2000) Mould J. R., et al. 2000, ApJ, 529, 786
- Olivares et al. (2010) Olivares F., et al. 2010, ApJ, 715, 833
- Osterbrock (1989) Osterbrock D. 1989, Astrophysics of gaseous nebulae and active galactic nuclei (University Science Books)
- Patat et al. (2001) Patat F., et al. 2001, ApJ, 555, 900
- Persson et al. (1998) Persson S. E., Murphy D. C., Krzeminski W., Roth M., Rieke M. J., 1998, AJ, 116, 2475
- Pian et al. (2006) Pian E., et al. 2006, Nature, 442, 1011
- Pignata et al. (2008) Pignata G., et al. 2008, MNRAS, 388. 971
- Pignata et al. (2009a) Pignata G., et al. 2009a, in the proceeding of Probing stellar populations out to the distant universe. AIP Conference Proceedings, Volume 1111, pp. 551
- Pignata et al. (2009b) Pignata G., et al. 2009b, CBET 1731
- Poole et al. (2008) Poole T. S., et al. 2008, MNRAS, 383. 627
- Reichart et al. (2005) Reichart D., et al. 2005, Il Nuovo Cimento C, 28, 767
- Sahu et al. (2009) Sahu D. K., et al. 2009, ApJ, 697, 676
- Sauer et al. (2006) Sauer D., et al. 2006, MNRAS, 369, 1939
- Schlegel, Finkbeiner & Davis (1998) Schlegel D. J., Finkbeiner D. P., Davis M., 1998, ApJ, 500, 525
- Smith et al. (2006) Smith J. A., et al. 2006, AJ, 123, 2121
- Soderberg et al. (2010) Soderberg A. M., et al. 2010, Nature, 463, 513
- Sollerman et al. (2006) Sollerman J., et al. 2006, A&A, 454, 503
- Spergel et al. (2007) Spergel D. N., et al. 2007, ApJS, 170, 377
- Stanek et al. (2003) Stanek K. Z., et al. 2003, ApJ, 591, L17
- Strauss et al. (1992) Strauss M. A., et al. 1992, ApJS, 83, 29
- Stritzinger et al. (2002) Stritzinger M., et al. 2002, AJ, 124, 2100
- Stritzinger et al. (2009) Stritzinger M., et al. 2009, CBET 1751
- Stritzinger et al. (2010) Stritzinger M., et al. 2010, AJ, 140, 2036
- Turatto, Benetti & Cappellaro (2003) Turatto M., Benetti S. & Cappellaro E., 2003, in the proceedings to the ESO/MPA/MPE Workshop (an ESO Astrophysics Symposium) From Twilight to Highlight: The Physics of Supernovae, eds. B. Leibundgut and W. Hillebrandt (Springer-Verlag), p. 200
- Valenti et al. (2008) Valenti S., et al. 2008, MNRAS, 383, 1485
- Woosley & Heger (2006) Woosley S. E., Heger, A. 2006 ApJ, 637, 914
- Yoshii et al. (2003) Yoshii Y., et al. 2003, ApJ, 592, 467
- Young et al. (2010) Young D. R., et al. 2010, A&A, 512, A70


| date | J.D. | Telescope | ||||
|---|---|---|---|---|---|---|
| 24/3/2009 | 2454914.5 | 18.10 0.06 | PROMPT3 | |||
| 24/3/2009 | 2454914.5 | 17.21 0.06 | 17.09 0.03 | 16.75 0.08 | PROMPT5 | |
| 24/3/2009 | 2454914.6 | 18.00 0.1 | Swope | |||
| 25/3/2009 | 2454915.6 | 17.49 5.27 | 16.82 0.1 | Swope | ||
| 26/3/2009 | 2454916.5 | 17.33 0.04 | PROMPT3 | |||
| 26/3/2009 | 2454916.5 | 16.65 0.04 | 16.36 0.03 | 15.95 0.05 | PROMPT5 | |
| 27/3/2009 | 2454917.5 | 17.21 0.03 | PROMPT3 | |||
| 27/3/2009 | 2454917.5 | 16.48 0.04 | 16.15 0.03 | 15.80 0.05 | PROMPT5 | |
| 27/3/2009 | 2454917.7 | 17.17 0.04 | 16.40 0.1 | Swope | ||
| 28/3/2009 | 2454918.5 | 17.13 0.04 | PROMPT3 | |||
| 28/3/2009 | 2454918.5 | 16.34 0.03 | 16.05 0.03 | PROMPT5 | ||
| 28/3/2009 | 2454918.6 | 15.71 0.04 | PROMPT5 | |||
| 29/3/2009 | 2454919.7 | 17.08 0.04 | PROMPT3 | |||
| 29/3/2009 | 2454919.7 | 16.21 0.03 | 15.59 0.06 | PROMPT5 | ||
| 30/3/2009 | 2454920.5 | 17.07 0.04 | PROMPT3 | |||
| 30/3/2009 | 2454920.5 | 16.21 0.04 | 15.90 0.03 | 15.50 0.05 | PROMPT5 | |
| 30/3/2009 | 2454920.6 | 17.07 0.03 | 16.16 0.1 | Swope | ||
| 31/3/2009 | 2454921.5 | 16.10 0.03 | 15.85 0.03 | 15.49 0.05 | PROMPT5 | |
| 1/4/2009 | 2454922.5 | 17.07 0.03 | PROMPT3 | |||
| 1/4/2009 | 2454922.5 | 16.08 0.03 | 15.81 0.03 | 15.42 0.06 | PROMPT5 | |
| 2/4/2009 | 2454923.6 | 15.35 0.04 | PROMPT5 | |||
| 2/4/2009 | 2454923.7 | 17.16 0.04 | PROMPT3 | |||
| 2/4/2009 | 2454923.7 | 16.07 0.03 | 15.79 0.03 | PROMPT5 | ||
| 3/4/2009 | 2454924.5 | 17.25 0.04 | PROMPT3 | |||
| 3/4/2009 | 2454924.6 | 16.08 0.03 | 15.78 0.03 | 15.35 0.06 | PROMPT5 | |
| 6/4/2009 | 2454927.6 | 17.57 0.27 | 16.21 0.1 | Swope | ||
| 7/4/2009 | 2454928.5 | 17.78 0.03 | PROMPT3 | |||
| 7/4/2009 | 2454928.5 | 16.31 0.03 | 15.85 0.04 | 15.37 0.04 | PROMPT5 | |
| 7/4/2009 | 2454928.6 | 17.75 0.07 | 16.31 0.1 | Swope | ||
| 8/4/2009 | 2454929.5 | 17.84 0.04 | PROMPT3 | |||
| 8/4/2009 | 2454929.5 | 16.41 0.04 | 15.90 0.03 | 15.37 0.05 | PROMPT5 | |
| 9/4/2009 | 2454930.5 | 18.00 0.07 | 16.50 0.1 | Swope | ||
| 9/4/2009 | 2454930.5 | 18.02 0.05 | PROMPT3 | |||
| 9/4/2009 | 2454930.5 | 16.52 0.04 | 16.00 0.03 | 15.40 0.05 | PROMPT5 | |
| 10/4/2009 | 2454931.5 | 16.59 0.04 | 16.01 0.03 | 15.44 0.04 | PROMPT5 | |
| 10/4/2009 | 2454931.6 | 18.13 0.05 | 16.56 0.1 | Swope | ||
| 11/4/2009 | 2454932.5 | 16.71 0.04 | 16.10 0.03 | 15.48 0.05 | PROMPT5 | |
| 12/4/2009 | 2454933.5 | 16.76 0.05 | 16.14 0.03 | PROMPT5 | ||
| 12/4/2009 | 2454933.6 | 18.40 0.10 | 16.75 0.1 | Swope | ||
| 13/4/2009 | 2454934.5 | 18.48 0.05 | PROMPT3 | |||
| 13/4/2009 | 2454934.5 | 16.90 0.04 | 16.22 0.05 | 15.59 0.04 | PROMPT5 | |
| 14/4/2009 | 2454935.5 | 18.59 0.06 | PROMPT3 | |||
| 14/4/2009 | 2454935.5 | 16.95 0.05 | 16.33 0.03 | 15.67 0.05 | PROMPT5 | |
| 15/4/2009 | 2454936.5 | 18.67 0.05 | PROMPT3 | |||
| 15/4/2009 | 2454936.5 | 17.11 0.05 | 16.43 0.03 | 15.74 0.04 | PROMPT5 | |
| 16/4/2009 | 2454937.6 | 18.81 0.09 | 17.15 0.1 | Swope | ||
| 17/4/2009 | 2454938.5 | 17.25 0.06 | 16.60 0.03 | 15.89 0.05 | PROMPT5 | |
| 17/4/2009 | 2454938.6 | 18.92 0.14 | 17.22 0.1 | Swope | ||
| 18/4/2009 | 2454939.5 | 17.35 0.06 | 16.68 0.03 | 15.96 0.05 | PROMPT5 | |
| 20/4/2009 | 2454941.6 | 17.54 0.06 | 16.82 0.03 | 16.12 0.05 | PROMPT5 | |
| 21/4/2009 | 2454942.5 | 17.54 0.07 | 16.92 0.03 | 16.16 0.05 | PROMPT5 | |
| 21/4/2009 | 2454942.6 | 19.16 0.12 | 17.51 0.1 | Swope | ||
| 22/4/2009 | 2454943.5 | 17.62 0.07 | 16.96 0.04 | 16.23 0.05 | PROMPT5 | |
| 23/4/2009 | 2454944.6 | 17.67 0.06 | 16.38 0.05 | PROMPT5 | ||
| 23/4/2009 | 2454944.7 | 19.38 0.10 | PROMPT3 | |||
| 25/4/2009 | 2454946.5 | 19.38 0.09 | PROMPT3 | |||
| 25/4/2009 | 2454946.5 | 17.74 0.07 | PROMPT5 | |||
| 25/4/2009 | 2454946.6 | 17.18 0.03 | 16.45 0.06 | PROMPT5 | ||
| 26/4/2009 | 2454947.5 | 17.80 0.1 | Swope | |||
| 26/4/2009 | 2454947.5 | 16.47 0.05 | PROMPT5 | |||
| 26/4/2009 | 2454947.6 | 19.43 0.19 | Swope | |||
| 26/4/2009 | 2454947.6 | 17.85 0.08 | 17.20 0.03 | PROMPT5 | ||
| 27/4/2009 | 2454948.6 | 17.88 0.07 | 17.24 0.03 | 16.54 0.06 | PROMPT5 | |
| 29/4/2009 | 2454950.5 | 17.33 0.03 | PROMPT5 | |||
| 29/4/2009 | 2454950.6 | 17.95 0.11 | 16.60 0.07 | PROMPT5 | ||
| 30/4/2009 | 2454951.5 | 17.99 0.10 | 17.35 0.04 | 16.61 0.08 | PROMPT5 | |
| 1/5/2009 | 2454952.5 | 18.07 0.11 | 17.39 0.03 | 16.64 0.07 | PROMPT5 | |
| 2/5/2009 | 2454953.5 | 19.48 0.04 | PROMPT3 | |||
| 3/5/2009 | 2454954.5 | 18.15 0.10 | 17.50 0.04 | 16.73 0.07 | PROMPT5 | |
| 4/5/2009 | 2454955.5 | 18.16 0.11 | 17.50 0.03 | 16.81 0.08 | PROMPT5 | |
| 5/5/2009 | 2454956.5 | 19.93 0.49 | PROMPT3 | |||
| 5/5/2009 | 2454956.5 | 18.30 0.11 | 17.63 0.03 | 16.87 0.06 | PROMPT5 | |
| 8/5/2009 | 2454959.5 | 19.70 0.20 | PROMPT3 | |||
| 8/5/2009 | 2454959.5 | 18.21 0.09 | 17.70 0.03 | 16.95 0.08 | PROMPT5 | |
| 9/5/2009 | 2454960.5 | 19.81 0.13 | 18.23 0.1 | Swope | ||
| 9/5/2009 | 2454960.5 | 19.88 0.14 | PROMPT3 | |||
| 9/5/2009 | 2454960.5 | 18.21 0.11 | 17.72 0.03 | PROMPT5 | ||
| 9/5/2009 | 2454960.6 | 16.86 0.08 | PROMPT5 | |||
| 10/5/2009 | 2454961.6 | 20.08 0.16 | PROMPT3 | |||
| 10/5/2009 | 2454961.6 | 18.36 0.12 | 17.79 0.03 | 17.06 0.10 | PROMPT5 | |
| 11/5/2009 | 2454962.5 | 19.86 0.27 | PROMPT3 | |||
| 11/5/2009 | 2454962.5 | 18.31 0.14 | 17.71 0.04 | 16.94 0.07 | PROMPT5 | |
| 12/5/2009 | 2454963.5 | 19.64 0.27 | PROMPT3 | |||
| 12/5/2009 | 2454963.5 | 18.41 0.14 | 17.95 0.03 | 17.08 0.05 | PROMPT5 | |
| 13/5/2009 | 2454964.5 | 19.91 0.29 | PROMPT3 | |||
| 13/5/2009 | 2454964.5 | 18.75 0.17 | 17.90 0.03 | PROMPT5 | ||
| 13/5/2009 | 2454964.6 | 19.96 0.1 | 18.34 0.1 | Swope | ||
| 15/5/2009 | 2454966.5 | 20.03 0.1 | 18.48 0.1 | Swope | ||
| 16/5/2009 | 2454967.5 | 18.29 0.09 | 17.99 0.03 | 16.93 0.09 | PROMPT5 | |
| 17/5/2009 | 2454968.5 | 18.46 0.13 | 17.98 0.04 | 17.21 0.11 | PROMPT5 | |
| 19/5/2009 | 2454970.5 | 18.49 0.15 | 17.98 0.06 | 17.39 0.12 | PROMPT5 | |
| 21/5/2009 | 2454972.5 | 18.99 0.18 | 18.14 0.03 | 17.33 0.11 | PROMPT5 | |
| 22/5/2009 | 2454973.5 | 18.72 0.18 | 18.11 0.03 | 17.35 0.11 | PROMPT5 | |
| 2/6/2009 | 2454984.5 | 18.95 0.19 | 18.57 0.05 | PROMPT5 | ||
| 2/6/2009 | 2454984.6 | 17.47 0.17 | PROMPT5 | |||
| 11/6/2009 | 2454993.5 | 19.14 0.17 | 18.58 0.03 | 18.11 0.20 | PROMPT5 | |
| 12/6/2009 | 2454994.5 | 18.90 0.03 | PROMPT5 | |||
| 12/6/2009 | 2454994.6 | 18.00 0.23 | PROMPT5 | |||
| 13/6/2009 | 2454995.5 | 19.59 0.29 | 18.84 0.04 | 18.00 0.17 | PROMPT5 | |
| 25/7/2009 | 2455037.5 | 19.78 0.78 | PROMPT5 |
| date | J.D. | Telescope | |||||
|---|---|---|---|---|---|---|---|
| 24/3/2009 | 2454914.5 | 17.33 0.03 | 17.24 0.05 | 17.12 0.08 | PROMPT5 | ||
| 24/3/2009 | 2454914.5 | 17.58 0.06 | PROMPT3 | ||||
| 24/3/2009 | 2454914.6 | 18.84 0.1 | 17.59 0.1 | 17.23 0.1 | 17.10 0.1 | Swope | |
| 25/3/2009 | 2454915.6 | 18.43 0.1 | 17.21 0.03 | 16.82 0.03 | 16.71 0.05 | Swope | |
| 26/3/2009 | 2454916.5 | 16.55 0.03 | 16.44 0.03 | 16.38 0.07 | PROMPT5 | ||
| 26/3/2009 | 2454916.5 | 16.99 0.05 | PROMPT3 | ||||
| 27/3/2009 | 2454917.5 | 16.35 0.03 | 16.25 0.03 | 16.07 0.06 | PROMPT5 | ||
| 27/3/2009 | 2454917.5 | 16.84 0.04 | PROMPT3 | ||||
| 27/3/2009 | 2454917.7 | 18.13 0.1 | 16.82 0.03 | 16.32 0.03 | 16.27 0.04 | Swope | |
| 28/3/2009 | 2454918.5 | 16.20 0.03 | 16.18 0.03 | 15.95 0.07 | PROMPT5 | ||
| 28/3/2009 | 2454918.5 | 16.72 0.04 | PROMPT3 | ||||
| 29/3/2009 | 2454919.7 | 16.66 0.04 | PROMPT3 | ||||
| 30/3/2009 | 2454920.5 | 16.06 0.03 | 16.03 0.03 | 15.80 0.06 | PROMPT5 | ||
| 30/3/2009 | 2454920.5 | 16.62 0.04 | PROMPT3 | ||||
| 30/3/2009 | 2454920.6 | 18.11 0.1 | 16.63 0.03 | 16.07 0.03 | 16.00 0.04 | Swope | |
| 31/3/2009 | 2454921.5 | 16.03 0.03 | 16.00 0.03 | 15.78 0.06 | PROMPT5 | ||
| 1/4/2009 | 2454922.5 | 16.02 0.03 | 15.95 0.03 | 15.69 0.06 | PROMPT5 | ||
| 1/4/2009 | 2454922.5 | 16.65 0.04 | PROMPT3 | ||||
| 2/4/2009 | 2454923.6 | 15.96 0.03 | 15.91 0.03 | 15.63 0.07 | PROMPT5 | ||
| 2/4/2009 | 2454923.7 | 16.69 0.04 | PROMPT3 | ||||
| 3/4/2009 | 2454924.5 | 15.98 0.03 | 15.91 0.03 | 15.60 0.06 | PROMPT5 | ||
| 3/4/2009 | 2454924.5 | 16.70 0.04 | PROMPT3 | ||||
| 6/4/2009 | 2454927.6 | 18.98 0.1 | 16.97 0.03 | 16.02 0.04 | 15.90 0.03 | Swope | |
| 7/4/2009 | 2454928.5 | 19.27 0.1 | 17.09 0.03 | 16.05 0.03 | 15.93 0.03 | Swope | |
| 7/4/2009 | 2454928.5 | 16.07 0.03 | 15.93 0.03 | 15.60 0.06 | PROMPT5 | ||
| 7/4/2009 | 2454928.5 | 17.05 0.04 | PROMPT3 | ||||
| 8/4/2009 | 2454929.5 | 16.14 0.03 | 15.96 0.03 | 15.70 0.06 | PROMPT5 | ||
| 8/4/2009 | 2454929.5 | 17.14 0.05 | PROMPT3 | ||||
| 9/4/2009 | 2454930.5 | 19.62 0.1 | 17.30 0.03 | 16.16 0.04 | 16.00 0.04 | Swope | |
| 9/4/2009 | 2454930.5 | 16.15 0.03 | 16.00 0.04 | 15.64 0.07 | PROMPT5 | ||
| 9/4/2009 | 2454930.5 | 17.30 0.05 | PROMPT3 | ||||
| 10/4/2009 | 2454931.5 | 19.71 0.1 | 17.42 0.03 | 16.22 0.03 | 16.05 0.03 | Swope | |
| 10/4/2009 | 2454931.5 | 16.22 0.03 | 16.05 0.03 | 15.69 0.06 | PROMPT5 | ||
| 10/4/2009 | 2454931.5 | 17.38 0.05 | PROMPT3 | ||||
| 11/4/2009 | 2454932.5 | 16.34 0.03 | 16.09 0.03 | 15.73 0.06 | PROMPT5 | ||
| 11/4/2009 | 2454932.5 | 17.52 0.05 | PROMPT3 | ||||
| 12/4/2009 | 2454933.5 | 20.03 0.1 | 17.67 0.03 | 16.37 0.03 | 16.15 0.04 | Swope | |
| 12/4/2009 | 2454933.5 | 16.40 0.03 | 15.77 0.06 | PROMPT5 | |||
| 12/4/2009 | 2454933.5 | 17.62 0.05 | PROMPT3 | ||||
| 13/4/2009 | 2454934.5 | 16.48 0.03 | 16.25 0.03 | 15.85 0.06 | PROMPT5 | ||
| 13/4/2009 | 2454934.5 | 17.72 0.07 | PROMPT3 | ||||
| 14/4/2009 | 2454935.5 | 16.55 0.03 | 16.30 0.04 | 15.90 0.06 | PROMPT5 | ||
| 14/4/2009 | 2454935.5 | 17.92 0.07 | PROMPT3 | ||||
| 15/4/2009 | 2454936.5 | 16.69 0.03 | 16.41 0.04 | 15.96 0.06 | PROMPT5 | ||
| 15/4/2009 | 2454936.5 | 18.07 0.08 | PROMPT3 | ||||
| 16/4/2009 | 2454937.6 | 20.51 0.1 | 18.15 0.03 | 16.75 0.03 | 16.49 0.04 | Swope | |
| 17/4/2009 | 2454938.5 | 16.84 0.03 | 16.61 0.04 | 16.10 0.06 | PROMPT5 | ||
| 17/4/2009 | 2454938.6 | 20.48 0.1 | 18.25 0.03 | 16.86 0.03 | 16.58 0.03 | Swope | |
| 18/4/2009 | 2454939.5 | 16.96 0.03 | 16.63 0.04 | 16.16 0.06 | PROMPT5 | ||
| 18/4/2009 | 2454939.5 | 18.30 0.10 | PROMPT3 | ||||
| 20/4/2009 | 2454941.6 | 17.10 0.03 | 16.81 0.04 | 16.31 0.07 | PROMPT5 | ||
| 20/4/2009 | 2454941.6 | 18.55 0.13 | PROMPT3 | ||||
| 21/4/2009 | 2454942.5 | 17.23 0.03 | 16.83 0.04 | 16.36 0.07 | PROMPT5 | ||
| 21/4/2009 | 2454942.5 | 18.62 0.13 | PROMPT3 | ||||
| 21/4/2009 | 2454942.6 | 20.65 0.1 | 18.55 0.03 | 17.16 0.03 | 16.89 0.06 | Swope | |
| 22/4/2009 | 2454943.5 | 17.27 0.03 | 16.94 0.04 | 16.41 0.07 | PROMPT5 | ||
| 22/4/2009 | 2454943.5 | 18.67 0.13 | PROMPT3 | ||||
| 23/4/2009 | 2454944.6 | 17.38 0.04 | 16.52 0.07 | PROMPT5 | |||
| 23/4/2009 | 2454944.6 | 18.80 0.15 | PROMPT3 | ||||
| 25/4/2009 | 2454946.5 | 18.83 0.16 | PROMPT3 | ||||
| 25/4/2009 | 2454946.6 | 17.47 0.03 | 17.08 0.04 | 16.53 0.07 | PROMPT5 | ||
| 26/4/2009 | 2454947.5 | 21.05 0.1 | 18.98 0.06 | 17.54 0.03 | 17.24 0.05 | Swope | |
| 26/4/2009 | 2454947.5 | 17.48 0.03 | 17.21 0.05 | 16.58 0.07 | PROMPT5 | ||
| 26/4/2009 | 2454947.5 | 18.98 0.14 | PROMPT3 | ||||
| 27/4/2009 | 2454948.5 | 18.98 0.18 | PROMPT3 | ||||
| 27/4/2009 | 2454948.6 | 17.56 0.04 | 17.24 0.05 | 16.68 0.07 | PROMPT5 | ||
| 28/4/2009 | 2454949.5 | 19.06 0.19 | PROMPT3 | ||||
| 29/4/2009 | 2454950.5 | 16.71 0.08 | PROMPT5 | ||||
| 29/4/2009 | 2454950.6 | 17.69 0.04 | 17.38 0.05 | PROMPT5 | |||
| 29/4/2009 | 2454950.6 | 19.12 0.20 | PROMPT3 | ||||
| 30/4/2009 | 2454951.5 | 17.75 0.04 | 17.43 0.05 | 16.79 0.08 | PROMPT5 | ||
| 30/4/2009 | 2454951.5 | 19.29 0.20 | PROMPT3 | ||||
| 1/5/2009 | 2454952.5 | 17.83 0.04 | 17.50 0.05 | 16.79 0.08 | PROMPT5 | ||
| 1/5/2009 | 2454952.5 | 19.32 0.23 | PROMPT3 | ||||
| 2/5/2009 | 2454953.5 | 19.26 0.18 | PROMPT3 | ||||
| 3/5/2009 | 2454954.5 | 17.88 0.03 | 17.61 0.06 | 16.90 0.08 | PROMPT5 | ||
| 3/5/2009 | 2454954.5 | 19.37 0.17 | PROMPT3 | ||||
| 4/5/2009 | 2454955.5 | 17.93 0.04 | 17.57 0.05 | 16.85 0.09 | PROMPT5 | ||
| 5/5/2009 | 2454956.5 | 17.97 0.06 | 16.96 1.84 | PROMPT5 | |||
| 8/5/2009 | 2454959.5 | 18.17 0.05 | 17.70 0.06 | 17.08 0.10 | PROMPT5 | ||
| 8/5/2009 | 2454959.5 | 19.46 0.20 | PROMPT3 | ||||
| 9/5/2009 | 2454960.5 | 21.62 0.1 | 19.49 0.03 | 18.20 0.07 | 17.80 0.07 | Swope | |
| 9/5/2009 | 2454960.5 | 18.18 0.06 | 17.69 0.05 | PROMPT5 | |||
| 9/5/2009 | 2454960.5 | 19.43 0.46 | PROMPT3 | ||||
| 9/5/2009 | 2454960.6 | 17.04 0.08 | PROMPT5 | ||||
| 10/5/2009 | 2454961.5 | 18.12 0.04 | PROMPT5 | ||||
| 10/5/2009 | 2454961.6 | 17.84 0.07 | 17.11 0.07 | PROMPT5 | |||
| 10/5/2009 | 2454961.6 | 19.53 0.28 | PROMPT3 | ||||
| 11/5/2009 | 2454962.5 | 17.86 0.06 | 17.07 0.09 | PROMPT5 | |||
| 12/5/2009 | 2454963.5 | 18.19 0.04 | 17.89 0.05 | 17.17 0.11 | PROMPT5 | ||
| 13/5/2009 | 2454964.5 | 19.51 0.33 | PROMPT3 | ||||
| 13/5/2009 | 2454964.6 | 21.61 0.1 | 19.59 0.04 | 18.30 0.05 | 17.96 0.10 | Swope | |
| 15/5/2009 | 2454966.5 | 19.65 0.15 | 18.43 0.19 | 18.00 0.07 | Swope | ||
| 17/5/2009 | 2454968.5 | 19.88 0.70 | PROMPT3 | ||||
| 21/5/2009 | 2454972.5 | 18.60 0.06 | 18.22 0.08 | 17.48 0.10 | PROMPT5 | ||
| 22/5/2009 | 2454973.6 | 18.51 0.05 | 18.29 0.09 | 17.53 0.10 | PROMPT5 | ||
| 22/5/2009 | 2454973.6 | 19.95 0.48 | PROMPT3 | ||||
| 23/5/2009 | 2454974.5 | 18.69 0.07 | 18.25 0.07 | 17.63 0.13 | PROMPT5 |
| date | J.D. | Instr. | |||
|---|---|---|---|---|---|
| 31/3/2009 | 2454921.7 | 15.21 0.04 | 15.08 0.04 | 14.89 0.04 | RetroCam |
| 8/4/2009 | 2454929.7 | 15.02 0.04 | 14.85 0.04 | 14.70 0.04 | RetroCam |
| 11/4/2009 | 2454932.7 | 15.06 0.04 | 14.92 0.04 | 14.80 0.04 | RetroCam |
| 14/4/2009 | 2454935.7 | 15.10 0.04 | 15.11 0.04 | 14.80 0.04 | RetroCam |
| 16/4/2009 | 2454937.7 | 14.94 0.04 | RetroCam | ||
| 18/4/2009 | 2454939.7 | 15.38 0.04 | 15.23 0.04 | 15.11 0.04 | RetroCam |
| 24/4/2009 | 2454945.7 | 15.81 0.04 | 15.65 0.04 | 15.47 0.04 | RetroCam |
| 27/4/2009 | 2454948.7 | 15.96 0.04 | 15.84 0.04 | 15.68 0.05 | RetroCam |
| 28/4/2009 | 2454949.7 | 16.01 0.04 | 15.95 0.04 | 15.66 0.05 | RetroCam |
| 24/5/2009 | 2454975.7 | 17.05 0.04 | 17.23 0.05 | 16.68 0.08 | RetroCam |
| Filter | JD maxa | m(obs)b | M(abs)c |
|---|---|---|---|
| 2454921.0 0.5 | 17.05 0.02 | 18.36 0.44 | |
| 2454923.5 0.5 | 16.16 0.02 | 18.65 0.34 | |
| 2454924.1 0.5 | 15.80 0.01 | 18.56 0.28 | |
| 2454926.5 0.5 | 15.36 0.03 | 18.51 0.21 | |
| 2454919.6 0.5 | 18.04 0.08 | 17.68 0.50 | |
| 2454921.9 0.5 | 16.62 0.02 | 18.53 0.40 | |
| 2454924.4 0.5 | 15.96 0.02 | 18.60 0.31 | |
| 2454925.5 0.5 | 15.89 0.02 | 18.28 0.25 | |
| 2454926.7 0.5 | 15.60 0.02 | 18.27 0.21 | |
| 2454929.8 1.0 | 15.01 0.05 | 18.58 0.19 | |
| 2454928.4 1.0 | 14.85 0.05 | 18.67 0.18 | |
| 2454929.2 2.0 | 14.71 0.06 | 18.64 0.17 |
a JD time of peak brightness.
b Apparent magnitude.
c Absolute magnitude.
| UT date | J.D. | epocha | range | res. | exptime | Instrument |
|---|---|---|---|---|---|---|
| (days) | (Å) | (Å) | (sec) | |||
| 28/03/09 | 2454918.7 | 2.3 | 38009200 | 3.0 | 700 | WFCCD |
| 29/03/09 | 2454919.6 | 1.4 | 38009200 | 3.0 | 900 | WFCCD |
| 03/04/09 | 2454924.6 | 3.6 | 38009200 | 3.0 | 700 | WFCCD |
| 07/04/09 | 2454928.5 | 7.5 | 420010000 | 1.9 | 400 | IMACS |
| 15/04/09 | 2454936.6 | 15.6 | 42008100 | 1.35 | 900 | GMOS |
| 17/04/09 | 2454938.6 | 17.6 | 37009300 | 2.0 | 600 | LDSS3 |
| 18/04/09 | 2454939.6 | 18.6 | 34009500 | 3.0 | 700 | B&C |
| 22/04/09 | 2454943.6 | 22.6 | 34009500 | 3.0 | 900 | B&C |
| 23/04/09 | 2454944.6 | 23.6 | 34009500 | 3.0 | 1000 | B&C |
| 26/04/09 | 2454947.6 | 26.6 | 39008100 | 1.35 | 900 | GMOS |
| 30/04/09 | 2454938.6 | 30.6 | 37009300 | 2.0 | 600 | LDSS3 |
| 14/05/09 | 2454965.5 | 44.5 | 440010000 | 1.9 | 600 | IMACS |
| 09/01/10 | 2455205.7 | 285.0 | 37009300 | 2.0 | 3x1800 | LDSS3 |
aRelative to -band maximum.
| Element | mass (M☉) |
|---|---|
| O | 1.06 |
| Mg | 0.012 |
| Si | 0.07 |
| S | 0.23 |
| Ca | 0.05 |
| Ni | 0.25 |
| id | R.A. | Dec. | ||||
|---|---|---|---|---|---|---|
| 1 | 10:31:45.355 | -40:00:42.73 | 15.26 0.01 | 14.54 0.04 | 14.13 0.02 | 13.76 0.01 |
| 2 | 10:31:44.107 | -39:55:25.68 | 15.44 0.02 | 14.47 0.04 | 13.93 0.03 | 13.41 0.02 |
| 3 | 10:31:42.905 | -39:57:51.19 | 13.83 0.03 | 13.18 0.03 | 12.80 0.02 | 12.45 0.01 |
| 4 | 10:31:41.494 | -39:57:10.26 | 15.50 0.02 | 14.53 0.04 | 13.99 0.02 | 13.49 0.02 |
| 5 | 10:31:36.185 | -39:54:45.04 | 14.98 0.01 | 14.36 0.03 | 13.99 0.02 | 13.63 0.02 |
| 6 | 10:31:24.828 | -39:58:30.29 | 14.63 0.01 | 14.12 0.03 | 13.77 0.01 | 13.42 0.01 |
| 7 | 10:31:24.547 | -40:01:44.72 | 15.00 0.01 | 14.48 0.04 | 14.14 0.02 | 13.79 0.01 |
| 8 | 10:31:50.942 | -39:57:50.11 | 15.90 0.01 | 15.04 0.01 | 14.51 0.03 | 14.02 0.01 |
| 9 | 10:31:20.933 | -39:59:52.55 | 15.83 0.02 | 15.02 0.01 | 14.57 0.03 | 14.15 0.01 |
| 10 | 10:31:48.010 | -39:54:23.65 | 15.52 0.01 | 14.96 0.01 | 14.64 0.02 | 14.29 0.02 |
| 11 | 10:31:33.866 | -40:00:09.68 | 15.86 0.02 | 15.09 0.01 | 14.69 0.02 | 14.29 0.01 |
| 12 | 10:31:26.273 | -39:56:48.23 | 15.75 0.01 | 15.10 0.01 | 14.75 0.01 | 14.38 0.02 |
| 13 | 10:31:45.754 | -39:56:32.17 | 15.84 0.01 | 15.21 0.01 | 14.86 0.02 | 14.51 0.03 |
| 14 | 10:31:51.468 | -39:54:42.59 | 16.25 0.01 | 15.52 0.01 | 15.10 0.03 | 14.68 0.03 |
| 15 | 10:31:51.929 | -39:54:27.94 | 16.36 0.01 | 15.56 0.01 | 15.11 0.02 | 14.63 0.04 |
| 16 | 10:31:24.012 | -39:59:29.94 | 16.41 0.02 | 15.62 0.01 | 15.20 0.03 | 14.78 0.02 |
| 17 | 10:31:14.064 | -39:58:45.55 | 16.45 0.03 | 15.64 0.01 | 15.19 0.03 | 14.77 0.01 |
| 18 | 10:31:16.582 | -39:56:39.70 | 16.13 0.04 | 15.62 0.04 | 15.37 0.05 | 15.06 0.06 |
| 19 | 10:31:18.864 | -39:57:51.30 | 16.55 0.01 | 15.76 0.01 | 15.33 0.02 | 14.91 0.01 |
| 20 | 10:31:23.846 | -39:54:50.40 | 16.49 0.02 | 15.80 0.01 | 15.40 0.02 | 15.01 0.04 |
| 21 | 10:31:24.442 | -39:55:08.33 | 16.79 0.03 | 15.96 0.01 | 15.49 0.01 | 15.07 0.03 |
| 22 | 10:31:46.673 | -39:58:40.19 | 16.98 0.01 | 16.28 0.01 | 15.89 0.02 | 15.50 0.02 |
| 23 | 10:31:31.198 | -39:53:32.46 | 17.52 0.02 | 16.62 0.01 | 16.06 0.05 | 15.56 0.02 |
| 24 | 10:31:49.822 | -40:00:16.78 | 18.60 0.01 | 17.08 0.03 | 16.12 0.06 | 15.04 0.02 |
| 25 | 10:31:42.703 | -39:58:20.78 | 17.56 0.01 | 16.90 0.01 | 16.50 0.03 | 16.06 0.03 |
| 26 | 10:31:48.434 | -40:01:29.93 | 17.84 0.02 | 17.14 0.01 | 16.72 0.05 | 16.32 0.05 |
| 27 | 10:31:54.881 | -39:56:16.58 | 19.25 0.02 | 17.78 0.01 | 16.77 0.14 | 15.98 0.10 |
| 28 | 10:31:33.463 | -39:58:54.05 | 18.11 0.02 | 17.45 0.01 | 17.10 0.04 | 16.71 0.02 |
| 29 | 10:31:37.385 | -39:57:52.78 | 18.83 0.02 | 17.86 0.01 | 17.35 0.09 | 16.82 0.04 |
| 30 | 10:31:32.995 | -39:58:26.69 | 19.39 0.02 | 18.22 0.01 | 17.52 0.04 | 16.76 0.21 |
| 31 | 10:31:31.990 | -39:58:28.85 | 18.86 0.01 | 18.11 0.01 | 17.64 0.06 | 17.21 0.06 |
| id | R.A. | Dec. | |||||
|---|---|---|---|---|---|---|---|
| 1 | 10:31:45.355 | -40:00:42.73 | 16.37 0.06 | 14.83 0.01 | 14.31 0.02 | 14.14 0.03 | 14.09 0.02 |
| 2 | 10:31:44.107 | -39:55:25.68 | 17.04 0.07 | 14.13 0.02 | 13.82 0.03 | 13.71 0.01 | |
| 3 | 10:31:42.905 | -39:57:51.19 | 12.96 0.02 | 12.81 0.03 | 12.81 0.02 | ||
| 4 | 10:31:41.494 | -39:57:10.26 | 17.20 0.06 | 14.19 0.02 | 13.91 0.03 | 13.80 0.04 | |
| 5 | 10:31:36.185 | -39:54:45.04 | 14.06 0.02 | 13.91 0.03 | 13.89 0.04 | ||
| 6 | 10:31:24.828 | -39:58:30.29 | 13.91 0.02 | 13.76 0.03 | 13.75 0.01 | ||
| 7 | 10:31:24.547 | -40:01:44.72 | 15.82 0.02 | 14.68 0.01 | 14.31 0.02 | 14.16 0.03 | 14.14 0.03 |
| 8 | 10:31:50.942 | -39:57:50.11 | 17.25 0.05 | 15.41 0.01 | 14.71 0.01 | 14.43 0.01 | 14.32 0.05 |
| 9 | 10:31:20.933 | -39:59:52.55 | 17.15 0.07 | 15.37 0.01 | 14.76 0.01 | 14.56 0.01 | 14.52 0.02 |
| 10 | 10:31:48.010 | -39:54:23.65 | 16.38 0.04 | 15.19 0.01 | 14.79 0.01 | 14.65 0.01 | 14.66 0.06 |
| 11 | 10:31:33.866 | -40:00:09.68 | 17.09 0.06 | 15.41 0.01 | 14.86 0.01 | 14.67 0.01 | 14.67 0.06 |
| 12 | 10:31:26.273 | -39:56:48.23 | 16.69 0.04 | 15.37 0.01 | 14.91 0.01 | 14.76 0.01 | 14.73 0.04 |
| 13 | 10:31:45.754 | -39:56:32.17 | 16.83 0.05 | 15.47 0.01 | 15.03 0.01 | 14.88 0.01 | 14.96 0.07 |
| 14 | 10:31:51.468 | -39:54:42.59 | 17.24 0.04 | 15.83 0.01 | 15.28 0.01 | 15.06 0.01 | 15.03 0.04 |
| 15 | 10:31:51.929 | -39:54:27.94 | 17.55 0.05 | 15.90 0.01 | 15.29 0.01 | 15.03 0.01 | 14.95 0.02 |
| 16 | 10:31:24.012 | -39:59:29.94 | 17.70 0.06 | 15.96 0.01 | 15.34 0.01 | 15.14 0.01 | 14.88 0.04 |
| 17 | 10:31:14.064 | -39:58:45.55 | 17.76 0.05 | 15.99 0.01 | 15.39 0.01 | 15.18 0.01 | 15.11 0.03 |
| 18 | 10:31:16.582 | -39:56:39.70 | 16.94 0.11 | 15.86 0.11 | 15.45 0.05 | 15.32 0.06 | 15.37 0.04 |
| 19 | 10:31:18.864 | -39:57:51.30 | 17.60 0.03 | 16.08 0.01 | 15.51 0.01 | 15.31 0.01 | 15.24 0.04 |
| 20 | 10:31:23.846 | -39:54:50.40 | 17.52 0.04 | 16.09 0.01 | 15.60 0.01 | 15.42 0.01 | 15.43 0.08 |
| 21 | 10:31:24.442 | -39:55:08.33 | 18.08 0.06 | 16.32 0.01 | 15.70 0.01 | 15.49 0.01 | 15.52 0.06 |
| 22 | 10:31:46.673 | -39:58:40.19 | 18.06 0.05 | 16.57 0.01 | 16.07 0.01 | 15.90 0.01 | 15.89 0.08 |
| 23 | 10:31:31.198 | -39:53:32.46 | 18.99 0.13 | 17.02 0.01 | 16.29 0.01 | 16.00 0.01 | 15.96 0.08 |
| 24 | 10:31:49.822 | -40:00:16.78 | 20.87 0.17 | 17.81 0.01 | 16.44 0.01 | 15.61 0.01 | 15.29 0.06 |
| 25 | 10:31:42.703 | -39:58:20.78 | 18.47 0.06 | 17.18 0.01 | 16.70 0.01 | 16.50 0.01 | 16.75 0.45 |
| 26 | 10:31:48.434 | -40:01:29.93 | 18.87 0.03 | 17.42 0.01 | 16.90 0.01 | 16.72 0.01 | 16.73 0.22 |
| 27 | 10:31:54.881 | -39:56:16.58 | 18.50 0.01 | 17.14 0.01 | 16.42 0.01 | 16.04 0.08 | |
| 28 | 10:31:33.463 | -39:58:54.05 | 19.05 0.05 | 17.73 0.01 | 17.25 0.01 | 17.07 0.01 | 17.54 0.92 |
| 29 | 10:31:37.385 | -39:57:52.78 | 20.41 0.08 | 18.31 0.01 | 17.46 0.01 | 17.16 0.01 | 17.91 0.46 |
| 30 | 10:31:32.995 | -39:58:26.69 | 18.76 0.01 | 17.66 0.01 | 17.26 0.01 | 16.98 0.45 | |
| 31 | 10:31:31.990 | -39:58:28.85 | 19.97 0.13 | 18.44 0.01 | 17.85 0.01 | 17.63 0.01 | 17.19 0.43 |
| id | R.A. | Dec. | |||
|---|---|---|---|---|---|
| 1 | 10:31:45.355 | -40:00:42.73 | 12.23 0.01 | 11.99 0.01 | 11.70 0.01 |
| 2 | 10:31:44.107 | -39:55:25.68 | 12.78 0.01 | 12.57 0.01 | 12.34 0.02 |
| 3 | 10:31:42.905 | -39:57:51.19 | 13.03 0.01 | 12.69 0.01 | 12.19 0.01 |
| 4 | 10:31:41.494 | -39:57:10.26 | 13.11 0.01 | 12.76 0.01 | 12.29 0.02 |
| 5 | 10:31:36.185 | -39:54:45.04 | 13.21 0.01 | 12.97 0.01 | 12.68 0.01 |
| 6 | 10:31:24.828 | -39:58:30.29 | 13.22 0.01 | 12.85 0.01 | 12.37 0.02 |
| 7 | 10:31:24.547 | -40:01:44.72 | 13.55 0.01 | 13.27 0.01 | 12.92 0.01 |
| 8 | 10:31:50.942 | -39:57:50.11 | 13.41 0.01 | 13.16 0.01 | 12.87 0.03 |
| 9 | 10:31:20.933 | -39:59:52.55 | 13.69 0.01 | 13.32 0.01 | 12.75 0.01 |
| 10 | 10:31:48.010 | -39:54:23.65 | 13.59 0.01 | 13.29 0.01 | 12.86 0.01 |
| 11 | 10:31:33.866 | -40:00:09.68 | 13.73 0.01 | 13.45 0.01 | 13.14 0.01 |
| 12 | 10:31:26.273 | -39:56:48.23 | 13.71 0.01 | 13.35 0.01 | 12.84 0.01 |
| 13 | 10:31:51.468 | -39:54:42.59 | 13.83 0.01 | 13.42 0.01 | 12.88 0.01 |
| 14 | 10:31:51.929 | -39:54:27.94 | 13.97 0.01 | 13.69 0.01 | 13.39 0.02 |
| 15 | 10:31:24.012 | -39:59:29.94 | 14.05 0.01 | 13.75 0.01 | 13.42 0.01 |
| 16 | 10:31:14.064 | -39:58:45.55 | 14.15 0.01 | 13.90 0.01 | 13.59 0.01 |
| 17 | 10:31:16.582 | -39:56:39.70 | 14.28 0.01 | 14.00 0.01 | 13.71 0.01 |
| 18 | 10:31:18.864 | -39:57:51.30 | 14.21 0.01 | 13.80 0.01 | 13.28 0.01 |
| 19 | 10:31:23.846 | -39:54:50.40 | 14.30 0.01 | 14.05 0.01 | 13.76 0.01 |
| 20 | 10:31:24.442 | -39:55:08.33 | 14.24 0.01 | 14.00 0.01 | 13.73 0.02 |
| 21 | 10:31:46.673 | -39:58:40.19 | 14.29 0.01 | 13.97 0.01 | 13.58 0.02 |
| 22 | 10:31:31.198 | -39:53:32.46 | 14.39 0.01 | 14.10 0.01 | 13.71 0.02 |
| 23 | 10:31:49.822 | -40:00:16.78 | 14.48 0.01 | 14.02 0.01 | 13.35 0.01 |
| 24 | 10:31:42.703 | -39:58:20.78 | 14.54 0.01 | 14.24 0.01 | 13.90 0.01 |
| 25 | 10:31:48.434 | -40:01:29.93 | 14.77 0.01 | 14.49 0.01 | 14.15 0.01 |
| 26 | 10:31:54.881 | -39:56:16.58 | 14.74 0.01 | 14.23 0.01 | 13.67 0.01 |
| 27 | 10:31:33.463 | -39:58:54.05 | 15.09 0.01 | 14.82 0.01 | 14.48 0.02 |
| 28 | 10:31:37.385 | -39:57:52.78 | 15.25 0.01 | 14.95 0.01 | 14.71 0.01 |
| 30 | 10:31:32.995 | -39:58:26.69 | 15.72 0.01 | 15.24 0.01 | 14.70 0.01 |
| 29 | 10:31:31.990 | -39:58:28.85 | 15.63 0.01 | 15.12 0.01 | 14.57 0.02 |
| 31 | 10:31:21.082 | -39:58:30.44 | 15.84 0.01 | 15.56 0.01 | 15.30 0.03 |