Dust Attenuation in UV-selected Starbursts at High Redshift and their Local Counterparts: Implications for the Cosmic Star Formation Rate Density
Abstract
We present a new analysis of the dust obscuration in starburst galaxies at low and high redshift. This study is motivated by our unique sample of the most extreme UV-selected starburst galaxies in the nearby universe (), found to be good analogs of high-redshift Lyman Break Galaxies (LBGs) in most of their physical properties. We find that the dust properties of the Lyman Break Analogs (LBAs) are consistent with the relation derived previously by Meurer et al. (M99) that is commonly used to dust-correct star formation rate measurements at a very wide range of redshifts. We directly compare our results with high redshift samples (LBGs, “”, and sub-mm galaxies at ) having IR data either from Spitzer or Herschel. The attenuation in typical LBGs at and LBAs is very similar. Because LBAs are much better analogs to LBGs compared to previous local star-forming samples, including M99, the practice of dust-correcting the SFRs of high redshift galaxies based on the local calibration is now placed on a much more solid ground. We illustrate the importance of this result by showing how the locally calibrated relation between UV measurements and extinction is used to estimate the integrated, dust-corrected star formation rate density at .
Subject headings:
galaxies: starburst — galaxies: peculiar — dust, extinction — galaxies: high-redshift1. Introduction
The ultraviolet (UV) and far-infrared (far-IR) emission of star-forming galaxies (SFGs) offers one of the most direct estimates of their star formation rate (SFR). The fraction of light emerging in the IR relative to that in the UV is modulated primarily by the amount of dust seen by young stars (Meurer et al., 1999; Calzetti et al., 2000; Buat et al., 2002; Burgarella et al., 2005; Seibert et al., 2005; Treyer et al., 2007), with secondary effects due to, e.g., star formation history and geometry (Charlot & Fall, 2000; Kong et al., 2004; Inoue et al., 2006; Boissier et al., 2007; Johnson et al., 2007; Salim et al., 2007; Panuzzo et al., 2007; Cortese et al., 2008; Boselli et al., 2010). For a relatively young galaxy forming stars at a stable rate, the SFR is proportional to the UV luminosity (Leitherer & Heckman, 1995), while the degree of reddening of the UV continuum is related to the amount of dust. This reddening can be expressed in terms of the UV slope, with , and the total attenuation is given by the ratio (Meurer et al., 1999, M99). The “” relation of M99 is based on a large sample of local starburst galaxies, and has proven to be an extremely useful tool for estimating total SFRs from UV-only data. For the relation to work, it is implied that the dust must be near the UV sources and have some kind of shell- or screen-like geometry (Gordon et al., 2000).
The IRX relation is particularly important at high redshift. SFR estimates based on IR, X-ray, or radio data are typically available only for the brightest objects (Pope et al., 2006; Siana et al., 2008, 2009; Reddy et al., 2006, 2010,R10), or statistically through stacks (Seibert et al., 2002; Carilli et al., 2008; Reddy et al., 2010,R10; Magdis et al., 2010a, b; Ho et al., 2010; Kurczynski et al., 2010; Rigopoulou et al., 2010). Surveys in the rest-frame UV can simultaneously give and and hence the dust-corrected SFR based on the local IRX relation. Using this technique, Bouwens et al. (2009, B09) estimated the SFR density from large samples of LBGs. They found that most of the energy output at () occurs in the IR (UV), and that the SFR density can be largely recovered by dust-correcting the UV measurements thus demonstrating the importance of UV surveys. However, because local calibrations of the IRX relation are based on galaxies that are very different from typical UV-selected starburst galaxies at , it is not clear whether they are valid at high redshift. In this Letter, we re-investigate the IRX- relation for the first time using a unique population of nearby () starbursts that has been shown to be similar to LBGs in most of their basic physical properties. These “Lyman Break Analogs” (LBAs) are similar in mass, age, size, metallicity, optical extinction, and SFR (Heckman et al., 2005; Hoopes et al., 2007; Basu-Zych et al., 2007), have similar compact and clumpy morphologies (Overzier et al., 2008, 2010), similar kinematics (Basu-Zych et al., 2009; Gonçalves et al., 2010), and a similar feedback-dominated interstellar medium (Overzier et al., 2009, O09). The structure of this Letter is as follows. We first present our data and measurements (§2). We compare LBAs with low and high redshift SFGs having good IR data from Spitzer or Herschel (§3), and we discuss the possible implications of our results on the SFR density at high redshift (§4).
2. Data and Methods
2.1. Lyman Break Analogs UV and IR data
The sample of 31 LBAs from O09 forms the basis of this paper. FUV luminosities, with Å, were calculated from our F150LP (1614Å) data taken with the Hubble Space Telescope (HST) Advanced Camera for Surveys (see Overzier et al., 2008, O09, for details). The slope of the UV continuum, , was calculated111 from Galaxy Evolution Explorer (GALEX) General Release 6 data in the FUV (1530Å) and NUV (2315Å) having total exposure times of 100–13,000 s. All LBAs are unresolved in the GALEX images, and we measured total magnitudes in a 9″ radius aperture. We perform a small -correction to obtain and at using a set of starburst templates. In this paper we work exclusively with the photometric measure of (as opposed to the “true” obtained from a power-law fit to a UV spectrum), that is most appropriate for comparing with samples for which spectra are usually not available in large numbers.
We use IR data obtained with the Infrared Array Camera (IRAC), the Multi-band Imaging Photometer (MIPS), and the InfraRed Spectrograph (IRS) on the Spitzer Space Telescope (O09, Armus et al. in prep.). At 24m and shorter wavelengths, point source photometry was performed on the post-Basic Calibration Data (“pBCD”). At 70 and 160m, flux densities were obtained by aperture photometry on the filtered pBCD images. Upper limits were determined from the standard deviation images. The IRS spectra covering observed wavelengths in the range 5–35m were normalized to the MIPS 24m data. We estimate IR luminosities, (3-1000m), by fitting our data with the model library of Siebenmorgen & Krügel (2007) (SK07). This method allows us to fit models covering a wide range of physical parameters, thus obtaining a good sense of the range of models allowed by our data within the measurement errors. We simulate our IRAC+MIPS+IRS data set (including measurement errors and upper limits) and calculate and its error by taking the median and standard deviation of all the templates that best fit the data in the monte carlo simulation222While our results obtained using SK07 are consistent with those obtained from black-body fitting, we note that the SK07 library generally performs better for LBAs compared to the more commonly used empirical library from Chary & Elbaz (2001). The latter often failed to simultaneously fit the mid-IR and the far-IR dust emission, presumably due to the fact that the LBAs show a greater spectral variation than typical IR-selected starbursts in the local universe.. Four objects lacking a sufficient number of IR data points were removed from the sample, as well as one object with an (obscured) active nucleus identified in recent optical spectroscopy. The UV and IR measurements for the 26 remaining objects are given in Table 1.
2.2. Redetermination of the Meurer et al. (1999) relation
In order to be able to compare the results from different samples at low and high redshift in a consistent manner, we have re-measured the original M99 IRX- relation using GALEX data and an updated estimate of . 47 galaxies of the M99 sample are covered by GALEX. Details on the photometry will be provided in a forthcoming paper. In brief, we follow the procedures in Wang et al. (2010) carefully masking neighbours and image artefacts, perform background subtraction, and photometry on PSF-matched images using elliptical apertures out to a maximum radius, , of . Because is in most cases much larger than the International UV Explorer (IUE) aperture of used by M99, we also measure the inner UV colors and fluxes within a maximum radius of 10″ for comparison with earlier work. We compute using the Infared Astronomical Satellite (IRAS) fluxes at 12, 25, 60, and 100m (Sanders & Mirabel, 1996).
3. Results
3.1. The IRX- Relation of LBAs versus M99
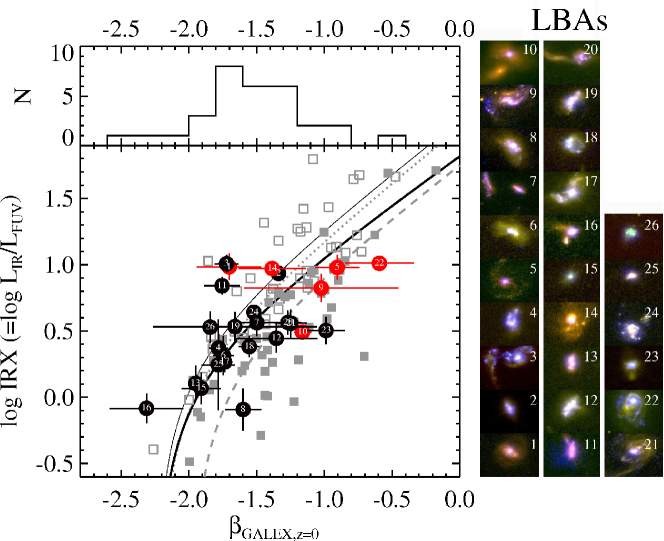
In Fig. 1 we show the IRX- diagram for LBAs. Panels show the corresponding HST morphologies from O09, and the distribution of UV slopes (top panel). We also show the values measured in §2.2 for the M99 galaxies using an aperture radius of most similar to M99, and within enclosing the entire source. We follow M99 and write IRX in terms of , the attenuation at 1600Å, and the bolometric corrections to the total light emitted by stars (BCFUV,∗) and dust (BCdust):
| (1) |
with BC (M99, Seibert et al., 2005), and BC for our estimate of . We then derive the best-fit relation by performing a linear fit of the form to the data in Fig. 1. Similar to M99 we exclude galaxies having radii of . We find (IRXM99,inner, dotted line), and (IRXM99,total, dashed line). Our redetermination of IRXM99,inner is very similar to the original M99 relation (IRXM99,0, thin solid line). However, using the new larger aperture we find more flux in the FUV for nearly all sources, and hence a lower IRX. The smaller IUE aperture used by M99 may thus have missed about half the light. On the other hand, in both cases we use a single integrated IR luminosity of unknown spatial distribution. For a subset of 12 galaxies from M99, we were able to compare the IRAS measurements with more recent determinations of based on Spitzer photometry encompassing the entire source (Engelbracht et al., 2008). The results are in good agreement. If a significant fraction of the IR is due to heating by stars further out, using IRXM99,0 rather than IRXM99,total would lead to an overestimate of the total attenuation. Alternatively, IRXM99,total could be affected by the (redder) UV light from somewhat older stellar populations on the outskirts of the galaxies. In this case, the interpretation of IRXM99,total would be less straightforward as it requires knowledge of the star formation history (see Kong et al., 2004).
How do LBAs compare to these IRX relations? A fit to LBAs gives (implied FUV attenuations of 0–3 mag). The dispersion found in IRXLBA is 0.6. As shown in Fig. 1, the LBAs are thus in much better agreement, on average, with M99 (inner) than with M99 (total), but we note that this only applies to the range of probed by these samples. We conclude that the dust properties of LBAs are most similar to those found only in the inner starburst cores of the M99 galaxies.
3.2. The Attenuation of Starbursts at Low and High Redshift
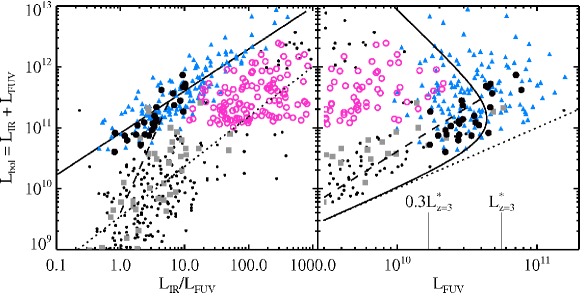
With good estimates of and and thus the bolometric luminosity (), we can compare LBAs to other local and high redshift SFGs. This is shown in Fig. 2. In the left panel we show versus the attenuation () for LBAs, ordinary SFGs, M99 starbursts, and Luminous IR Galaxies (LIRGs) all at low redshift, and “BM/BX” LBGs at from R10. Typical SFGs in the local universe lie along a broad sequence in which the attenuation roughly follows (indicated by the dotted line). LBAs and LBGs follow a similar relation, but one that is offset by 1–2 dex toward lower attenuations at the same (solid line shows the best-fit relation from R10). Conversely, at fixed LBAs and LBGs reach much higher FUV luminosities than typical local star-forming galaxies (i.e. , right panel of Fig. 2).
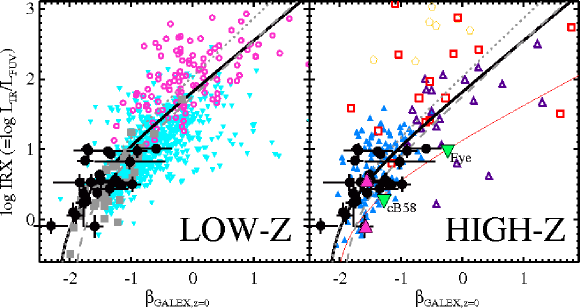
Because LBAs appear so similar compared to LBGs in terms of their and attenuation (Fig. 2), it is interesting to see whether the IRX relation at low and high redshift is similar as well. In Fig. 3 we show a compilation of low and high redshift data for which accurate measurements are available. We first compare LBAs with the sample of SFGs detected with GALEX and Herschel from Buat et al. (2010), and with LIRGs from Howell et al. (2010), shown left. Aperture effects either in the UV or the IR are most likely much less of a problem compared to the M99 sample, due to the higher average redshifts of the two samples compared to that of M99. Therefore we will use IRXM99,total as our reference (dashed line). LIRGs tend to lie above this relation, while the galaxies from Buat et al. (2010) lie below it (on average). For these samples, we would therefore tend to, respectively, under- and overestimate the attenuation when using IRXM99,total, while IRXM99,inner performs somewhat better for LIRGs (see Buat et al., 2010; Howell et al., 2010, for detailed discussion).
In the right panel of Fig. 3 we present an overview of the situation at , showing LBGs, and sub-mm galaxies (SMGs) at (Reddy et al., 2006, R10), lensed LBGs (“cB58” and the cosmic “Eye”; Siana et al., 2008, 2009), and stacked LBGs at (Magdis et al., 2010a, b). LBAs and LBGs occupy a very similar region in this IRX- diagram, confirming the similarity between the two samples. We should note that the IRX estimate of R10 is not based on a direct measurement of the IR emission (it is based on a combination of , and ), but statistical detections in the X-rays appear consistent with the extrapolated estimates of (Seibert et al., 2002, R10). We can also compare our results with the statistical detection of LBGs in stacks at 100m and 160m from recent Herschel observations. This result is indicated by the upper magenta triangle, which falls right in the middle of the distribution of LBAs and LBGs. This suggests that even for the most IR-luminous LBGs (median of , i.e. ULIRGs) the attenuation is exactly as expected based on the locally determined IRX (inner) relation.
Direct measurements of the mid- or far-IR emission from LBGs are available in only a handful of cases. In Fig. 3 we indicate the results found for two bright, lensed LBGs at from Siana et al. (2008, 2009). These objects have direct detections at (observed) 24 and 70m (as well as 850m and 1.2 mm in the case of cB58), allowing a good estimate of . It has been noted that both objects appear to lie substantially below IRXM99,0, perhaps requiring a modified extinction curve or an extremely young stellar population (see Baker et al., 2001; Siana et al., 2009, and the discussion on “young galaxies” by R10). An extinction curve more similar to that of the Small Magellanic Cloud (SMC), i.e., extinction that occurs in a more uniform rather than a patchy foreground dust screen would require less emission by dust for the same stellar population age, and hence lower IRX (see red curve in Fig. 3). cB58 lies on the lower envelope formed by LBAs and galaxies, and the observed scatter is larger than the difference expected between the standard Calzetti-type and SMC-type extinction curves for small . The cosmic Eye, however, has a much larger slope () and lies well below the starburst IRX relations. Previous studies have shown that offsets from IRX are commonly due to more complicated star formation histories (e.g. Kong et al., 2004). This is a likely explanation, at least for the local SFGs (left panel), BzK galaxies (right panel, see also Nordon et al., 2010), and LBAs (see objects marked “DCOs” in Fig. 1 and O09) having relatively low IRX ratios. For the cosmic Eye, however, a modified extinction curve may indeed be required in order to simultaneously explain its relatively simple stellar population and its low IRX ratio (Siana et al., 2009).
4. Discussion and conclusions
The first goal of this paper was to investigate whether LBAs are consistent with the M99 relation, and we have shown that this is indeed the case. This is an important result: Because LBAs are much better analogs to LBGs compared to previous local samples, including M99, the applicability of the local dust correction at high redshift now appears to be on much more solid ground. Confirmation of this result is given by the fact that LBAs are also very similar to typical LBGs in terms of their dust properties (Figs. 2 and 3), although some caution must be taken as true measurements are still sparse at high redshift.
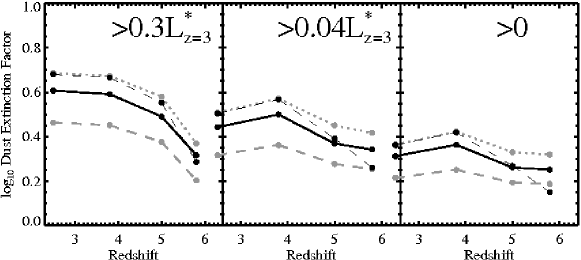
We can show the implications of these results on the determination of the SFR density at . B09 used large dropout samples from the Hubble Ultra Deep Field to quantify the relation between and , and computed the total dust corrections to the SFR density by integrating the UV luminosity functions at each redshift (Bouwens et al., 2007; Reddy & Steidel, 2009) and assuming that IRXM99,0 is valid. The method and data that we use here is similar to that of B09 (Fig. 8 and §5.4 of that work), but instead of using IRXM99,0 we show the results for our new IRX relations derived in §3.1. The results are shown in Fig. 4, which gives the total correction factor that is needed to dust-correct a measurement of the UV luminosity (or SFR) density at . Not surprisingly, IRXLBA (thick black lines) and IRXM99,inner (dotted lines) give quite similar results to the relation used by B09 (thin dashed lines). Note that if we assume that IRXM99,total measured within the larger aperture provides a better estimate of the total attenuation, the total dust-correction would have to be lowered by dex at all redshifts and for all luminosities (grey dashed lines). We conclude that current determinations of the cosmic SFR density based on dust-corrected UV data from Lyman break galaxy surveys appear to be on solid ground, but, as noted by B09, this is mainly due to the large contribution from very faint, blue sources at high redshift.
Direct measurements of for relatively red () galaxies at are needed to constrain the IRX relation in this regime, while the most obscured sources typically do not follow the IRX relations at all (e.g. ULIRGs at low and SMGs at high redshift). This illustrates the importance of surveys in the IR currently being performed by Herschel. In forthcoming papers we will present a more detailed analysis of the dust properties of LBAs and LBGs based on IRS spectra as well as new far-IR data from Herschel.
References
- Baker et al. (2001) Baker, A. J., Lutz, D., Genzel, R., Tacconi, L. J., & Lehnert, M. D. 2001, A&A, 372, L37
- Basu-Zych et al. (2007) Basu-Zych, A. R., et al. 2007, ApJS, 173, 457
- Basu-Zych et al. (2009) Basu-Zych, A., et al. 2009, ApJ, 699, L118
- Boissier et al. (2007) Boissier, S., et al. 2007, ApJS, 173, 524
- Boselli et al. (2010) Boselli, A., et al. 2010, A&A, 518, L61
- Bouwens et al. (2007) Bouwens, R. J., Illingworth, G. D., Franx, M., & Ford, H. 2007, ApJ, 670, 928
- Bouwens et al. (2009) Bouwens, R. J., et al. 2009, ApJ, 705, 936 (B09)
- Buat et al. (2002) Buat, V., Boselli, A., Gavazzi, G., & Bonfanti, C. 2002, A&A, 383, 801
- Buat et al. (2010) Buat, V., et al. 2010, MNRAS, L119
- Burgarella et al. (2005) Burgarella, D., Buat, V., & Iglesias-Páramo, J. 2005, MNRAS, 360, 1413
- Calzetti et al. (2000) Calzetti, D., Armus, L., Bohlin, R. C., Kinney, A. L., Koornneef, J., & Storchi-Bergmann, T. 2000, ApJ, 533, 682
- Carilli et al. (2008) Carilli, C. L., et al. 2008, ApJ, 689, 883
- Charlot & Fall (2000) Charlot, S., & Fall, S. M. 2000, ApJ, 539, 718
- Chary & Elbaz (2001) Chary, R., & Elbaz, D. 2001, ApJ, 556, 562
- Cortese et al. (2008) Cortese, L., Boselli, A., Franzetti, P., Decarli, R., Gavazzi, G., Boissier, S., & Buat, V. 2008, MNRAS, 386, 1157
- Engelbracht et al. (2008) Engelbracht, C. W., Rieke, G. H., Gordon, K. D., Smith, J.-D. T., Werner, M. W., Moustakas, J., Willmer, C. N. A., & Vanzi, L. 2008, ApJ, 678, 804
- Gonçalves et al. (2010) Gonçalves, T. S., et al. 2010, ApJ, 724, 1373 (arXiv:1009.4934)
- Gordon et al. (2000) Gordon, K. D., Clayton, G. C., Witt, A. N., & Misselt, K. A. 2000, ApJ, 533, 236
- Heckman et al. (2005) Heckman, T. M., et al. 2005, ApJ, 619, L35
- Ho et al. (2010) Ho, I., Wang, W.-H., Morrison, G. E., & Miller, N. A. 2010, arXiv:1008.4630
- Hoopes et al. (2007) Hoopes, C., et al. 2007, ApJS, 173, 441
- Howell et al. (2010) Howell, J. H., et al. 2010, ApJ, 715, 572
- Huang et al. (2009) Huang, J.-S., et al. 2009, ApJ, 700, 183
- Inoue et al. (2006) Inoue, A. K., Buat, V., Burgarella, D., Panuzzo, P., Takeuchi, T. T., & Iglesias-Páramo, J. 2006, MNRAS, 370, 380
- Johnson et al. (2007) Johnson, B. D., et al. 2007, ApJS, 173, 392
- Kong et al. (2004) Kong, X., Charlot, S., Brinchmann, J., & Fall, S. M. 2004, MNRAS, 349, 769
- Kurczynski et al. (2010) Kurczynski, P., Gawiser, E., Huynh, M., Ivison, R., Treister, E. et al. 2010, ApJ, submitted (arXiv:1010.0290)
- Leitherer & Heckman (1995) Leitherer, C., & Heckman, T. M. 1995, ApJS, 96, 9
- Magdis et al. (2010b) Magdis, G. E., et al. 2010b, ApJ, 720, L185
- Magdis et al. (2010a) Magdis, G. E., Elbaz, D., Daddi, E., Morrison, G. E., Dickinson, M., Rigopoulou, D., Gobat, R., & Hwang, H. S. 2010a, ApJ, 714, 1740
- Meurer et al. (1999) Meurer, G. R., Heckman, T. M., & Calzetti, D. 1999, ApJ, 521, 64 (M99)
- Nordon et al. (2010) Nordon, R., et al. 2010, A&A, 518, L24
- Overzier et al. (2008) Overzier, R. A., et al. 2008, ApJ, 677, 37
- Overzier et al. (2009) Overzier, R. A., et al. 2009, ApJ, 706, 203 (O09)
- Overzier et al. (2010) Overzier, R. A., Heckman, T. M., Schiminovich, D., Basu-Zych, A., Gonçalves, T., Martin, D. C., & Rich, R. M. 2010, ApJ, 710, 979
- Panuzzo et al. (2007) Panuzzo, P., Granato, G. L., Buat, V., Inoue, A. K., Silva, L., Iglesias-Páramo, J., & Bressan, A. 2007, MNRAS, 375, 640
- Pope et al. (2006) Pope, A., et al. 2006, MNRAS, 370, 1185
- Reddy et al. (2006) Reddy, N., et al. 2006, ApJ, 644, 792
- Reddy & Steidel (2009) Reddy, N. A., & Steidel, C. C. 2009, ApJ, 692, 778
- Reddy et al. (2010,R10) Reddy, N. A., Erb, D. K., Pettini, M., Steidel, C. C., & Shapley, A. E. 2010, ApJ, 712, 1070 (R10)
- Rigopoulou et al. (2010) Rigopoulou, D., et al. 2010, arXiv:1009.2715
- Salim et al. (2007) Salim, S., et al. 2007, ApJS, 173, 267
- Sanders & Mirabel (1996) Sanders, D. B., & Mirabel, I. F. 1996, ARA&A, 34, 749
- Seibert et al. (2002) Seibert, M., Heckman, T. M., & Meurer, G. R. 2002, AJ, 124, 46
- Seibert et al. (2005) Seibert, M., et al. 2005, ApJ, 619, L55
- Siana et al. (2008) Siana, B., Teplitz, H. I., Chary, R.-R., Colbert, J., & Frayer, D. T. 2008, ApJ, 689, 59
- Siana et al. (2009) Siana, B., et al. 2009, ApJ, 698, 1273
- Siebenmorgen & Krügel (2007) Siebenmorgen, R., & Krügel, E. 2007, A&A, 461, 445
- Treyer et al. (2007) Treyer, M., et al. 2007, ApJS, 173, 256
- Wang et al. (2010) Wang, J., Kauffmann, G., Overzier, R. et al. 2010, MNRAS, in press (arXiv:1011.0829)
| IDa | Name | log | log b | log c | log IRX | |||||
|---|---|---|---|---|---|---|---|---|---|---|
| (SDSSJ…) | (mag) | (mag) | () | () | () | |||||
| 1† | 005439.79+155446.9 | 0.236 | 20.47 | 20.23 | ||||||
| 2 | 005527.46-002148.7 | 0.167 | 19.08 | 18.71 | ||||||
| 3 | 015028.40+130858.3 | 0.147 | 18.48 | 18.33 | ||||||
| 4 | 020356.91-080758.5 | 0.189 | 19.15 | 19.00 | ||||||
| 5† | 021348.53+125951.4 | 0.219 | 19.60 | 18.91 | ||||||
| 6 | 032845.99+011150.8 | 0.142 | 19.19 | 19.05 | ||||||
| 7 | 035733.99-053719.7 | 0.204 | 19.65 | 19.33 | ||||||
| 8 | 040208.86-050642.0 | 0.139 | 18.89 | 18.68 | ||||||
| 9† | 080232.34+391552.6 | 0.267 | 20.02 | 19.34 | ||||||
| 10† | 080844.26+394852.3 | 0.091 | 17.98 | 17.59 | ||||||
| 11 | 082001.72+505039.1 | 0.217 | 19.85 | 19.65 | ||||||
| 12 | 082550.95+411710.2 | 0.156 | 19.58 | 19.23 | ||||||
| 13 | 083803.72+445900.2 | 0.143 | 18.92 | 18.89 | ||||||
| 14† | 092159.38+450912.3 | 0.235 | 19.19 | 18.76 | ||||||
| 15 | 092336.45+544839.2 | 0.222 | 19.72 | 19.61 | ||||||
| 16 | 092600.40+442736.1 | 0.181 | 18.69 | 18.83 | ||||||
| 17 | 093813.49+542825.0 | 0.102 | 17.83 | 17.72 | ||||||
| 18 | 102613.97+484458.9 | 0.160 | 19.20 | 18.95 | ||||||
| 19 | 124819.74+662142.6 | 0.260 | 19.98 | 19.70 | ||||||
| 20 | 135355.90+664800.5 | 0.198 | 18.99 | 18.54 | ||||||
| 21 | 143417.15+020742.3 | 0.180 | 19.50 | 19.07 | ||||||
| 22† | 210358.74-072802.4 | 0.137 | 18.49 | 17.76 | ||||||
| 23 | 214500.25+011157.5 | 0.204 | 20.00 | 19.40 | ||||||
| 24 | 231812.99-004126.1 | 0.252 | 19.23 | 18.87 | ||||||
| 25 | 232539.22+004507.2 | 0.277 | 20.47 | 20.25 | ||||||
| 26 | 235347.68+005402.0 | 0.223 | 20.07 | 19.92 |