Outflows, Accretion, and Clustered Protostellar Cores around a Forming O Star
Abstract
We present a Submillimeter Array study in the 1.3 mm waveband of the NGC 7538 IRS 1–3 massive star-forming region. The brightest core in the mm continuum map, MM1, harbors the IRS 1 young O star. The core has a gas temperature of about 245 K and shows spatially unresolved emission in complex organic molecules, all typical of a hot molecular core. Toward MM1, redshifted absorption is seen in molecular lines with different energies above the ground state. This absorption probes inward motion of the dense gas toward the central young O star, and the estimated mass accretion rate reaches yr-1. Multiple outflows are seen in the CO and 13CO maps. The gas mass of 50 and mass outflow rate of yr-1 measured in CO line wings are dominated by the MM1 outflow, which is most likely driven by a fast wide-angle wind. Apart from MM1, we discover eight new dusty cores, MM2–9, within a projected distance of 0.35 pc from MM1. These cores show no counterpart in infrared or radio continuum emission, while seven of them appear to be forming intermediate- to high-mass stars. This manifests a deeply embedded star-forming component of the parent cloud of IRS 1–3. Apparently we are observing a Trapezium system in formation, and the system is presumably surrounded by a cluster of lower mass stars.
1 Introduction
NGC 7538 is a large, optically visible HII region in the Perseus arm. About 2 arcmin (1.5 pc) southeast to the center of the HII region is a site of active massive star formation known for three radio and infrared (IR) sources IRS 1–3 (Martin, 1973; Wynn-Williams et al., 1974). Located at a distance of 2.65 kpc (Moscadelli et al., 2009), the IRS 1–3 region has a total luminosity of , of which the luminosity of IRS 1 is about , equivalent to a ZAMS spectral type of O7.5 (Werner et al., 1979; Campbell & Thompson, 1984; Akabane & Kuno, 2005). IRS 2 and IRS 3 are two nearby sources less obscured than IRS 1. IRS 2 has a luminosity of and is associated with a compact HII region; IRS 3 has a luminosity of and is associated with an ultracompact HII region (Campbell & Thompson, 1984; Bloomer et al., 1998; Sandell et al., 2009).
IRS 1 has attracted numerous studies. Radio continuum observations show that the ionized gas has a double-lobed structure within the central region and more extended halos at a scale (Campbell, 1984; Gaume et al., 1995; Sandell et al., 2009), and exhibits time variation in emission flux (Franco-Hernández & Rodríguez, 2004). Radio recombination lines (RRLs) observed at cm and mm wavelengths show extremely broad line widths, suggestive of expanding motion of the ionized gas (Gaume et al., 1995; Keto et al., 2008). In high-angular-resolution mid-IR images, a shell-like structure extending from IRS 1 to about to the northwest is interpreted as dust emission on the wall of the outflow cavity (De Buizer & Minier, 2005). -band images obtained with speckle interferometry show a fan-shaped nebula extending from IRS 1 toward the northwest, and the emission is predominantly attributed to scattered light from an outflow cavity (Kraus et al., 2006). On larger scales, single-dish CO observations reveal a bipolar outflow with a northwest-southeast (NW-SE) orientation which is centered at IRS 1 (Kameya et al., 1989; Davis et al., 1998). IRS 1 is associated with various types of molecular masers (e.g., Pratap et al., 1989, and references therein). Pestalozzi et al. (2004) modeled a group of methanol masers detected toward IRS 1 as tracing an edge-on Keplerian disk around a central star of 30 , although the orientation of a possible disk around IRS 1 is controversial (e.g., De Buizer & Minier, 2005; Klaassen et al., 2009).
Existing high-angular-resolution observations toward NGC 7538 IRS 1 mostly focus on hot dust and ionized gas in the close vicinity of the young O star, while kinematics and physical conditions of molecular gas in the dusty envelope is less clear. Moreover, the molecular outflow in this region has not been observed at high angular resolutions; a pioneering interferometric study performed by Scoville et al. (1986) is of moderate resolution and image quality. In this paper we present a 1.3 mm waveband study of the NGC 7538 IRS 1 region using the Submillimeter Array111The Submillimeter Array is a joint project between the Smithsonian Astrophysical Observatory and the Academia Sinica Institute of Astronomy and Astrophysics and is funded by the Smithsonian Institution and the Academia Sinica., aimed at understanding physical conditions and kinematics of the gas and dust cocoon surrounding the young O star and the nature of the molecular outflow. In its course we discovered clustered star-forming cores deeply embedded within the parent cloud of IRS 1–3 and multiple molecular outflows. A description of observations and data reduction is presented in Section 2. Observational results are presented in Section 3, followed by discussions on their implications in Section 4. Finally, a summary of the main findings is given in Section 5.
2 Observations and Data Reduction
2.1 SMA Observations
The SMA observations were undertaken on 2007 July 13 with eight antennas in the Compact-north configuration. The weather was very good during the observation, with 1.5 to 2.5 mm precipitable water vapor (PWV), corresponding to atmospheric optical depth at 225 GHz, , around 0.08 to 0.12. To cover the entire outflow we observed two fields centered at (R.A., decl.) and , guided by previous single-dish observations (Davis et al., 1998). The 22 GHz correlator was configured to cover rest frequencies about 219.2 to 221.2 GHz in the lower sideband and about 229.2 to 231.2 GHz in the upper sideband, with a uniform spectral resolution of 812.5 kHz (1.1 km s-1). We observed 3c273 and Callisto for bandpass calibration and MWC349, for which a flux of 1.65 Jy at 225 GHz was adopted, for flux calibration. Time dependent gains were monitored by interleavingly observing J0102+584 and BL Lac every 30 mins. The primary calibrations were carried out with the IDL MIR package, which allows to determine antenna gains (versus frequency or time) by simultaneously fitting multiple calibrators. The calibrated visibilities were exported to MIRIAD for further processing. A continuum database was constructed from line-free channels using the MIRIAD task UVLIN. We self-calibrated the continuum solving for phase corrections with decreasing time intervals (5, 2, 1 min), and then solving for phase and amplitude corrections for the last iteration. The solutions from the self-calibration were applied to spectral line data as well.
In Figure 1, the predominant core MM1 is more than 10 times brighter than MM2–9. As the dynamical range of an interferometric image is limited by incomplete sampling, we assess the reliability of MM2–9. We imaged J0102+584 and BL Lac and found that each of the two quasars appears as a point source at the phase center, and the position agrees with the nominal coordinate to . We also found that features associated with MM2–9 are identifiable in the continuum and spectral line images without self-calibration. Furthermore, we obtained a model of MM1 by restricting CLEAN (a deconvolution task in MIRIAD) to a polygon closely around MM1, subtracted “MM1” from the calibrated visibilities using the task UVMODEL, and imaged the residual visibilities; MM1 was completely invisible while MM2–9 were clearly seen in the image, indicating that none of the fainter cores was falsely generated due to sidelobes of MM1 during deconvolution.
The final maps have a synthesized beam of , and r.m.s. sensitivities of 5 mJy for continuum and 35 mJy per 1.2 km s-1 for lines.
2.2 Short Spacings in CO and 13CO (2–1)
In an interferometric observation, structures more extended than 1.2, where is the observing wavelength and the shortest length of the projected baselines, cannot be effectively sampled. This filtering effect is significant for CO and 13CO maps, particularly at velocities around the cloud velocity. Adding in single-dish observations is a way to overcome this effect (e.g., Qiu et al., 2009). For CO (2–1), we combined the SMA data with data obtained from the James Clerk Maxwell Telescope (JCMT) by Davis et al. (1998). For 13CO (2–1), we carried out on-the-fly mapping observations with the Caltech Submillimeter Observatory222The Caltech Submillimeter Observatory is supported by the NSF grant AST-0229008 (CSO) 10.4 m telescope on 2008 June 11. During the last observation, the weather was reasonably good with about 4 mm PWV and around 0.2. We obtained a grid map centered on (R.A., decl.). The grid cell spacing is 10′′, roughly of the FWHM beam at this frequency. The effective integration time toward each cell is about 10 s. The AOS spectrometer has 1024 channels throughout the 50 MHz bandwidth, thus a spectral resolution of 48.8 kHz (or 0.066 km s-1). The data were reduced using the standard CLASS package. The combination of the SMA and single-dish data was conducted in MIRIAD following a procedure outlined in Zhang et al. (1995). The final CO and 13CO maps were smoothed to 2 km s-1 per channel.
3 Results
3.1 1.3 mm Continuum Emission
Figure 1 presents the 1.3 mm continuum map, which reveals a cluster of nine mm cores, namely MM1 to MM9 in order of peak fluxes. Measured parameters of these cores are listed in Table 1. The brightest core MM1 coincides with the luminous IR and radio source IRS 1. The 1.3 mm continuum flux has a contribution of 1.5 Jy from the free-free emission extrapolated from cm measurements (Sandell et al., 2009), and the dust emission flux is about 2.1 Jy. The 1.3 mm emission from MM2 to MM9 is entirely dominated by the dust emission, since none of them is seen in cm continuum. In contrast to IRS 1, neither IRS 2 nor IRS 3 appears to be embedded within a dense dusty core.
Assuming thermal equilibrium between the dense gas and dust, we adopt a temperature of 245 K for MM1 derived from a local thermodynamical equilibrium (LTE) model of the CH3CN emission (Section 3.3.1). Cores MM2–9 have much lower temperatures; we estimate temperatures from NH3 data (Zheng et al., 2001) for MM6–9 (Section 3.3.2) and adopt an averaged temperature of 40 K for MM2–5 (Section 4.3). We then estimate gas masses of all the cores by adopting the dust opacity cm2 g-1 (Ossenkopf & Henning, 1994), which is equivalent to an opacity index of 1.375 for )β cm2 g-1 (Hildebrand, 1983), and a canonical gas-to-dust mass ratio of 100. The derived core masses are listed in Table 1. The error bars of the core masses presented in Table 1 account for errors in measuring the continuum fluxes and calculating the temperatures. For MM1, the uncertainty in extrapolating the free-free emission is also taken into account. For MM2–5, an averaged uncertainty of is assumed for the adopted temperature. There is a systemic uncertainty, , introduced by the distance error (0.12 kpc, Moscadelli et al., 2009). Other uncertainties come from possible variations of the gas-to-dust mass ratio and the dust opacity; the latter can be constrained with future high angular resolution observations at different wavelengths.
3.2 Molecular Outflows
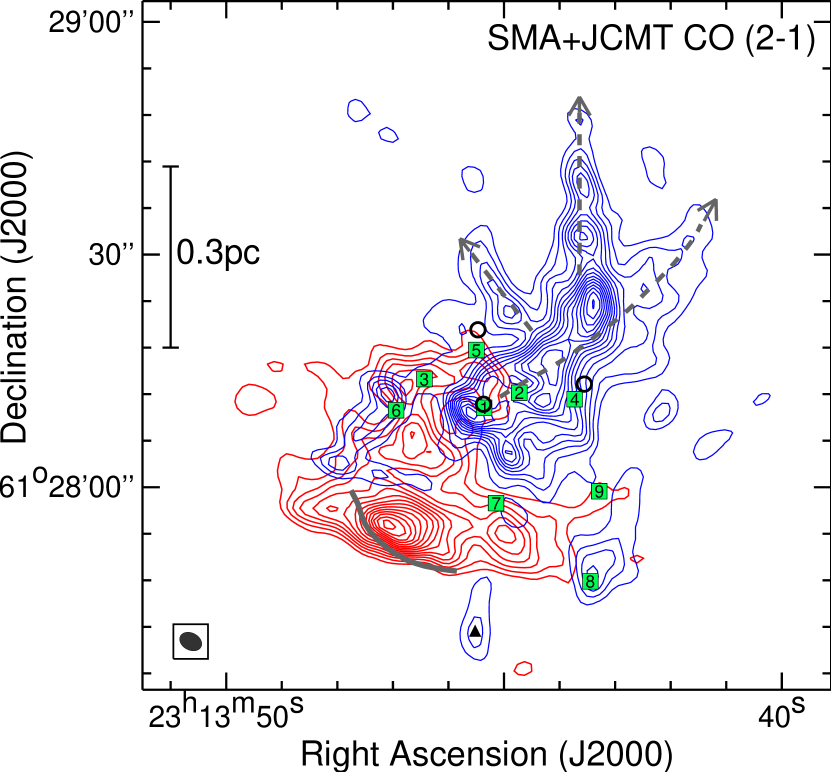
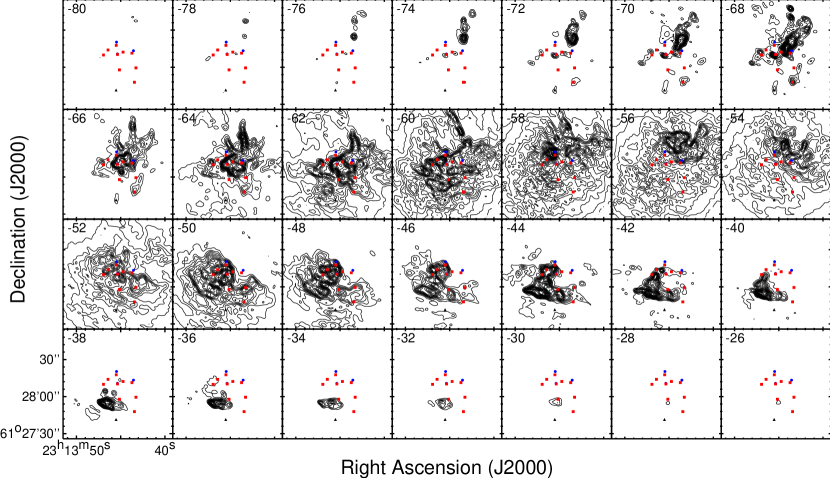
Figure 2 shows the velocity integrated CO (2–1) emission obtained from the combined SMA and JCMT data sets. Velocity channel maps of the emission are shown in Figure 3. Overall the CO emission shows spatially separated blue- and redshfited lobes in a NW-SE orientation, whereas the detailed structures are ascribed to multiple outflows rather than a simple bipolar outflow seen in previous single-dish observations.
In the integrated map, the blueshifted lobe appears as a curved filament originating from MM1 and diverging into three “branches” toward the northwest, north, and northeast. However, from the orientation, the northeastern branch with a position angle (PA) of about 40∘ is more likely arising from MM4 or IRS 3; from the channel maps at to km s-1, the northern branch with a PA of about 0∘ may originate from IRS 3 or MM4 as well. In addition, at least four more dusty cores, MM2, MM6, MM7, and MM8 appear to be associated with blueshifted CO outflows: an elongated feature extending from MM6 to the southeast is seen in the integrated map and blueshifted channel maps of km s-1; emission around MM8 and extending to the northwest is seen in the integrated map and blueshifted channel maps of km s-1; emission associated with MM2 is seen as a knot to its immediate southwest at to km s-1 and as a compact elongation at to km s-1; compact and faint emission extending from MM7 to the southwest is visible at to km s-1.
The redshifted emission appears as a large-scale “arc” in the integrated map, while the detailed structures can be attributed to at least two cores, MM1 and MM7. MM1 is presumably the powering source of the emission extending from around MM1 to a bright clump about (0.26 pc) to the southeast; the clump is encompassed by a C-shaped structure seen in C18O (2–1). MM7 is likely the central source of the CO emission in its close vicinity: a knot about (0.09 pc) to the northeast seen at and km s-1 is most likely the redshifted counterpart of the compact feature seen at to km s-1; a southwestern clump identifiable in the integrated map and channel maps of km s-1 is probably associated with MM7 as well.
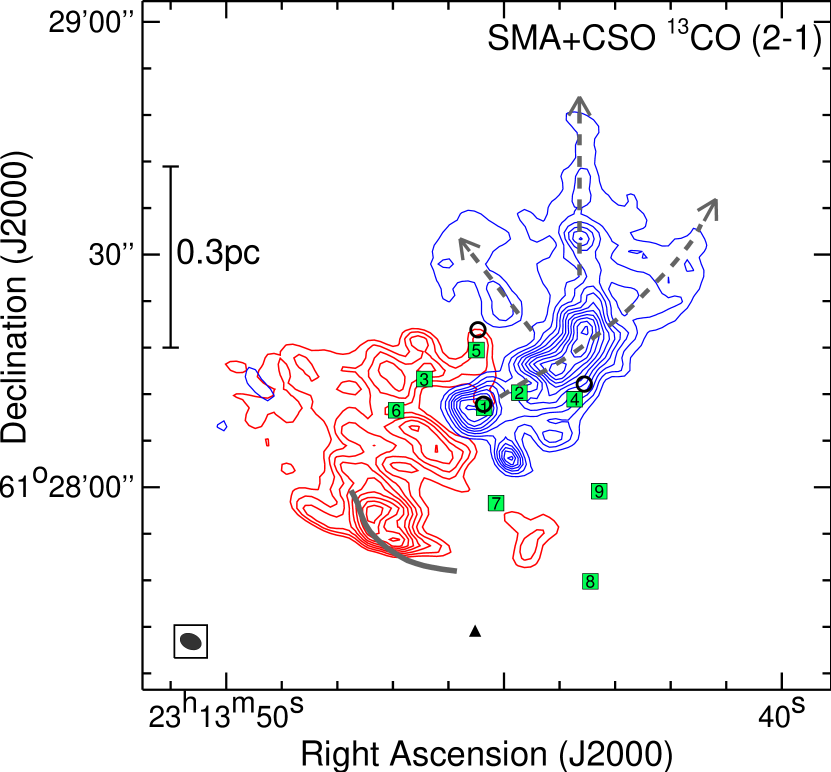
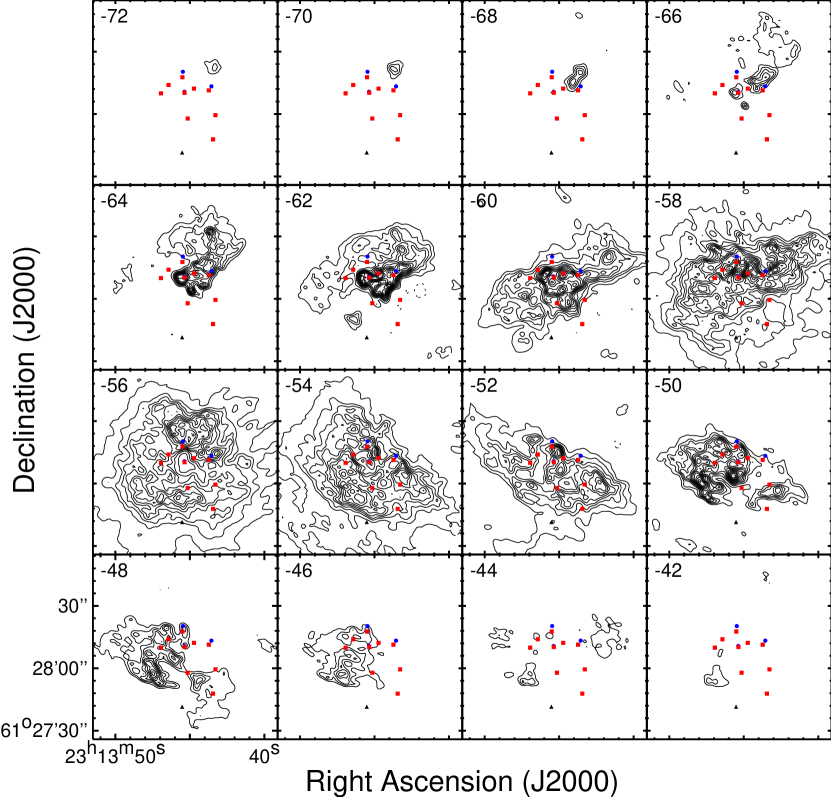
Figures 4 and 5 show the velocity integrated and channel maps, respectively, of the 13CO (2–1) emission, obtained from the combined SMA and CSO data. In general the 13CO emission shows a morphology similar to that of the CO emission, but within a narrower velocity range. The MM1 NW-SE outflow appears more predominant in the 13CO emission. Although fainter, the PA and branches of the blueshifed emission are both identifiable. The redshifted emission of the MM7 outflow is clearly seen; in particular in the channel map of km s-1 it shows a bi-conical structure.
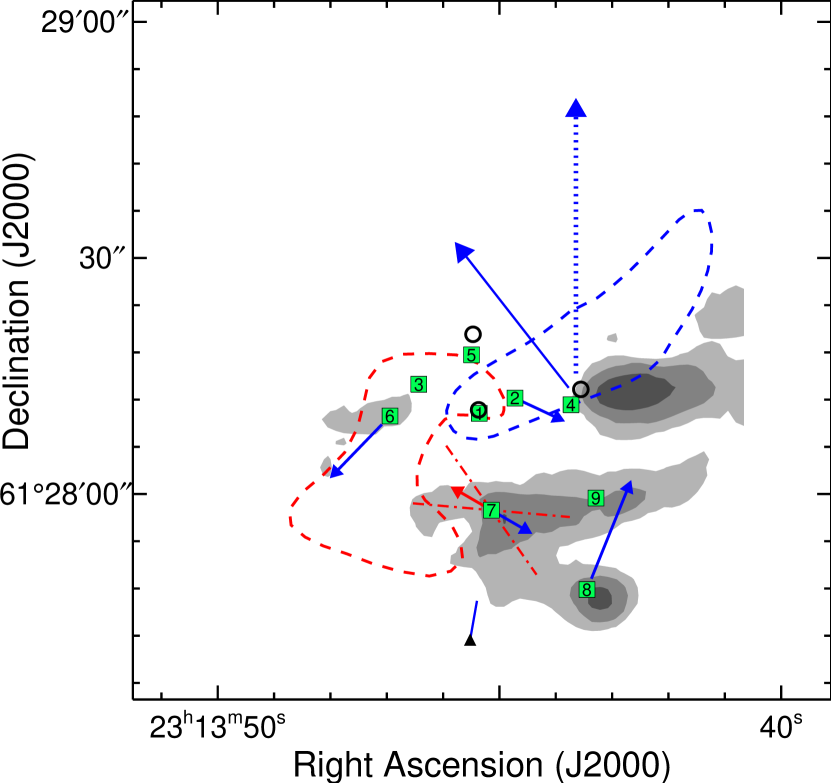
A schematic view of the multiple outflows detected here is shown in Figure 6, which presents a tentative anatomy of the complicated outflow structures seen in CO and 13CO (2–1). A more detailed discussion on the MM1 outflow is presented in Section 4.2.
Following Qiu et al. (2009), the outflow parameters, including the mass (), momentum (), energy (), dynamical timescale (), mass outflow rate () and momentum outflow rate (), are calculated. The optical depth effect as a function of velocity and spatial distribution is corrected by comparing the CO with 13CO fluxes and adopting a C-to-13C ratio of 79 (Wilson & Rood, 1994). The derived parameters are listed in Table 2. To avoid contamination from ambient diffuse gas, we conservatively calculate the mass of the outflowing gas at velocities of and km s-1, which are more than 6 km s-1 away from the systemic velocity of km s-1 (van der Tak et al., 2000). However, from Figure 3, the emission at and km s-1 has significant contribution from outflows. If we choose the lowest outflow velocities to be and km s-1, the gas mass amounts to 110 . Hence, the total outflow mass should be in the range of 50 to 100 .
3.3 High-density Tracing Molecular Lines
3.3.1 Emission and absorption toward MM1
MM1 shows molecular chemistry typical of a hot molecular core (HMC, Cesaroni, 2005; Beuther et al., 2009). Excluding CO and 13CO (2–1), around 70 lines arising from 15 molecular species are detected toward MM1 with peak fluxes above 6 (Table 3). Spatially unresolved emission from complex O-bearing molecules, e.g., methyl formate (CH3OCHO) and ethanol (C2H5OH), and N-bearing molecules, e.g., methyl cyanide (CH3CN) and isocyanic acid (HNCO), is clearly seen. In particular, the number of detected lines is largely dominated by O-bearing molecules, e.g., CH3OH, CH3OCHO, and C2H5OH.
The CH3CN emission is an excellent temperature and density probe (Araya et al., 2005; Cesaroni, 2005). The CH3CN lines detected in MM1 cover a wide range of upper level energies above the ground state, (69–526 K). Following Qiu & Zhang (2009), we perform a simultaneous fitting to all the detected components of the CH3CN (12–11) emission, where the temperature, column density, and source size are determined by means of grid search -square minimization. In Figure 7, the best fit model agrees very well with the observation, and yields a temperature of 245 K, a column density of 51016 cm-2, and a source size of 1450 AU. As the fitting is highly nonlinear, uncertainties are determined from a Monte Carlo analysis accounting for the 1 noise and the 10% uncertainty of flux calibration. Compared to the rotation diagram method, the fitting improves the parameter derivation by solving for the optical depths (Goldsmith & Langer, 1999), which range from 0.16 for the =8 line to 2.99 for the =3 line in the best fit model. The fitting, however, simply assumes uniform gas. Density and temperature gradients certainly exist in a gas and dust envelope surrounding a (proto)star (e.g., Scoville & Kwan, 1976; Osorio et al., 2009). The best fit model thus represents a characteristic estimate. The beam-averaged CH3CN column density, 31015 cm-2, can be compared to the H2 column density (1.41024 cm-2, derived from the dust continuum peak) for an estimate of the CH3CN abundance, which is 2.1, in agreement with typical values of – measured in other HMCs (e.g., Hatchell et al., 1998; Chen et al., 2006; Zhang et al., 2007). Finally, the C2H5OH (131,13–120,12) (=220601.93 MHz) line in Figure 7 is often identified as CH313CN (123–113) (=220599.98 MHz) in the literature, which would imply a CH3CN (123–113) optical depth of 42, abnormally high for such a high-density and warm gas tracer. If the optical depths were that high the low components of the CH3CN (12–11) emission would be entirely optically thick and show flattened line peaks; this clearly disagrees with the observed spectra. Here we believe the emission arising from C2H5OH (131,13–120,12).
A secondary emission feature around 50 km s-1 is seen in Nitrogen- and Sulfur-bearing species, i.e., CH3CN, HNCO, OCS, SO, and SO2. The feature is not detected () in lines of HCO, CH3OH, or any other large O-bearing molecules. The emission is probably arising from an interaction between the outflowing material and a clump residing in the far side of the central young O star. The lines in Nitrogen- and Sulfur-bearing species could be related to shock-induced chemistry, while the deficiency in lines of CH3OH, HCO, and larger O-bearing molecules could be due to an initially low abundance of the “key” species CH3OH and H2CO for the clump (e.g., Charnley et al., 1992). The existing observations cannot shed further light on this issue.
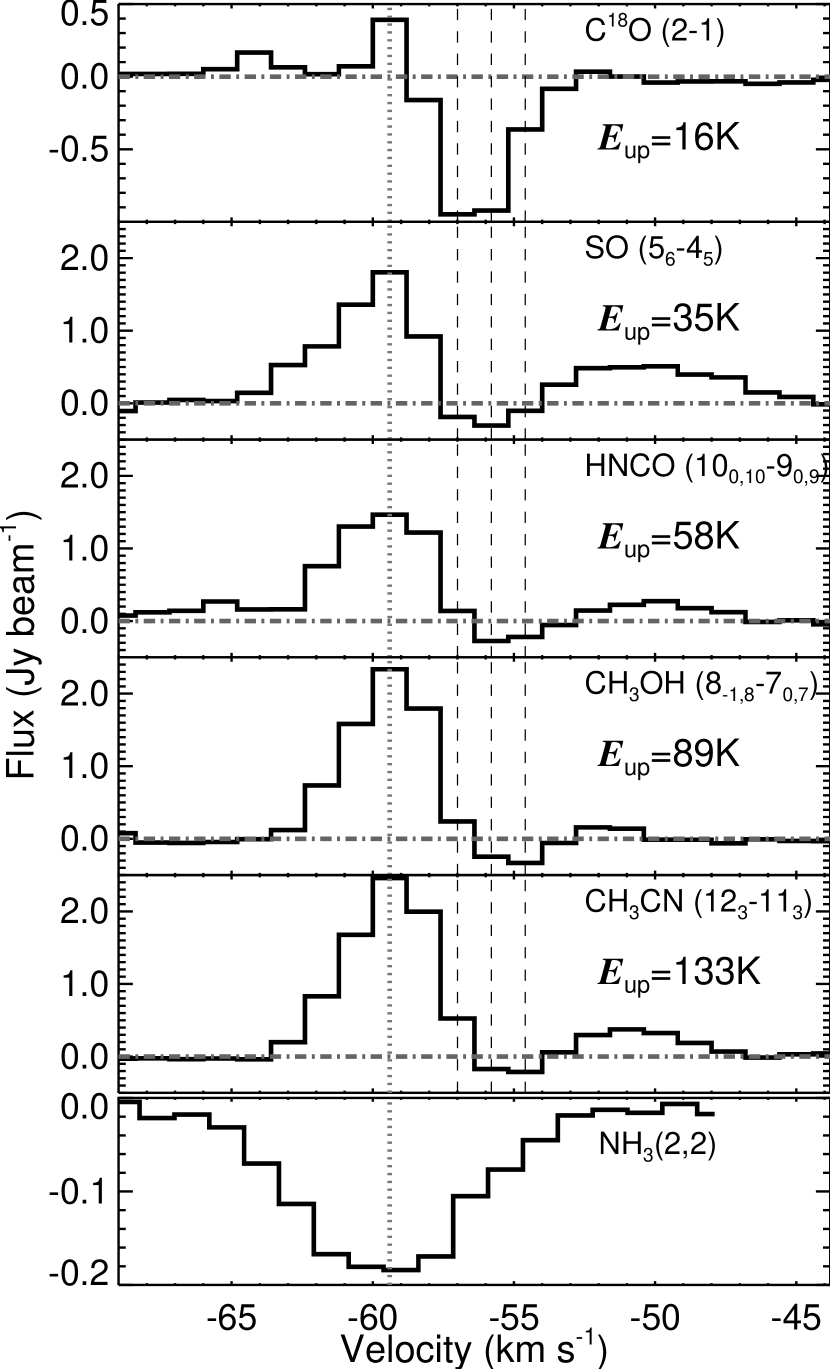
Thought to be a probe of inward motion of dense gas surrounding a forming star, molecular lines with redshifted absorption observed at high-angular-resolutions have been reported in a very few high-mass star-forming cores (e.g., Zhang et al., 1997; Beltrán et al., 2006). Toward MM1, an inverse P-Cygni profile with redshifted absorption () is seen in lines of C18O (2–1), SO (56–45), HNCO (100,10–90,9), CH3OH (8-1,8–7) and (80,8–7), and CH3CN (12–11) =2,3 (see, e.g., Figure 8). In these lines, the absorption comes from dense gas lying on the near side of the central continuum source, absorbing bright continuum emission and moving toward the source (away from the observer). Meanwhile, the emission is attributed to dense gas residing on the far side of the central source and moving toward the observer; within a beam, dense gas with velocities largely along the plane of sky (i.e., orthogonal to the line of sight) can contribute to the emission as well. The lines showing redshifted absorption have spanning a range of 16–133 K. Roughly speaking, the absorption in lines of higher excitation (e.g., the CH3OH and CH3CN lines) may trace inner, warmer gas with velocities mostly along the line of sight, hence appears more biased toward redshifted velocities. In addition, analytical models of a dense core under self-similar gravitational collapse shows that the infall velocity scales with the radius as (Larson, 1972; Shu, 1977), which may partly contribute to the redward shift of the absorption in lines of higher . Assuming the collapse proceeds in a spherical geometry, the accretion rate can be estimated following , where is the mass accretion rate, the radius of the infalling envelope, the mass density, and the infall velocity. From the dust continuum peak the H2 number density is about cm-3 averaged over AU. The measured infall velocity is about 2.5 km s-1. As an order-of-magnitude estimate, amounts to . However, the accretion may considerably deviate from a spherical geometry, in particular for the inner part closely surrounding the central source. The free-free emission in IRS 1 shows a double-lobed morphology at the center, suggesting that the accretion proceeds along a flattened structure perpendicular to the ionized gas elongation. If the collapse occurs inside a solid angle , scales to .
3.3.2 Emission from new cores MM2 to MM9
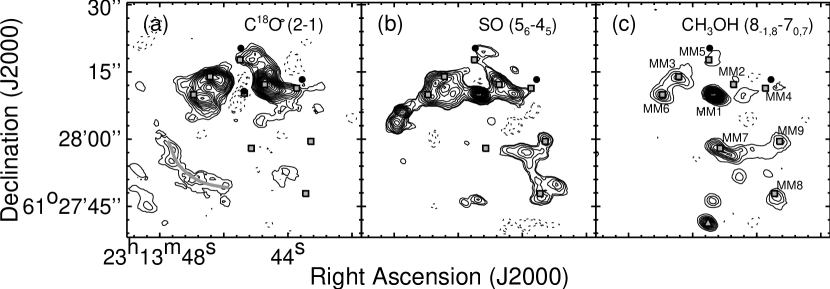
In addition to MM1, the dust continuum map reveals eight new cores, MM2–9. The C18O (2–1), SO (56–45), and CH3OH (8-1,8–70,7) E lines show emission from part of these new cores and extended structures, and are not significantly affected by outflows or ambient diffuse gas. Figure 9 shows moment-0 (velocity averaged) maps of these lines.
The C18O (2–1) emission is dominated by two dense clumps residing on both sides of an absorption feature around MM1: the western clump peaks at MM2 and shows extension from MM5 to MM4; the eastern clump encompasses MM3 and MM6. While MM2 coincides with the brightest C18O peak, cores MM3–6 are more or less offset from local C18O peaks. Another interesting feature in C18O is a C-shaped shell seen in the southeast of the mm cores. In comparison with the CO and 13CO (2–1) emission, the C18O shell lies immediately ahead of the brightest and furthest CO/13CO clump in the redshifted outflow (see Figure 2 and Figure 4). This suggests that the C-shaped structure forms from ambient gas which is compressed by the outflow from MM1.
Apart from emission and absorption toward MM1, the SO (56–45) map shows bright emission around MM2, MM3, MM6, MM8, MM9, as well as faint extensions toward MM4 and MM5. The SO map also shows clumps without a counterpart in the dust continuum; for example, two bright clumps to the southeast of MM6 are not seen in dust continuum or any other line. It is unclear whether the SO emission in the two clumps is associated with the MM6 outflow or arising from protostellar cores whose dust continuum is below the detection limit of our SMA observation.
Compared to C18O (2–1) and SO (56–45), the CH3OH (8-1,8–70,7) E line has a considerably higher (89 K) and appears to trace more compact structures. In addition to MM1, cores MM3, MM6, MM7, MM8, and MM9 are clearly detected in this line. The CH3OH peaks approximately coincide with the dust continuum peaks, indicating the presence of internal heating within each of the detected cores. Relatively faint emission associated with MM5 is detected as well.
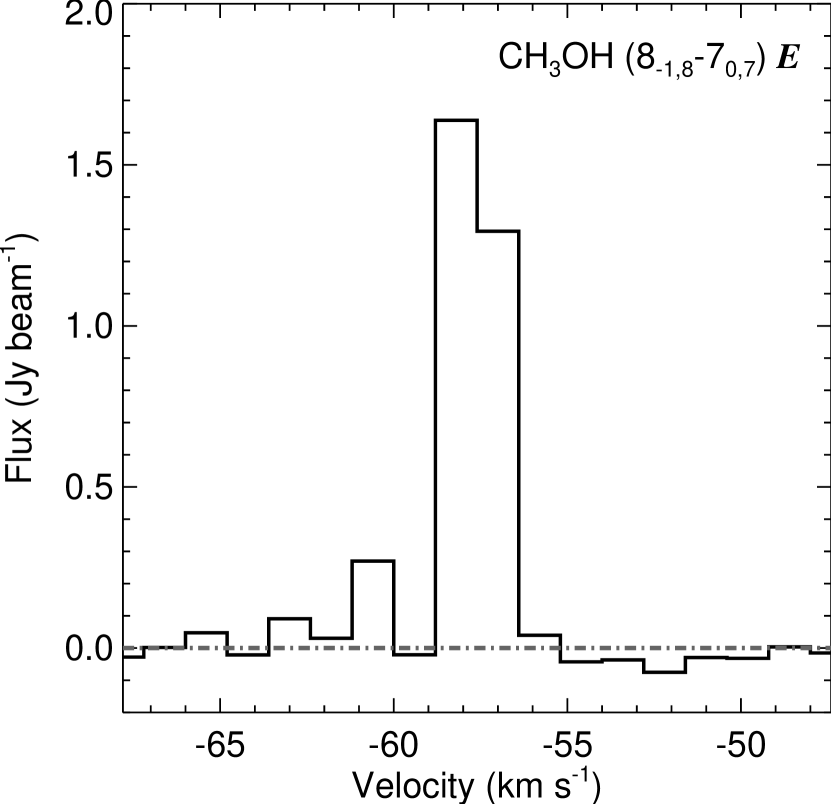
A serendipitous discovery from the CH3OH (8-1,8–70,7) E map is a new 229.8 GHz maser at (R.A., decl.), which is seen as unresolved and bright emission with a peak flux of 1.64 Jy beam-1 and a narrow line width of less than 2 km s-1 (Figure 9c and Figure 10). It is difficult to assess whether this maser spot is associated with any of the mm continuum sources which are more than 0.2 pc away. Another possibility is that the maser is associated with a compact CH3OH (8-1,8–70,7) E and SO (56–45) clump about 5′′ to the north. The clump probably traces a low- to intermediate-mass protostellar core whose 1.3 mm dust emission is below the detection limit of our SMA observation. More interestingly, the maser spot lies right at the tip of a compact CO outflow (Figure 2), suggesting that the masing line is pumped by the outflow shocks, which is consistent with the class I property of the transition. There has been very few report on the detection of 229.8 GHz methanol maser (Slysh et al., 2002; Qiu & Zhang, 2009), probably because of its high frequency hence not covered by previous methanol maser surveys.
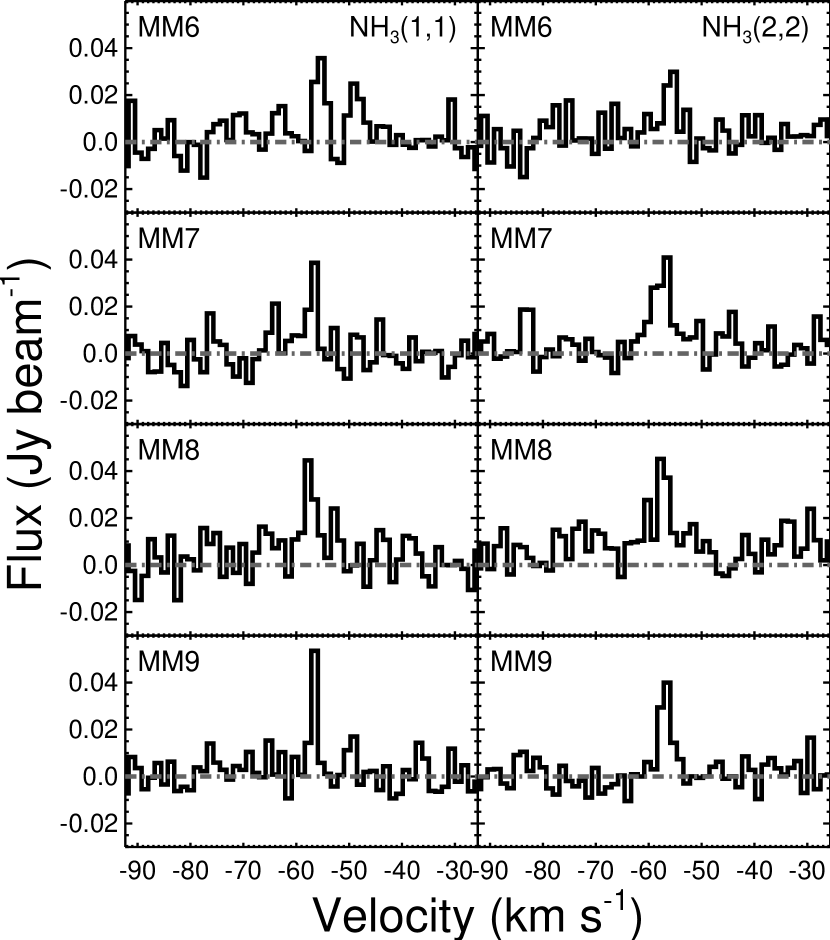
In the VLA NH3 (1,1) and (2,2) data taken by Zheng et al. (2001), emission in MM6–9 is clearly seen in both transitions (see Figure 11), while an investigation of emission in MM2–5 is severely affected by predominant absorption arising from MM1. As there is no clear detection of a satellite line in Figure 11, we assume the emission to be optically thin, and deduce rotational temperatures, , from the intensity ratio of the two transitions following where and are the brightness temperatures of the main hyperfine components of the NH3 (1,1) and (2,2) transitions, respectively (Ho & Townes, 1983); the formula assumes equal line width for the two transitions, which is probably a good approximation but difficult to verify given the moderate sensitivity and spectral resolution. We obtain of , , , and K for MM6–9, respectively; the uncertainties account for the noise of the spectra. Correcting for the depopulation effect (Danby et al., 1988), we estimate the kinetic temperatures from to be 43, 58, 54, and 38 K for MM6–9, respectively.
4 Discussion
4.1 Nature of the MM1 core
The MM1 core has a size of about 0.05 pc, an H2 number density of order cm-3, a characteristic temperature of 245 K, and rich chemistry in complex organic molecules. All these indicate that MM1 is a typical HMC. On the other hand, the presence of bright IR and radio emission suggests that the core is at a relatively more evolved stage compared to many other HMCs (e.g., Chen et al., 2006; Zhang et al., 2007; Girart et al., 2009; Qiu & Zhang, 2009). The core also shows particularly rich chemistry in large O-bearing molecules (e.g., CH3OCHO and C2H5OH), consistent with a relatively more evolved stage.
According to stellar structure models of Schaller et al. (1992), the central young star embedded within MM1 has a mass of . Redshifted absorption seen in several lines toward MM1 implies the presence of an accretion flow onto the central star or star-disk system which may further increase the mass of the young O star. The 20 core, however, is not equivalent to the gas reservoir of the accretion. On the one hand, Myers (2009) found that clustered and high-density regions form high-mass protostars from both core and environment gas. There are also claims that the accretion onto a forming O star may be fed by global infall of the parent cloud (e.g., Galván-Madrid et al., 2009). For NGC 7538 IRS 1, it is unclear whether there is a global infall pertaining to the accretion. Previous NH3 (1,1), (2,2) observations revealed blueshifted absorption toward IRS 1 (Wilson et al., 1983; Henkel et al., 1984; Keto, 1991, also see Figure 8), which is attributed to expanding or outflowing gas moving toward the observer. The NH3 absorption is optically thick (, Henkel et al. 1984; Keto 1991), presumably tracing gas mostly residing in outer layers surrounding the HMC. Thus the bulk of the outer gas appears to be in an outward motion. On the other hand, various mechanisms, e.g., outflows, heating and ionization, and accretion by nearby protostars, can disperse dense gas and conspire to terminate the accretion (Myers, 2009). In particular, Keto (2007) described a three-stage evolutionary sequence of an HII region around a massive young star. In his model, the dynamics and morphology of the ionized gas are determined by the ratio of the ionization radius, , and the gravitational radius, , defined by , where is the mass of the star and is the sound speed. With and km s-1 (for ionized gas temperature of K), is 110 AU. The innermost ionized gas around IRS 1 has a radius of 500 AU (Campbell, 1984; Gaume et al., 1995; Sandell et al., 2009). Thus, for IRS 1, , corresponding to the second to third stages in Keto’s model, that is, the ionized gas moves outward and progressively expands toward the equatorial plane. In this picture the accretion is confined to a narrow range of angle around the disk and is close to termination.
4.2 The MM1/IRS 1 outflow
Multiple outflows are seen in the CO and 13CO maps. However, the bulk outflowing gas is centered at the brightest core MM1 which harbors the IRS 1 young O star. As outlined in Figure 6, the blueshifted lobe of the MM1 outflow is dominated by a slightly curved filament with a PA of about . In sub-arcsec resolution observations, an elongated feature with an orientation similar to that of the CO/13CO filament is seen in radio continuum (, Campbell, 1984; Gaume et al., 1995; Sandell & Sievers, 2004) and mid-IR emission (, De Buizer & Minier, 2005). The 0.5 pc structure seen in CO and 13CO (2–1) can be traced back to about (500 AU) from the central source; within , the ionized gas shows a double-lobed morphology in a north-south orientation. In addition, near-IR observations toward IRS 1 reveals a fan-shaped structure (opening angle ) extending from IRS 1 to the northwest (, Kraus et al., 2006). On a larger scale, the CO/13CO filament is seen projected against a dense clump revealed by the NH3 emission (see Figure 6). The most likely scenario capable of incorporating the inner ionized gas with a north-south orientation and the northwestern structure extending from 500 AU to 0.5 pc from the central source seems to be a wide-angle wind from IRS 1 which carves an outflow cavity. The axis of the wide-angle wind is mostly along the north-south orientation and slightly inclined to the west. The northwestern structure observed in radio, mid-IR, and in CO and 13CO (2–1) emission traces the western wall of the outflow cavity. The lack of appreciable emission from the eastern wall is likely ascribed to the deficiency of dense gas to the northeast of IRS 1 (e.g., Zheng et al., 2001). Indeed, from a close inspection of the ionized gas and hot dust immediately around IRS 1, faint extension to the northeast does exist as well (Figure 2 in Campbell 1984; Figure 1b in Gaume et al. 1995; Figure 2b in De Buizer & Minier 2005). The CO/13CO structure originating from the vicinity of IRS 3 and MM4 and extending to the north (PA0∘) is puzzling; in Figure 2 and Figure 4, the structure seems to be part of the MM1 outflow but with an orientation very different from the inner part (i.e., the PA of the outflow varying from to ). In dust continuum or NH3 maps of the region (Zheng et al., 2001; Sandell & Sievers, 2004; Reid & Wilson, 2005; Pestalozzi et al., 2006), there appears to be no dense gas immediately to the west of the structure, excluding the possibility of being confined by ambient dense gas. From Figure 6, the wide-angle wind seems to be expanding into an ambient dense clump seen in NH3 and as a consequence of this interaction, part of the gas is deflected to the north, forming the PA0∘ structure. However, with the existing data it cannot be ruled out that the structure is associated with IRS 3 or MM4.
It is not straightforward either to unambiguously identify and interpret the redshifted lobe of the MM1 outflow. In the wide-angle wind scenario proposed above, the structure mostly consists of ambient gas being entrained or swept up by the wide-angle wind and tracing the eastern wall of the southern outflow cavity. The slightly distorted appearance of the structure could be partly caused by interaction with other outflows (e.g., the MM7 outflow). An interesting feature is the C-shaped shell seen in C18O. It lies ahead of the furthest and brightest CO/13CO clump and features dense gas being compressed by part of the leading front of the wide-angle wind. It is puzzling that the western wall of the southern outflow cavity is unseen in CO or 13CO, as at least in projection dense gas to the southwest of MM1 is seen in NH3 and dust continuum. One possibility is that in a three-dimensional picture the southern lobe of the wide-angle wind is expanding into a medium without dense gas in the west and cannot produce appreciable emission.
Hollenbach et al. (1994) studied the photoevaporation of disks around massive young stars and developed a model of the photoevaporative wind from the disk. Lugo et al. (2004) performed a parametric investigation of such a wind in NGC 7538 IRS 1 by modeling the free-free emission as arising from the wind and found a mass-loss rate of yr-1. As the speed of the photoevaporative wind is 10–50 km s-1 (Hollenbach et al., 1994), comparable to that of CO outflows, the mass loss rate of the wind seems too low to drive the NGC 7538 IRS 1 outflow, whose mass loss rate is of order yr-1 (Table 2). The photoevaporative wind may play a role in driving the IRS 1 molecular outflow, however, the large amount of gas mass, momentum, and energy in outflowing gas requires a more energetic wind as its driving engine. In a momentum-driven picture (working like a snow-plow), a fast, 1000 km s-1 wind with a mass loss rate of yr-1 is able to drive the observed molecular outflow; in an energy-driven situation (working by ram pressure), the required mass loss rate is much lower, i.e., yr-1, provided the wind speed reaches 1000 km s-1. Stellar winds from O stars and possible accretion-driven winds (e.g., a high-mass analogue of X-winds in low-mass protostars) are expected to have velocities reaching 1000 km s-1, and energy-wise, are likely to drive the massive and energetic molecular outflow.
4.3 A massive cluster in the making
In single-dish submm and mm continuum maps of the NGC 7538 complex, the most remarkable cloud has a size of about 1 pc and slightly extends to the southeast (Sandell & Sievers, 2004; Reid & Wilson, 2005; Pestalozzi et al., 2006). Star formation activity within this cloud has long been thought to be concentrated around IRS 1–3, and IRS 1 is the source that attracted most of the interest. Our SMA 1.3 mm continuum observation uncovers a total of nine cores with a spatial distribution roughly following the shape of the cloud. Apart from MM1, which harbors the IRS 1 young O star, cores MM2–9 are new detections. The detection of these dusty cores is interesting in the context of cloud fragmentation and cluster formation.
For MM1, with a number density of cm-3 (averaged within a beam and assuming a spherical geometry) and a temperature of 245 K, one derives a thermal Jeans mass () of 17 , which is comparable to the measured core mass and compatible with the scenario that heating from the forming star may have helped to suppress fragmentation of the envelope (e.g., Krumholz, 2006; Krumholz & McKee, 2008). However, all the new cores are very young, apparently lacking significant heating. These cores are not detected in CH3CN, and only part of them are seen in one transition of CH3OH (see Figure 9). For MM6–9, the NH3 data reveal temperatures of order 50 K (Section 3.3.2). For MM2–5, a rough upper limit may be obtained based on the absence of CH3CN emission, which is a typical thermometer of HMCs. For example, cores MM2–5 have masses close to MM1; if the abundance ratio and spatial distribution of CH3CN in MM2–5 resembles that in MM1, at a temperature of 100 K, the brightness temperature (averaged within a beam of ) of the CH3CN (12–11) =0–3 emission in MM2–5 would be about 2–4 K, which could have been detected at a level. Alternatively, with the CH3CN (12–11) -ladder observed with the SMA, Qiu & Zhang (2009) derived a temperature of 110 K for a HMC in the HH 80-81 massive star-forming region; if the HH 80-81 HMC were at a distance of 2.65 kpc and observed with a beam, the brightness temperature of the =0,1 components would have been around 1 K; cores MM2–5 in NGC 7538 have masses comparable to that of the HH 80–81 HMC, while the CH3CN emission is not detected ( K). All this indicates that MM2–5 have temperatures well below 100 K. Sandell & Sievers (2004) found a dust temperature of 40 K for submm condensations around IRS 1. This probably provides a rough estimate of the averaged temperature of MM2–9, as part of them roughly coincide with the submm condensations.
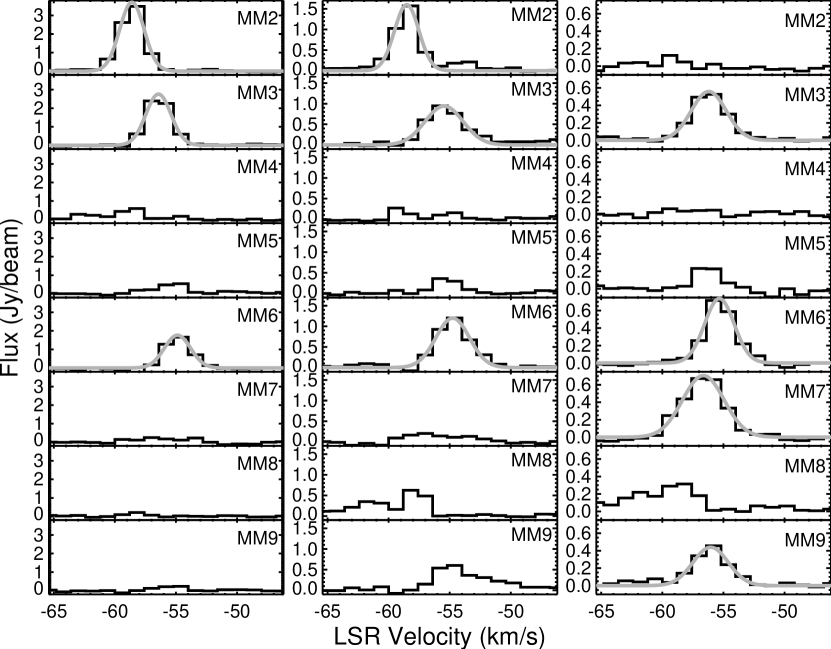
MM2–9 have number densities of – cm-3, or mass column densities g cm-2, matching a proposed threshold of 1 g cm-2 for molecular clouds capable of avoiding fragmentation and forming massive stars (Krumholz & McKee, 2008). But the masses of the new cores are well above , implying the importance of supersonic turbulence and/or magnetic field in cloud fragmentation and possible star formation within the new cores (e.g., Zhang et al., 2009). While an investigation of the magnetic field awaits new observations, a glimpse of turbulence can be obtained by looking into the emission lines arising from these cores. Figure 12 shows spectra in C18O (2–1), SO (56–45), and CH3OH (8-1,8–70,7) E at the peaks of MM2–9. A gaussian fitting is performed on lines with sufficient signal-to-noise ratios. The derived line widths of 2.5–4 km s-1 are more than 5 times larger than the thermal line width. This strongly suggests the presence of supersonic turbulence which may play an important role in suppressing fragmentation, if the line widths are not dominated by kinematics related to star formation processes (e.g., outflow, infall, and rotation).
Information on potential ongoing star formation within the new cores can be obtained from their associations with CO outflows, H2O masers, and warm and dense gas condensations. Cores MM2, MM3, MM4, and MM7 are all associated with H2O maser emission (Figure 1), indicative of active star formation. Cores MM2, MM6, MM7, MM8, and probably MM4 as well, are associated with CO outflows (Figure 6 and Section 3.2), implying the presence of protostars within these cores. MM9 shows the faintest dust continuum; although lacking apparent association with an outflow or H2O maser spot, it is very likely internally heated by an intermediate-mass protostar as it shows centrally peaked emission in CH3OH and SO (Figure 9). There is no clear signature of star formation toward MM5, which also shows a relatively flattened profile in dust emission. It is more likely a gas and dust clump externally heated by IRS 2 (probably through a stellar-wind bow shock, Bloomer et al., 1998), rather than an internally heated star-forming core. In short, seven out of the eight new cores appear to be forming stars. The star-forming cores have masses of –24 and high densities, and most of them show bright, centrally peaked CH3OH emission. Although CH3OH lines are seen in hot corinos (warm and dense envelopes around low-mass protostars, Ceccarelli et al., 2007), the emission could not be detected if the hot corinos were at distances kpc as compared to the case of IRAS 16293-2422 (van Dishoeck et al., 1995; Kuan et al., 2004; Chandler et al., 2005). Thus, the new cores seen in CH3OH are expected to be forming intermediate- to high-mass stars. MM4 is not detected in CH3OH and its immediate northwest is deficient of emission in C18O and SO; molecular line emission from this core is probably hampered by UV radiation from IRS 3, which has begun to ionize the surrounding and is not heavily obscured by a dusty cocoon. MM2 is the most massive of the new cores and coincides with the brightest C18O peak, but is not seen in CH3OH. With a relatively low (16 K), the C18O (2–1) emission preferentially traces column density enhancements rather than temperature increase (e.g., Wyrowski et al., 1999). The CH3OH (8-1,8–7) emission (with a much higher of 89 K) is more sensitive to the heating. Therefore, MM2 is presumably the youngest of the new star-forming cores.
The NGC 7538 molecular complex has been thought to exhibit sequential massive star formation propagating from northwest to southeast (Elmegreen & Lada, 1977; Werner et al., 1979). In this picture, the IRS 1–3 region lies ahead of the ionization front of the optical HII region and represents an intermediate evolutionary phase between the ionizing stars of the HII region in the northwest and deeply embedded massive protostars in the southeast (i.e., NGC 7538 S and IRS 9, Werner et al., 1979). By zooming in the parent cloud of IRS 1–3, our SMA observations provide new insights into this scenario. With the newly discovered star-forming cores, the IRS 1 young O star is not only accompanied by more evolved sources IRS 2 and IRS 3, but also surrounded by a group of intermediate- to high-mass protostars distributed over the parent cloud. There is no pronounced propagation of star formation across the cloud. In comparison with massive protostars in IRS 9 or NGC 7538 S, IRS 1–3 are certainly more evolved, but all the newly discovered star-forming cores are at very young evolutionary stages. In particular MM2, which is the closest to MM1, is apparently younger than IRS 9, which is visible in the near- to mid-IR (Werner et al., 1979), and even younger than NGC 7538 S, which shows bright CH3CN emission (Sandell & Wright, 2010). The pc-sized cloud appears to be in an active phase of cluster formation, with around 10 OB-type stars and probably orders of magnitude more low-mass stars according to a typical IMF (initial mass function, e.g., Salpeter, 1955; Kroupa, 2002). Indeed, within the volume occupied by high- and intermediate-mass protostars described above, Kraus et al. (2006) in their 2.2 m speckle images found a number of weak, compact sources. It is interesting to speculate that these are already more evolved lower mass members of the same forming star cluster of which IRS 1–3 and the new protostars (MM2–4 and MM6–9) define the higher mass end of the mass distribution. Here, a comparison with the well-studied Orion Nebular Cluster (ONC) is instructive. As argued by Palla & Stahler (1999) and Huff & Stahler (2006), the highest mass ONC member stars comprising the “Trapezium” at the center of the cluster are yr old, while the bulk of the lower mass cluster members formed 1–3 million years ago. In fact, one may consider IRS 1–3, MM2–4 and MM6 to be a Trapezium system in formation. The maximal physical separation between these objects, 0.30 pc, is much larger than the maximal separation between members of the ONC Trapezium, 0.047 pc, i.e., between Ori D and Ori E, assuming a distance of 417 pc to the ONC (Menten et al., 2007). It is, however, well within the range of other Trapezium-type systems. A Trapezium-type system, as defined by Ambartsumian (1954; 1955; 1958), of which Ori is the prototype, is a multiple star whose separations are all roughly of the same order of magnitude. While their cosmogonic role is somewhat unclear, it is a well-established fact that such systems are frequently found as the highest mass systems at the centers of clusters of lower mass stars (Sharpless, 1954). A catalog of 87 Trapezia with maximum separations, , within 0.2 pc was published by Salukvadze (1978), while Salukvadze & Dzhavakhishvili (1988) reported 15 wider systems with between 1.1 and 5.7 pc. Thus the dimensions of the nascent NGC 7538 IRS 1 Trapezium are well comparable to values generally found for such systems.
5 Summary
We present a 2–3′′ resolution study in the 1.3 mm waveband of the well-known massive star-forming region NGC 7538 IRS 1–3. The gas and dust core MM1, which harbors the IRS 1 young O star, is massive ( ), hot ( K), and shows bright line emission in complex organic molecules. Redshifted absorption seen in several high-density tracing lines indicates that the central young O star or star-disk system is still accreting gas from MM1. In comparison with a theoretical model on early evolution of HII regions (Keto, 2007), the accretion seems to be confined to a narrow range of angle about the equatorial plane.
Neither of the two nearby sources IRS 2 and IRS 3 is associated with a dense dusty envelope, confirming that the two luminous sources are at most moderately obscured.
Sensitive and high-angular-resolution observations also reveal eight new cores MM2–9 embedded within the parent cloud of IRS 1–3. These cores have masses much larger than the thermal Jeans mass, indicating the importance of turbulence and/or magnetic field in cloud fragmentation. The cores are seen in one or more of the C18O (2–1), SO (–), and CH3OH (–) E lines; the line widths are significantly larger than the thermal line width, attributed to supersonic turbulence and/or kinematics related to ongoing star formation. Seven out of the eight cores appear to be forming intermediate- to high-mass stars, of which the most massive ones appear to be members of a nascent Trapezium system. Characterized by the deeply embedded young O star IRS 1, two moderately obscured sources IRS 2 and IRS 3, and seven new intermediate- to high-mass protostellar cores, and taking into account presumably more unseen low-mass (proto)stars, a massive cluster is forming from a pc-sized cloud exposed to the ionization front of an optical HII region.
The CO and 13CO maps obtained from the combined SMA and single-dish data reveals an outflow scenario far more complicated than a bipolar outflow seen in single-dish observations. Multiple outflows are seen, and the MM1/IRS 1 outflow is dominating the mass of 50 , momentum of km s-1, and energy of erg calculated for the gas moving at velocities of km s-1 and km s-1. Comparing our CO, 13CO maps with the existing radio and IR observations we suggest that the MM1/IRS 1 molecular outflow is likely driven by a wide-angle wind from the forming O star or star-disk system, and the wind is expanding into a medium with inhomogeneous density distribution, creating asymmetric and curved structures seen in CO/13CO.
References
- Ambartsumian (1954) Ambartsumian, V. A. 1954, Memoires of the Societe Royale des Sciences de Liege, 1, 293
- Ambartsumian (1955) Ambartsumian, V. A. 1955, The Observatory, 75, 72
- Ambartsumian (1958) Ambartsumian, V. A. 1958, Reviews of Modern Physics, 30, 944
- Araya et al. (2005) Araya, E., Hofner, P., Kurtz, S., Bronfman, L., & DeDeo, S. 2005, ApJS, 157, 279
- Akabane & Kuno (2005) Akabane, K. & Kuno, N. 2005, A&A, 431, 183
- Beltrán et al. (2006) Beltrán, M. T., Cesaroni, R., Codella, C., Testi, L., Furuya, R. S., & Olmi, L. 2006, Nature, 443, 427
- Beuther et al. (2009) Beuther, H., Zhang, Q., Bergin, E. A., & Sridharan, T. K. 2009, AJ, 137, 406
- Bloomer et al. (1998) Bloomer, J. D. et al. 1998, ApJ, 506, 727
- Campbell (1984) Campbell, B. 1984, ApJ, 282, L27
- Campbell & Thompson (1984) Campbell, B. & Thompson R. I. 1984, ApJ, 279, 650
- Ceccarelli et al. (2007) Ceccarelli, C., Caselli, P., Herbst, E., Tielens, A. G. G. M., & Caux, E. 2007, in Protostars and Planets V, ed. V. B. Reipurth et al. (Tuscon, AZ: Univ. Arizona Press), 47
- Cesaroni (2005) Cesaroni, R. 2005, in IAU Symp. Ser. 227, Massive Star Birth: A Crossroads of Astrophysics, ed. R. Cesaroni et al. (Cambridge: Cambridge Univ. Press), 59
- Chandler et al. (2005) Chandler, C. J., Brogan, C. L., Shirley, Y. L., & Loinard, L. 2005, ApJ, 632, 371
- Charnley et al. (1992) Charnley, S. B., Tielens, A. G. G. M., & Millar, T. J. 1992, ApJ, 399, L71
- Chen et al. (2006) Chen, H.-R., Welch, W. J., Wilner, D. J., & Sutton, E. C. 2006, ApJ, 639, 975
- Danby et al. (1988) Danby, G., Flower, D. R., Valiron, P., Schilke, P., & Walmsley, C. M. 1988, MNRAS, 235, 229
- Davis et al. (1998) Davis, C. J., Moriarty-Schieven, G. Eislöffel, J., Hoare, M., & Ray, T. P. 1998, AJ, 115, 1118
- De Buizer & Minier (2005) De Buizer, J. M. & Minier, V. 2005, ApJ, 628, L151
- Elmegreen & Lada (1977) Elmegreen, B. & C. J. Lada, 1977, ApJ, 214, 725
- Galván-Madrid et al. (2009) Galván-Madrid, R., Keto, E., Zhang, Q., Kurtz, S., Rodríguez, L. F, & Ho, P. T. P. 2009, ApJ, 706, 1036
- Franco-Hernández & Rodríguez (2004) Franco-Hernández, R. & Rodríguez, L. F. 2004, ApJ, 604, L105
- Gaume et al. (1995) Gaume, R. A., Goss, W. M., Dickel, H. R. Wilson, T. L., & Johnston, K. J. 1995, ApJ, 438, 776
- Girart et al. (2009) Girart, J. M., Beltrán, M. T., Zhang, Q., Rao, R., & Estalella, R. 2009, Science, 324, 1408
- Goldsmith & Langer (1999) Glodsmith, P. F. & Langer, W. D. 1999, ApJ, 517, 209
- Hatchell et al. (1998) Hatchell, J., Thompson, M. A., Millar, T. J., & MacDonald, G. H. 1998, A&AS, 133, 29
- Henkel et al. (1984) Henkel, C., Wilson, T. L., & Johnston, K. J. 1984, ApJ, 282, L93
- Hildebrand (1983) Hildebrand, R. H. 1983, QJRAS, 24, 267
- Ho & Townes (1983) Ho, P. T. P. & Townes, C. H. 1983, ARA&A, 21, 239
- Hollenbach et al. (1994) Hollenbach, D., Johnstone, D., Lizano, S., & Shu, F. H. 1994, ApJ, 428, 654
- Huff & Stahler (2006) Huff, E. M. & Stahler, S. W. 2006, ApJ, 644, 355
- Lugo et al. (2004) Lugo, J., Lizano, S., & Garay, G. 2004, ApJ, 614, 807
- Kameya et al. (1989) Kameya, O., Hasegawa, T. I., Hirano, N., Takakubo, K., & Seki, M. 1989, ApJ, 339, 222
- Kameya et al. (1990) Kameya, O., Morita, K.-I., Kawabe, R., & Ishiguro, M. 1990, ApJ, 355, 562
- Keto (1991) Keto, E. 1991, ApJ, 371, 163
- Keto (2007) Keto, E. 2007, ApJ, 666, 976
- Keto et al. (2008) Keto, E., Zhang, Q., & Kurtz, S. 2008, ApJ, 672, 423
- Klaassen et al. (2009) Klaassen, P., D., Wilson, C., D., Keto, E. R., & Zhang, Q. 2009, ApJ, 703, 1308
- Kraus et al. (2006) Kraus, S. et al. 2006, A&A, 455, 521
- Kroupa (2002) Kroupa, P. 2002, Science, 295, 82
- Krumholz (2006) Krumholz, M. R. 2006, ApJ, 641, L45
- Krumholz & McKee (2008) Krumholz, M. R. & McKee, C. F. 2008, Nature, 451, 1082
- Kuan et al. (2004) Kuan, Y.-J. et al. 2004, ApJ, 616, L27
- Larson (1972) Larson, R. B. 1972, MNRAS, 157, 121
- Martin (1973) Martin, A. H. M. 1973, MNRAS, 163, 141
- Menten et al. (2007) Menten, K. M., Reid, M. J., Forbrich, J., & Brunthaler, A. 2007, A&A, 474, 515
- Moscadelli et al. (2009) Moscadelli, L., Reid, M. J., Menten, K. M., Brunthaler, A., Zheng, X. W., & Xu, Y. 2009, ApJ, 693, 406
- Myers (2009) Myers, P. C. 2009, ApJ, 706, 1341
- Osorio et al. (2009) Osorio, M., Anglada, G., Lizano, S., & D’Alessio, P. 2009, ApJ, 694, 29
- Ossenkopf & Henning (1994) Ossenkopf, V. & Henning, T. 1994, A&A, 291, 943
- Palla & Stahler (1999) Palla, F. & Stahler, S. W. 1999, ApJ, 525, 772
- Pestalozzi et al. (2004) Pestalozzi, M. R., Elitzur, M., Conway, E., & Booth, R. S. 2004, ApJ, 603, L113
- Pestalozzi et al. (2006) Pestalozzi, M. R., Minier, V., Motte, F., & Conway, J. E. 2006, A&A, 448, L57
- Pratap et al. (1989) Pratap, P., Batrla, W., & Snyder, L. E. 1989, ApJ, 341, 832
- Qiu & Zhang (2009) Qiu, K. & Zhang, Q. 2009, ApJ, 702, L66
- Qiu et al. (2009) Qiu, K., Zhang, Q., Wu, J., & Chen, H.-R. 2009, ApJ, 696, 66
- Reid & Wilson (2005) Reid, M. A. & Wilson, C. D. 2005, ApJ, 625, 891
- Salpeter (1955) Salpeter, E. E. 1955, ApJ, 121, 161
- Salukvadze (1978) Salukvadze, G. N. 1978, Astrophysics, 14, 30
- Salukvadze & Dzhavakhishvili (1988) Salukvadze, G. N. & Dzhavakhishvili, G. S. 1988, Ap&SS, 142, 79
- Sandell et al. (2009) Sandell, G., Goss, W. M., Wright, M., & Corder, S. 2009, ApJ, L31
- Sandell & Wright (2010) Sandell, G. & Wright, M 2010, ApJ, 715, 919
- Sandell & Sievers (2004) Sandell, G. & Sievers, A. 2004, ApJ, 600, 269
- Schaller et al. (1992) Schaller, G., Schaerer, D., Meynet, G., & Maeder, A. 1992, A&AS, 96, 269
- Scoville & Kwan (1976) Scoville, N. Z. & Kwan, J. 1976, ApJ, 206, 718
- Scoville et al. (1986) Scoville, N. Z., Sargent, A. I., Sanders, D. B., Claussen, M. J., Masson, C. R., Lo, K. Y., & Phillips, T. G. 1986, ApJ, 303, 416
- Sharpless (1954) Sharpless, S. 1954, ApJ, 119, 334
- Shu (1977) Shu, F. H. 1977, ApJ, 214, 488
- Slysh et al. (2002) Slysh, V. I., Kalenskii, S. V., & Val’Tts, I. E. 2002, Astron. Rep., 46, 49
- van der Tak et al. (2000) van der Tak, F. F. S., van Dishoeck, E. F., Evans II, N. J., & Blake, G. A. 2000, ApJ, 537, 283
- van Dishoeck et al. (1995) van Dishoeck, E. F., Blake, G. A., Jansen, D. J., & Groesbeck, T. D. 1995, ApJ, 447, 760
- Werner et al. (1979) Werner, M. W., Becklin, E. E., Gatley, I., Matthews, K., Neugebauer, G., & Wynn-Williams, C. G. 1979, MNRAS, 188, 463
- Wilson et al. (1983) Wilson, T. L., Mauersberger, R., Walmsley, C. M., & Batrla, W. 1983, A&A, 127, L19
- Wilson & Rood (1994) Wilson, T. L. & Rood, R. 1994, ARA&A, 32, 191
- Wynn-Williams et al. (1974) Wynn-Williams, C. G., Becklin, E. E., & Neugebauer, G. 1974, ApJ, 187, 473
- Wyrowski et al. (1999) Wyrowski, F., Schilke, P., Walmsley, M. C., & Menten, K. M. 1999, ApJ, L43
- Zheng et al. (2001) Zheng, X.-W., Zhang, Q., Ho, P. T. P., & Pratap, P. 2001, ApJ, 550, 301
- Zhang et al. (2007) Zhang, Q., Hunter, T. R., Beuther, H., Sridharan, T. K., Liu, S.-Y., Su, Y.-N., Chen, H.-R., & Chen, Y. 2007, ApJ, 658, 1152
- Zhang et al. (1997) Zhang, Q. & Ho, P. T. P. 1997, ApJ, 488, 241
- Zhang et al. (1995) Zhang, Q., Ho, P. T. P., Wright, M. C., & Wilner, D. J. 1995, ApJ, 451, L71
- Zhang et al. (2009) Zhang, Q., Wang, Y., Pillai, T., & Rathborne, J.2009 ApJ, 696, 268


| R.A. | Decl. | Peak Flux | Total Flux | MassaaCalculated with a dust opacity cm2 g-1, and temperatures of 245 K for MM1, 40 K for MM2–5, and 43, 58, 54, 38 K for MM6–9; see the discussion in Section 3.1 for details about the mass uncertainties. | |
|---|---|---|---|---|---|
| (J2000) | (J2000) | (Jy beam-1) | (Jy) | () | |
| MM1 | 3.3 | 3.6 | |||
| MM2 | 0.18 | 0.37 | |||
| MM3 | 0.17 | 0.31 | |||
| MM4 | 0.11 | 0.22 | |||
| MM5 | 0.11 | 0.30 | |||
| MM6 | 0.10 | 0.15 | |||
| MM7 | 0.082 | 0.12 | |||
| MM8 | 0.067 | 0.10 | |||
| MM9 | 0.049 | 0.088 |
| aaCalculated for outflowing gas at km s-1 and km s-1; | bbWithout correcting for an unknown inclination angle; this affects all the parameters except ; | ||||
|---|---|---|---|---|---|
| () | ( km s-1) | (erg) | (yr) | ( yr-1) | ( km s-1 yr-1 ) |
| 50 |
| FrequencybbRest frequencies obtained from the JPL catalog at http://spec.jpl.nasa.gov/ftp/pub/catalog/catform.html; | LineccQuantum numbers in parentheses denote degeneracy, for instance, HNCO – represents HNCO – and HNCO –; | PeakddDerived with the MIRIAD task MAXFIT; | |
|---|---|---|---|
| (GHz) | (K) | (Jy beam-1) | |
| 219.560357 | C18O 2–1 | 16 | 0.52 |
| 219.949442 | SO – | 35 | 2.45 |
| 229.347628 | SO2 – | 122 | 0.29 |
| 231.060983 | OCS 19–18 | 111 | 2.55 |
| 219.908525 | HCO – | 33 | 0.81 |
| 219.656710 | HNCO – | 448 | 0.56 |
| 219.733850 | HNCO – | 231 | 1.33 |
| 219.798320 | HNCO – | 58 | 1.53 |
| 220.585200 | HNCO – | 102 | 1.46 |
| 220.038072 | HCOOH – | 59 | 0.66 |
| 220.178196 | CH2CO – | 77 | 0.98 |
| 219.983675 | CH3OH – | 803 | 0.75 |
| 219.993658 | CH3OH – | 777 | 0.64 |
| 220.078561 | CH3OH – | 97 | 2.92 |
| 220.886784 | CH3OH – | 1182 | 0.45 |
| 229.589056 | CH3OH – | 375 | 4.59 |
| 229.758756 | CH3OH – | 89 | 2.86 |
| 229.864121 | CH3OH – | 579 | 1.79 |
| 229.939095 | CH3OH – | 579 | 1.93 |
| 230.027047eeUnder LTE, the peak flux is unexpectedly higher than other CH3OH lines (e.g., CH3OH –), which may be partly due to blending with C3H7CN (–), =230.027116 GHz and C2H3CN (–), =230.026216 GHz; | CH3OH – | 40 | 3.36 |
| 230.368763ffBlended with CH3OCH3 (–), =230.368178 GHz; | CH3OH – | 684 | 1.56 |
| 220.362774ggNot listed in the JPL catalog, but included in Cologne Database for Molecular Spectroscopy; | 13CH3OH – | 410 | 0.41 |
| 220.475807 | CH3CN – | 526 | 0.39 |
| 220.539324 | CH3CN – | 419 | 0.71 |
| 220.594423 | CH3CN – | 326 | 1.87 |
| 220.641084 | CH3CN – | 248 | 1.66 |
| 220.679287 | CH3CN – | 183 | 2.07 |
| 220.709017 | CH3CN – | 133 | 2.98 |
| 220.730261 | CH3CN – | 98 | 2.79 |
| 220.743011 | CH3CN – | 76 | 3.05 |
| 220.747261 | CH3CN – | 69 | 2.78 |
| 219.268715 | CH3CHO – | 517 | 0.43 |
| 230.301880 | CH3CHO – | 81 | 0.54 |
| 219.411703 | CH3OCHO – | 355 | 0.39 |
| 219.763947 | CH3OCHO – | 342 | 0.64 |
| 219.822126 | CH3OCHO – | 355 | 0.41 |
| 220.030339 | CH3OCHO – | 342 | 0.57 |
| 220.166888 | CH3OCHO – | 103 | 1.26 |
| 220.190285 | CH3OCHO – | 103 | 1.32 |
| 220.258096 | CH3OCHO – | 331 | 0.41 |
| 220.369877 | CH3OCHO – | 331 | 0.52 |
| 220.913955 | CH3OCHO – | 321 | 0.36 |
| 220.946352 | CH3OCHO – | 321 | 0.34 |
| 220.977984 | CH3OCHO – | 250 | 0.38 |
| 220.985330 | CH3OCHO – | 321 | 0.45 |
| 220.998335 | CH3OCHO – | 250 | 0.52 |
| 221.047791 | CH3OCHO – | 231 | 0.50 |
| 221.066933 | CH3OCHO – | 231 | 0.36 |
| 221.141129 | CH3OCHO – | 213 | 0.97 |
| 229.405021 | CH3OCHO – | 111 | 1.44 |
| 229.420342 | CH3OCHO – | 111 | 1.45 |
| 230.293951 | CH3OCHO – | 204 | 0.75 |
| 230.315800hhBlended with CH3CHO –, =230.315740 GHz; | CH3OCHO – | 204 | 0.69 |
| 230.878810 | CH3OCHO – | 301 | 0.45 |
| 220.601927 | C2H5OH – | 75 | 1.08 |
| 229.491131iiBlended with CH3OCHO –, =229.492067 GHz; | C2H5OH – | 160 | 0.66 |
| 229.818039 | C2H5OH – | 385 | 0.43 |
| 230.177998 | C2H5OH – | 894 | 0.41 |
| 230.230743 | C2H5OH – | 143 | 0.66 |
| 230.473005jjBlended with CH3OCH3 –, =230.473591 GHz; | C2H5OH – | 215 | 0.38 |
| 230.672554 | C2H5OH – | 139 | 0.66 |
| 230.793764kkBlended with C2H5OH –, =230.793864 GHz; | C2H5OH – | 105 | 0.53 |
| 230.953778 | C2H5OH – | 146 | 0.75 |
| 230.991374 | C2H5OH – | 86 | 1.08 |
| 220.893110 | CH3OCH3 – | 275 | 0.40 |
| 230.141374 llProbably blended with C3H7CN –, =230.142063 GHz; | CH3OCH3 – | 319 | 0.51 |
| 229.234mmNot identified. | — | — | 0.29 |
| 230.578mmNot identified. | — | — | 0.65 |