Supernova 2008bk and Its Red Supergiant Progenitor
Abstract
We have obtained limited photometric and spectroscopic data for Supernova (SN) 2008bk in NGC 7793, primarily at d after explosion. We find that it is a Type II-Plateau (II-P) SN which most closely resembles the low-luminosity SN 1999br in NGC 4900. Given the overall similarity between the observed light curves and colors of SNe 2008bk and 1999br, we infer that the total visual extinction to SN 2008bk ( mag) must be almost entirely due to the Galactic foreground, similar to what has been assumed for SN 1999br. We confirm the identification of the putative red supergiant (RSG) progenitor star of the SN in high-quality images we had obtained in 2007 at the Gemini-South 8 m telescope. Little ambiguity exists in this progenitor identification, qualifying it as the best example to date, next to the identification of the star Sk 69° 202 as the progenitor of SN 1987A. From a combination of photometry of the Gemini images with that of archival, pre-SN, Very Large Telescope images, we derive an accurate observed spectral energy distribution (SED) for the progenitor. We find from nebular strong-intensity emission-line indices for several H ii regions near the SN that the metallicity in the environment is likely subsolar (). The observed SED of the star agrees quite well with synthetic SEDs obtained from model red supergiant atmospheres with effective temperature K. We find, therefore, that the star had a bolometric luminosity with respect to the Sun of and radius at months prior to explosion. Comparing the progenitor’s properties with theoretical massive-star evolutionary models, we conclude that the RSG progenitor had an initial mass in the range of 8–8.5 M☉. This mass is consistent with, albeit at the low end of, the inferred range of initial masses for SN II-P progenitors. It is also consistent with the estimated upper limit on the initial mass of the progenitor of SN 1999br, and it agrees with the low initial masses found for the RSG progenitors of other low-luminosity SNe II-P.
Subject headings:
supernovae: general — supernovae: individual (SN 2008bk) — stars: late-type — stars: evolution — stars: fundamental parameters: other — galaxies: individual (NGC 7793)1. Introduction
The evolution of massive stars, particularly their endpoints, remains a fascinating, and still unresolved, set of questions and problems that have ramifications in various aspects of astrophysics, such as galactic evolution and chemical enrichment. Theoretically, we expect stars with initial masses greater than 8–9 M☉ to terminate central nuclear burning while in the red supergiant (RSG) phase of their evolution, undergo core collapse, and explode as supernovae (SNe; Woosley & Weaver, 1986; Heger et al., 2003). From observations of the progenitor stars of Type II-Plateau (II-P) SNe, we find that this theoretical lower mass limit is essentially what is being inferred (Smartt et al., 2009). The SNe II-P from detected stars near this limit have tended to be of relatively low luminosity, such as SN 2005cs in M51 (Maund, Smartt, & Danziger, 2005; Li et al., 2006) and SN 2009md in NGC 3389 (Fraser et al., 2011). This stands in contrast to models which argue that low-luminosity SNe II-P can be explained by fallback of ejecta on a newly formed black hole, as a result of the core collapse of a highly massive ( M☉) progenitor (e.g., Turatto et al., 1998; Zampieri et al., 2003; Nomoto et al., 2006).
In recent years, SN progenitors have been directly identified in pre-SN archival images obtained by the Hubble Space Telescope (HST). Of course, direct progenitor identification has also been made from the ground prior to that, the most famous example being the discovery of the star Sk 69°202 as the progenitor of SN 1987A in the Large Magellanic Cloud (LMC; e.g., Gilmozzi et al., 1987; Sonneborn, Altner, & Kirshner, 1987). Other cases include the progenitors of SN 1961V in NGC 1058 (Bertola, 1964; Zwicky, 1964), SN 1978K in NGC 1313 (Ryder et al., 1993), and SN 1993J in M81 (Aldering, Humphreys, & Richmond, 1994; Cohen, Darling, & Porter, 1995; Van Dyk et al., 2002). However, all of these examples are SNe which in some way have been peculiar or otherwise unusual. The nature of SN 1961V as a true SN continues to be debated (see Van Dyk 2005, and references therein; also, Smith et al. 2011; Kochanek, Szczygiel, & Stanek 2011; Van Dyk & Matheson 2011).
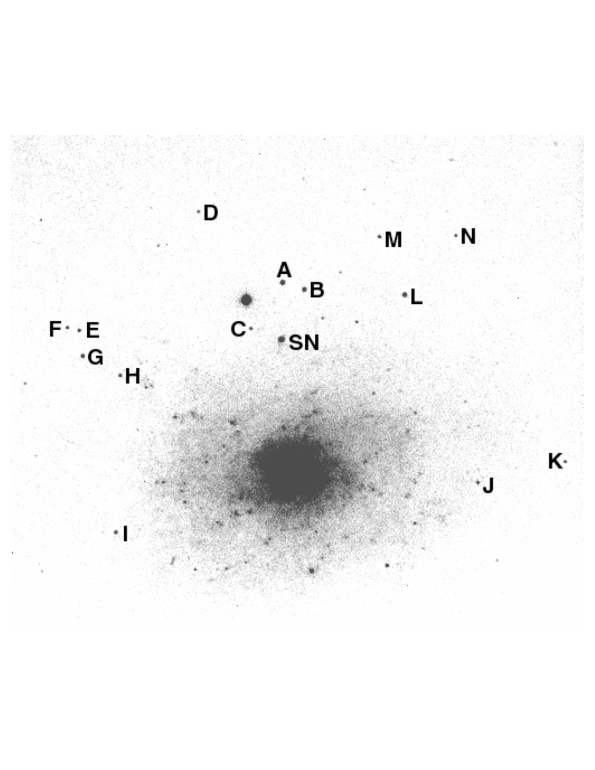
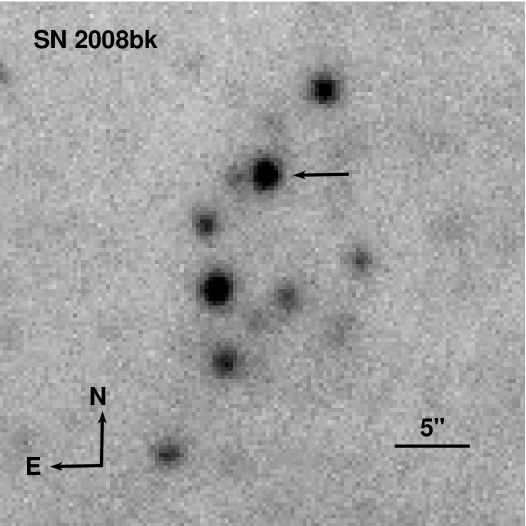
SN 2008bk in the nearby, nearly face-on spiral galaxy NGC 7793 (see Figure 1) has also had its progenitor star identified in ground-based data. The SN was discovered by Monard (2008) on March 25.14 (UT dates are used throughout this paper). Li et al. (2008) were the first to attempt to identify the progenitor star as a likely RSG in deep archival ground-based images obtained in 2001 with one of the 8.2 m Unit Telescopes (UT) of the European Southern Observatory (ESO) Very Large Telescope (VLT). They used the Monard discovery images and also images taken on March 28.41 with the 0.41 m PROMPT 2 telescope at the Cerro Tololo Inter-American Observatory (CTIO) as references. This search for the progenitor was attempted even before the SN had been classified. However, Li et al. concluded that SN 2008bk was likely a core-collapse SN, since a star was detected at the location; it is far less likely that we would be able to detect the progenitor, or the companion to the progenitor, of a thermonuclear Type Ia SN outside of the Local Group (see, e.g., Li et al., 2011). The SN was subsequently classified by Morrell & Stritzinger (2008) as Type II with an age of 36 d after explosion on April 12.4, based on a comparison with the well-studied SN II-P 1999em in NGC 1637.
Maoz & Mannucci (2008) detected and measured magnitudes for the progenitor star in archival near-infrared (IR) - and -band images, also obtained with the VLT in 2005. Mattila et al. (2008) further analyzed the VLT optical images, as well as VLT -band data obtained in 2007, and combined these pre-SN results with precise astrometry provided by post-SN VLT adaptive optics imaging. From their analysis they concluded that the total extinction toward the progenitor is mag, and that the star therefore was likely of type M4 I, with an initial mass of .
In this paper, with limited photometry and spectroscopy of the SN itself, we show that SN 2008bk is a SN II-P very similar to the low-luminosity SN 1999br in NGC 4900 (Pastorello et al., 2004). Furthermore, we measure accurate photometry for the RSG progenitor from superior-quality images obtained in 2007 with the Gemini-South 8 m telescope, as well as from the archival, pre-SN, near-IR VLT images. We compare this photometry to spectral energy distributions (SEDs) obtained from stellar atmosphere models for RSGs, to infer the star’s effective temperature. Together with the inferred luminosity for the star, we compare these properties to recent theoretical models for massive-star evolution, to estimate the initial mass for the progenitor. We also compare our results to those obtained by Mattila et al. (2008).
2. Supernova Observations
Although highly incomplete in terms of photometric and spectroscopic coverage, our observations of SN 2008bk are still sufficient to determine its general properties and to allow for comparison with other SNe II. A more complete analysis of the properties of SN 2008bk is forthcoming (Pignata et al., in prep.).
2.1. Photometry
We obtained images of SN 2008bk, at eight epochs late in its evolution: four at the Calar Alto 2.2 m telescope + the CAFOS SiTe (scale pix-1, field of view ), two at the 2.5 m Nordic Optical Telescope (NOT; Roque de los Muchachos Observatory, La Palma, Spain) + ALFOSC ( pix-1, field of view ), and two using the SMARTS 1.3 m telescope + ANDICAM at CTIO. These images were processed using standard IRAF111IRAF (Image Reduction and Analysis Facility) is distributed by the National Optical Astronomy Observatories, which are operated by the Association of Universities for Research in Astronomy, Inc., under cooperative agreement with the National Science Foundation (NSF). procedures for image trimming, bias subtraction, and flat-field corrections. Additionally, we add several relatively early-time epochs at , with an image obtained at the Las Campanas Observatory (LCO) 2.5 m duPont telescope on 2008 April 13 and six images obtained with the Global Rent-A-Scope (GRAS) 0.32 m and 0.41 m telescopes at epochs spanning the plateau to early on the exponential tail. We have also included data, obtained by the CHilean Automatic Supernova sEarch (CHASE; Pignata et al., 2008) with PROMPT 2.
We extracted instrumental photometry for the SN and reference stars from these images, generally, via point-spread function (PSF) fitting using DAOPHOT (Stetson, 1987) within IRAF. When the shapes of the stars in images deviated substantially from a “well-behaved” PSF, we relied only on aperture photometry. For this reason, we calibrated the SN and reference star instrumental photometry from all of the images to existing photometry for the star field around the host galaxy. NGC 7793 was observed by Larsen & Richtler (1999) in with the Danish 1.54 m telescope + the Danish Faint Object Spectrograph and Camera on 1997 September 6. We obtained these images, posted for public distribution in FITS format, from the NASA/IPAC Extragalactic Database (NED222http://nedwww.ipac.caltech.edu.). We extracted instrumental magnitudes from the images using IRAF, first with a 4″ aperture and then with a PSF for each band. Calibration was established using photometry of a number of isolated reference stars through a 20″ aperture, which matches the aperture used to establish the calibration through standard-star observations by Larsen (1999, his Table 1); see Figure 1 and Table 1 for the locations and magnitudes of these stars. We also applied the appropriate extinction corrections (S. S. Larsen 2010, private communication).
We can compare our photometry with those magnitudes provided in NOMAD333http://www.nofs.navy.mil/nomad.html.; however, the uncertainties in these latter magnitudes are substantial, resulting in large scatter in the comparison: for , NOMADOurs ; for , ; and for , . A far better comparison can be made at with the more reliable photometry from the DENIS database (DENIS Consortium, 2005): DENISOurs mag. The good agreement in the magnitudes provides us with some confidence, overall, in the calibration of our photometry.
As many reference stars as possible were generally adopted for the calibration; however, for the shallowest images, we had to use a combination of the magnitudes of star K (the brightest star in Table 1) and the less precise photometry from the bright NOMAD stars seen in these images. The resulting photometry of SN 2008bk is given in Table 2. The uncertainties in the SN photometry in all four bands arise from the measurement uncertainties from DAOPHOT, the uncertainties in the absolute calibration given by Larsen (1999), and the uncertainties in transforming the instrumental magnitudes to standard magnitudes, based on the reference stars, all added in quadrature.
The light curves for SN 2008bk are shown in Figure 2. As we have noted, many of the multi-band points are beyond the plateau phase and on the exponential tail. However, the photometry at earlier times provides us with adequate leverage on the overall photometric evolution of SN 2008bk, from soon after explosion through the onset of this tail. The lone early-time datapoint provides us with some leverage on the initial color of the SN.
For comparison, we also show in Figure 2 the light curves for both the “normal” SN II-P 1999em (Hamuy et al., 2001; Leonard et al., 2002; Elmhamdi et al., 2003) and the subluminous SN II-P 2005cs in M51 (Pastorello et al., 2009), and, for all bands, the subluminous SN II-P 1999br (Pastorello et al., 2004). We have attempted to match, by eye, the brightnesses of these comparison SNe with SN 2008bk toward the end of the plateau phase at . Although we have very limited coverage at the end of the plateau, it appears that this phase ended very near JD 2454651 (i.e., 2008 July 3), implying that the plateau lasted d after discovery. (Additionally, the end of the plateau phase for SN 1999br is not well defined; Pastorello et al. 2004.) The SN 2008bk light curves are shown in Figure 2 relative to that epoch.
In Figure 3 we show the absolute light curve for SN 2008bk, which results from correcting for the assumed extinction (see § 4.1) and distance modulus (see § 4.2) to the SN. We also show for comparison the absolute light curves for SN 1999em, corrected for the total extinction, mag (e.g., Hamuy et al., 2001), and the Cepheid distance modulus to its host galaxy (Leonard et al., 2003); SN 2005cs, corrected for the extinction from Pastorello et al. (2009) and the distance modulus from Tonry et al. (2001); and SN 1999br (extinction and distance modulus from Pastorello et al. 2004). We estimate that SN 2008bk had an absolute magnitude near maximum brightness during the plateau phase of mag, which is mag less luminous than SN 1999em. Although the plateau brightness for SN 2008bk is very similar to the mag for the low-luminosity SN II-P 2005cs (Pastorello et al., 2009), SN 2008bk did not decline nearly as rapidly, post-maximum, nor is it nearly as subluminous on the tail as SN 2005cs. One can see from Figure 2 that SN 2008bk exhibits a striking photometric resemblance to SN 1999br at all bands. However, a noticeable offset exists between the absolute brightnesses of SNe 2008bk and 1999br; we comment on this more in § 5. We will demonstrate in §2.2 that SN 2008bk also spectroscopically most closely resembles SN 1999br. We therefore consider SN 2008bk to be a low-luminosity SN II-P, quite similar to SN 1999br.
The photometric comparison with SN 1999br (assuming the explosion date for SN 1999br is JD 2451278; Pastorello et al., 2004) indicates that the explosion epoch for SN 2008bk was JD 2454550, or 2008 March 24. Monard, therefore, likely discovered the SN d after explosion.
2.2. Spectroscopy
We obtained several spectra of SN 2008bk at late times, using the Blanco 4 m telescope at CTIO with the RC-Spectrograph in 2008 July and using the Calar Alto 2.2 m telescope with the CAFOS SiTe imaging spectrograph in 2008 September. The details of these observations are given in Table 3. The spectra were reduced using standard IRAF routines. The preprocessing of the spectroscopic data (trimming, bias, overscan, and flat-field correction) were the same as for the images (see §2.1). The one-dimensional spectra were wavelength calibrated by comparison with arc-lamp spectra obtained during the same night and with the same instrumental configuration, and flux calibrated using spectrophotometric standard stars. The zeropoint of the wavelength calibration was verified against the bright night-sky emission lines. The standard-star spectra were also used to model and remove the telluric absorption (e.g., Matheson et al., 2000).
The resulting spectra are shown in Figure 4. Since the spectra obtained at CTIO are only spaced in time each by a day, the features in the spectra had varied little in that time interval. Thus, we show only a representative spectrum from July 24. The same is true for the two spectra obtained at Calar Alto in mid-September; we display only the spectrum from September 16. The July 24 spectrum is d past the plateau phase, while the September 16 and 30 spectra are during the nebular phase, at and d past the plateau. In Figure 5 we show the SN 2008bk spectrum from July 24, and also spectra of the normal SN II-P 1999em (Leonard et al., 2002) at 1 d and 29 d past the plateau phase, as well as a spectrum of the subluminous SN II-P 1999br in NGC 4900 (Pastorello et al., 2004) at essentially the end of the plateau. The spectra for SN 1999em were obtained from the SUSPECT SN database444http://suspect.nhn.ou.edu/suspect.. A. Pastorello kindly provided the spectrum from the Padova SN data archive of SN 1999br from 1999 July 20.
Both the strength and width of the various spectral lines, and the overall continuum shape, for SN 2008bk compare rather poorly with SN 1999em. A far better comparison, overall, can be made with SN 1999br. The relative strength of, for example, the [Ca ii] 7291, 7324 feature in the SN 2008bk spectrum, compared with that in the SN 1999br spectrum, again indicate that SN 2008bk is also a low-luminosity SN II-P.
3. Detection of the Progenitor Star
Li et al. (2008) measured a precise position for the SN of (J2000) = , (J2000) = . Within the uncertainty of this position () they isolated a star in the VLT -band image at this location. The star is not detected in the and images from the same epoch. This candidate progenitor lies within a prominent cluster of bright blue and red supergiant stars. From its environment and its lack of detection in the bluer bands, Li et al. conjectured that the progenitor was a RSG.
We have since improved the astrometric agreement, with an uncertainty of , between the SN and the star with a image of the SN from the LCO 2.5 m duPont telescope, obtained on 2008 April 13. We have refined the absolute position for the SN to end figures and (with uncertainty ).
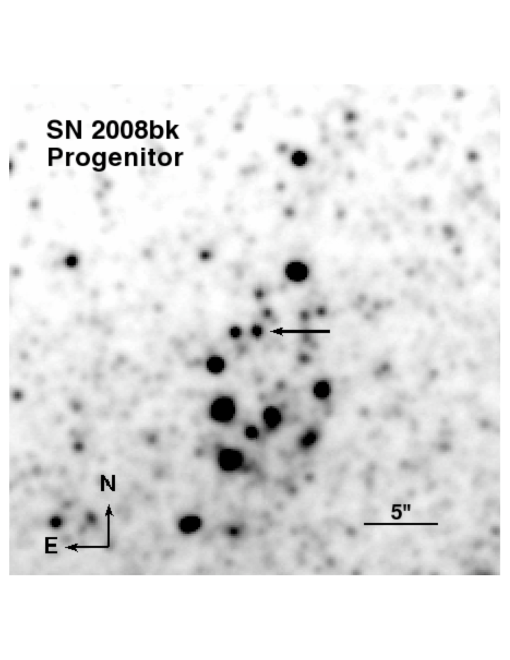
We obtained deep images in 2007 September and October with GMOS (Crampton et al. 2000) on Gemini-South, to study the outer disk of NGC 7793. The images were obtained in queue observing mode as part of program GS2007B-Q-57 (PI: Davidge). The detector in GMOS is a mosaic of three CCDs with a raw image scale of pix-1. The data were binned pixels2 to better match the delivered image quality. Eight 200-s exposures were obtained in , and eight 300-s exposures were obtained in both and . The raw images in each band were bias subtracted, divided by a twilight flat, and then stacked. The progenitor star and its environment are shown in Figure 6. From these images we measure an absolute position for the star to end figures and (). To within the absolute astrometric uncertainties, the position of the identified progenitor star agrees very well with the SN position (see above).
We extracted instrumental photometry from the images via PSF fitting within IRAF/DAOPHOT. Since the Gemini program was intended to be carried out during nonphotometric conditions as part of the so-called “Poor Weather Queue,” this photometry must be calibrated using other observations. Following Welch et al. (2007), we then transformed the instrumental magnitudes from the Gemini images to the calibrated magnitudes from the Danish telescope images (see §2.1), using a number of bright (–20.4 mag), isolated stars common to both sets of images. The resulting transformations are
We note that the coefficients in the transformation above are similar to the ones derived by Welch et al. as applied to a different scientific context. The uncertainties in these transformations are 0.08 mag for , 0.05 mag for , and 0.07 mag for .
The resulting magnitudes for the SN 2008bk progenitor from the Gemini images are given in Table 4. The uncertainties in the magnitudes include the measurement uncertainties from DAOPHOT, the uncertainties in the calibration of the Danish telescope images of the galaxy (Larsen, 1999, his Table 1), and the uncertainties in the transformations above, all added in quadrature.
We also reanalyzed and remeasured the photometry from the near-IR VLT ISAAC and HAWK-I images, initially analyzed by Maoz & Mannucci (2008) and Mattila et al. (2008). Photometry was performed, again using PSF fitting with IRAF/DAOPHOT, and the instrumental magnitudes were calibrated to 2MASS stars in the fields. The resulting photometry is given in Table 4. The uncertainties in the magnitudes include the measurement uncertainties from DAOPHOT, the uncertainties in the 2MASS star magnitudes, and the uncertainties in the transformations using 2MASS. Later (see § 4.4), we will need these near-IR magnitudes in the Bessell & Brett (1988) system, particularly for . For this reason, we use the transformations from the 2MASS system in Carpenter (2001; his Appendix A) to obtain , , and mag (formal uncertainties in these transformations are all mag).
4. Properties of the Progenitor Star and Its Environment
We will now place the SN 2008bk progenitor in a Hertzsprung-Russell diagram (HRD), to attempt to estimate its initial mass. Whereas the photometry of the progenitor star has relatively small uncertainties, the next steps, discussed below, involved in analyzing this photometry possess significantly larger uncertainties.
4.1. Extinction to the Supernova
Here we estimate the extinction to the SN. The startlingly good agreement, seen in Figure 2, between the light curves of both SN 2008bk and SN 1999br in all observed bands (the SN 1999br curves have all been uniformly adjusted by mag to match, by eye, those of SN 2008bk) implies that the extinction toward SN 2008bk is quite similar to that of SN 1999br. Smartt et al. (2009) assume only the Galactic foreground contribution to the extinction toward SN 1999br: mag. We can then logically infer that the extinction toward SN 2008bk is comparably quite low; we assume mag. Interestingly, the estimate for the Galactic line-of-sight extinction toward the SN is, in fact, mag (Schlegel, Finkbeiner, & Davis 1998), which would imply that the extinction in the immediate galactic environment of SN 2008bk is negligible. From a preliminary analysis of the photospheric spectra for SN 2008bk, no sign exists of Na i D absorption due to the host galaxy. Additionally, the average internal extinction in NGC 7793 is generally quite low ( mag; Pierce & Tully 1992). The low extinction value is consistent with the lack of emission at 8.0 m (normally attributed to emission from polycyclic aromatic hydrocarbons in interstellar dust clouds) detected at the position of SN 2008bk in archival images of NGC 7793 obtained using the InfraRed Array Camera (IRAC) on the Spitzer Space Telescope. It is also consistent with the fact that the SN is within what appears to be a nebular, possibly evacuated, bubble (see Figure 7).
4.2. Distance Modulus to the Host Galaxy
We also require an estimate of the distance modulus to the SN. Puche & Carignan (1988) calculated a mean distance modulus, mag, to NGC 7793 from several distance indicators, including the Tully-Fisher relation. Karachentsev et al. (2003) measured a distance modulus of Mpc (somewhat more distant, but in good agreement with the Puche & Carignan value), using HST images of the host galaxy to estimate the “tip of the red giant branch” (TRGB) brightness to be mag. (These HST images, unfortunately, did not cover the SN site; furthermore, we note that Mould & Sakai 2008, using the TRGB calibration of mag by Rizzi et al. 2007, found mag; however, their assumed -band extinction, mag, is almost certainly too large.)
The distance modulus has been recently determined using Cepheids in the host galaxy by Pietrzyński et al. (2010) to be mag (random) mag (systematic). Those authors note that their distance modulus also agrees very well with a recent TRGB measurement, mag, by Jacobs et al. (2009). Hereafter, we adopt the Cepheid distance modulus and, conservatively, assume the (larger) systematic uncertainty in that estimate.
4.3. Metallicity of the Supernova Environment
Furthermore, we need to know the metallicity in the SN environment, since we are comparing the progenitor’s observed characteristics with estimates from models which are generated assuming a particular metallicity.
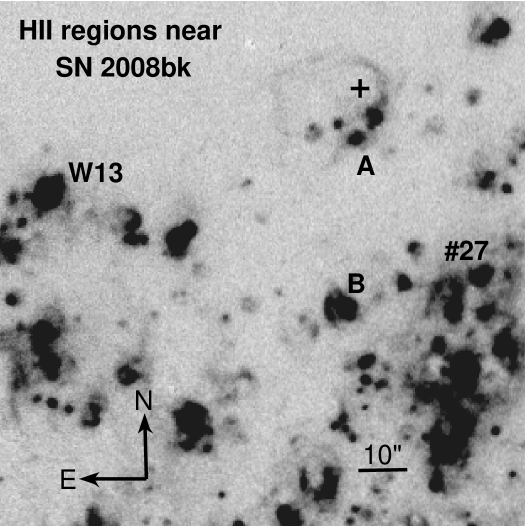
We consider the metallicity to be equivalent to the local oxygen abundance. The most accurate estimate of the metallicity ideally would be from the immediate SN environment itself, or failing that, from regions of the host galaxy in the general vicinity of the SN. We show several such H ii regions in Figure 7, which is a continuum-subtracted H (+ [N ii]) image of NGC 7793, released as an ancillary data product by the Spitzer SINGS Legacy project555Available at http://irsa.ipac.caltech.edu. (Kennicutt et al. 2003). In the spectroscopic observations of the SN obtained on 2008 September 30 at Calar Alto, light from two H ii regions, “A” and “B,” approximately to the south of the SN also fell within the CAFOS slit.
Pettini & Pagel (2004) calibrate relations between the O abundance and the strong-intensity line indices [N ii] 6584/H (see, e.g., Terlevich et al. 1991; Storchi-Bergmann, Calzetti, & Kinney 1994; Denicoló, Terlevich, & Terlevich 2002) and (([O iii] 5007/H)/([N ii] 6584/H)). These two indices are relatively unaffected by extinction, since they depend on ratios of intensities for two spectral lines essentially contiguous in wavelength. The uncertainties in the O abundance from these two indices are and dex, respectively (Pettini & Pagel 2004). We measured the intensities for these various emission lines, using standard routines in IRAF, and estimate these line indices for these two H ii regions.
The resulting values of the indices and the computed abundances are given in Table 5. We estimate that our measurement errors lead to uncertainties in the abundances of, conservatively, dex. Additionally, we can consider the measurements for the H ii regions #27 from Bibby & Crowther (2010) and W13 from McCall, Rybski, & Shields (1985). These two regions are labeled in Figure 7 and listed in Table 5. We also include in the table the deprojected angular distance of each H ii region from the SN, assuming the values of the host-galaxy inclination and position angle from Bibby & Crowther (2010) and references therein. The linear distances in the table are assuming a distance to the host galaxy of 3.4 Mpc (see § 4.2).
One can see that the O abundances of these H ii regions are all consistent with an approximate range of 8.4 to 8.5 dex. The region nearest to ( pc from) the SN, in particular, has 12 + log(O/H) = 8.45. Assuming the solar photospheric abundance is 12 + log(O/H) (Asplund et al. 2004), we can infer that the metallicity in the SN environment is solar. The mean O abundance of H ii regions in the LMC is 12 + log(O/H) (Russell & Dopita 1990), or solar. Therefore, the metallicity at the SN site is most likely not solar, but also is likely not quite as low as the mean LMC nebular metallicity. However, with the level of uncertainties in the Pettini & Pagel (2004) calibration relations, in our measurements, and in the assumed solar and LMC O abundances, we analyze the progenitor photometry considering a range of metallicities. We will show that the inferred intrinsic properties for the progenitor, nonetheless, are most consistent with subsolar metallicity in the SN environment.
4.4. Initial Mass of the Progenitor
We have assumed a relatively low extinction toward SN 2008bk, based on the comparison with SN 1999br (§2.1). We further assume that this extinction (§4.1) is also appropriate to apply to the progenitor star. From the Gemini optical data, this star, therefore, had an absolute magnitude and a dereddened color mag, which imply that the progenitor was a lower-luminosity (class Ib), early M-type RSG (e.g., Humphreys & McElroy 1984).
From the observed optical and near-IR photometry in Table 4, we show the SED of the star in Figure 8. For comparison we show synthetic SEDs, generated using SYNPHOT applied to the MARCS666http://marcs.astro.uu.se/. model stellar atmospheres (Gustafsson et al. 2008) for RSGs with effective temperature K and surface gravity , assuming spherical geometry and subsolar metallicity ([M/H] = , where [M/H] denotes the ratio of the general metal abundance to H, relative to the Sun). We also show the models at solar metallicity ([M/H] = 0) for this temperature, and one can see little difference with the subsolar models. The MARCS models are for stars with initial masses 5 and 15 M⊙ (we will show that the initial mass of the SN 2008bk progenitor was in between these two values) and have microturbulence velocities spanning from 1 to 5 km s-1. The models were all reddened by the assumed value for the progenitor, following the Cardelli, Clayton, & Mathis (1989) reddening law, and were normalized to the observed magnitude. The agreement of all of these models with the observed SED is quite good, to within the uncertainties in the photometry of the progenitor. (However, the models do diverge by from the observation at , and compare less well with the observations at .) We therefore consider the effective temperature of the star to be K, with a conservative uncertainty of K.
This effective temperature corresponds to spectral type M2–M2.5 at LMC metallicity (Levesque et al. 2006; their Table 4), and M3 at solar metallicity (Levesque et al. 2005; their Table 5). The metallicity in the SN 2008bk environment is likely somewhere in between (§ 4.3). From Levesque et al. (2005; their Table 6) for Galactic (solar metallicity) RSGs, the and bolometric corrections at K are and mag, respectively. At LMC metallicity, the bolometric corrections vary little from the solar values at this : and mag (Levesque et al. 2006). The absolute bolometric magnitude of the star, therefore, from is mag, and from it is mag. The total uncertainties arise from the uncertainties in the measured photometry for the star and in the distance modulus (see §4.2), and at , in the range in . That these two estimates of , established from the two different photometric measurements, agree so well to within the uncertainties, instills us with considerable confidence in the star’s photometry and in our estimates of the extinction and the star’s effective temperature. Assuming M = 4.74 mag, the bolometric luminosity relative to the Sun is then from both and . The luminosity and effective temperature together indicate that the RSG’s radius, at months prior to explosion, is .
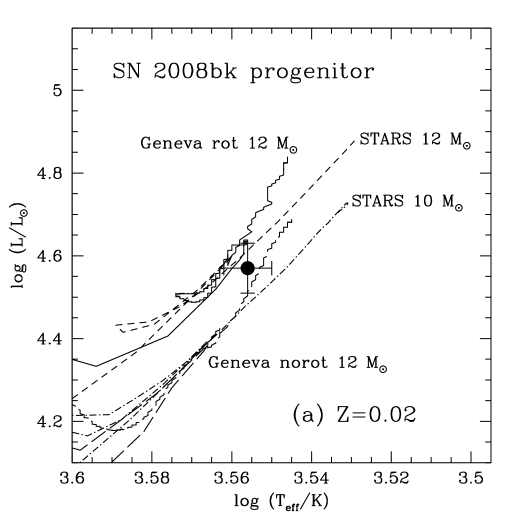
The inferred intrinsic properties of the progenitor of SN 2008bk are shown in the HRD in Figure 9. We can also compare the star’s locus in the HRD with massive-star evolutionary tracks of various initial masses, and, given the uncertainties mentioned in § 4.3, we take into consideration tracks at several metallicities. In panel (a) of the figure, we compare to tracks at solar metallicity (), i.e., the Cambridge STARS tracks from Eldridge & Tout (2004) and the Geneva tracks from Hirschi, Meynet, & Maeder (2004), which include either stellar equatorial rotation, at km s-1, or no rotation. One can see that these tracks would imply that the initial mass of the progenitor is in the range of –12 M☉. However, these tracks all terminate at cooler effective temperatures and higher luminosities (and larger stellar radii) than is the case for the progenitor. In total, the solar metallicity tracks compare rather poorly with the progenitor’s inferred properties, and we consider it unlikely that the larger initial masses implied by these tracks apply to the SN 2008bk progenitor.
In Figure 9, panel (b), we show a comparison with the STARS tracks at (i.e., at ; the Geneva tracks have not been published at subsolar metallicity in this mass range). The 8 and 8.5 M☉ model tracks both terminate with K, and with and 4.63 (respectively) and and (respectively), which are essentially consistent, to within the uncertainties, with those properties of the progenitor. Note that the 9 M☉ model terminates at a luminosity that is higher than the range we have inferred for the progenitor’s luminosity. Note also that the 7.5 M☉ track terminates at a much cooler temperature and much higher luminosity, and therefore we can discount it entirely. In panel (c), we compare with the STARS models for (i.e., ), although it is less likely that the metallicity in the SN environment is quite this low (§ 4.3). The 8 and 8.5 M☉ tracks terminate with and 3622 K, and 4.63, and and (respectively), which again agree, to within the uncertainties, with the star’s locus in the HRD (the exception being the 7.5 M☉ track, which terminates at a stage too cool and too luminous than what is observed, and again, we can discount it). Much better agreement exists between the star’s properties and the subsolar metallicity tracks, which, all told, imply that the star’s initial mass was –8.5 M☉. These stellar evolutionary models all have lost of mass prior to reaching their termini.
4.5. Comparison with Mattila et al. (2008)
We can make a direct comparison of our results for the SN 2008bk progenitor with those of Mattila et al. (2008). One can see from Figure 10 that all of our magnitude measurements for the star are brighter than those measured by Mattila et al. (2008), particularly their measurement at and their upper limit at (which is substantially fainter than our actual detection in this band). We cannot provide an explanation for this difference. However, we feel confident in the veracity and self-consistency of our photometry, based on comparison with pre-existing photometry of stars in the SN field (§ 2.1), and on the relatively low dispersions in the transformation of photometry to from the Gemini images and of the near-IR instrumental photometry to 2MASS magnitudes from the VLT images (§ 3). Additionally, the Elias, Frogel, & Humphreys (1985) RSG intrinsic colors, specifically , are systematically bluer, for a given and spectral type, than those found by Levesque et al. (2006). The net effect, as seen in Figure 10, is that higher extinction and reddening are required to allow for a comparison (and not a particularly good one!) of the model SED for a M4I supergiant from Elias, Frogel, & Humphreys (1985) with the photometry from Mattila et al. (2008). Simply for the sake of argument, we also show in the figure the SED for a RSG from the MARCS stellar atmosphere models with K (which Mattila et al. assume to be the equivalent of a M4I star at LMC metallicity), adopting our extinction to the SN. This model actually provides a better comparison with the Mattila et al. (2008) photometry than do the Elias, Frogel, & Humphreys (1985) intrinsic colors, and this not only would imply that the effective temperature is cooler than what we have found, but does so in agreement with a far lower value for the extinction than what Mattila et al. (2008) had assumed. The implied cooler temperature is driven primarily by the significantly fainter -band magnitude and upper limit to the brightness found by Mattila et al. (2008).
The fainter -band measurement by Mattila et al. (2008), combined with the implied cooler effective temperature, which corresponds to a larger (positive) (Levesque et al. 2005; 2006), as well as the lower value for extinction, all lead to a much lower luminosity for the SN progenitor than what we have found to be the case. A comparison of the luminosity and effective temperature with massive-star evolutionary models in a HRD shown in Figure 11 implies that the SN progenitor would have an initial mass well below the threshold mass necessary for core collapse. It is only by virtue of their assumption that mag, which, based on their photometry, results in the star being more luminous than what we find here, that Mattila et al. arrive at its initial mass being . As we presented in § 4.1, we have found no evidence for such a large extinction to the SN.
Estimating the reddening to the progenitor through comparison with assumed intrinsic properties for RSGs is almost certainly fraught with uncertainties. Mattila et al. (2008) also attempted to estimate the extinction based on the Balmer decrement for an H ii region (W13; McCall, Rybski, & Shields 1985), which is from the SN 2008bk site. In general, it is far more accurate to estimate the reddening from the SN light curves and colors, particularly during the plateau phase, where the colors of SNe II-P are remarkably similar (e.g., Bersten & Hamuy 2009). Although our light curves for SN 2008bk are very limited in coverage, we therefore believe that the comparison with the more extensive SN 1999br curves provide a reliable estimate of the extinction to SN 2008bk.
We note that Mattila et al. (2008) assumed the distance modulus from Karachentsev et al. (2003); however, this contributes relatively little to the overall difference between our two studies. Furthermore, our assessments of the metallicity in the SN 2008bk environment differ as well. Mattila et al. (2008) estimated the metallicity, assuming the Pilyugin, Vílchez, & Contini (2004) metallicity-radial distance relation for NGC 7793, and concluded that the O abundance was 12 + log(O/H) . Bibby & Crowther (2010) also have determined the metallicity gradient in NGC 7793. If we assume the deprojected radial distance, , of SN 2008bk given by Mattila et al. (2008, ) and the radial distance at mag arcsec-2, (Bibby & Crowther 2010, and references therein), then for , the abundance is a slightly higher 12 + log(O/H) . We have shown in § 4.3 from direct estimation of the O abundance in neighboring H ii regions that 12 + log(O/H) –8.5.
5. Discussion and Conclusions
We conclude that SN 2008bk in NGC 7793 is most likely a low-luminosity SN II-P, similar in characteristics to SN 1999br. We have also confirmed the identification of an RSG as the SN progenitor. This star is readily detected in pre-SN, high-quality optical images from the Gemini-South Observatory. Although SN 1987A is closer, its association with the star Sk 69°202 certain, its multi-band brightness and color known (Isserstedt 1975), and, more importantly, its spectral type unambiguously defined (Rousseau et al. 1978), SN 2008bk ranks as the “second best-characterized” SN progenitor identification to date of any SN type. For this reason, its observed properties are well constrained.
We have assumed, based on the photometric comparison with SN 1999br, that the extinction toward SN 2008bk is quite low, mag, entirely consistent with Galactic foreground reddening. We have also estimated the metallicity in the SN environment from neighboring H ii regions and find that it is consistent with subsolar metallicity (). Furthermore, based on comparison of the observed SED with recent models for RSG stellar atmospheres, we are able to assign an effective temperature of K, and an absolute bolometric luminosity (relative to the Sun) of , both quantities with rather small uncertainties. We note the very good agreement in the bolometric magnitudes derived independently from both the observed and . Through comparison with recent theoretical massive-star evolutionary models for subsolar metallicity, we conclude that the progenitor of SN 2008bk had an initial mass in the range of 8–8.5 M☉. We note that this inferred mass range is consistent with the upper limit derived for the initial mass of the progenitor of SN 1999br (; Smartt et al. 2009), and is also within the initial mass range for RSG progenitors of SNe II-P, to (Smartt et al. 2009).
Further constraints on the initial mass of the SN 2008bk progenitor can be obtained through comparison with recent theoretical, radiative-transfer/hydrodynamical simulations of SNe II-P. We can compare our estimate of the star’s radius near explosion, , to those input to the pre-SN models generated at solar metallicity by Dessart, Livne, & Waldman (2010b): their nonrotating model has , while their rotating has . This implies that the SN 2008bk progenitor had to be , consistent with what we infer from comparison with theoretical massive-star evolutionary tracks.
The low tail-phase luminosity for SNe II of the SN 1999br variety has been explained by a low 56Ni mass produced in the explosion of a lower mass star. As Smartt et al. (2009) point out, nuclear statistical equilibrium is therefore reached only in a thin O-Si-rich layer around the core in such stars. Low progenitor masses are consistent with what has been directly found for other low-luminosity SNe II-P, such as SN 1999br, SN 2003gd in M74 (Van Dyk, Li, & Filippenko 2003; Smartt et al. 2004; Hendry et al. 2005), and SN 2005cs (Li et al. 2006; Pastorello et al. 2009). The lower initial mass estimate for the progenitor of SN 2008bk presented here is consistent with this trend and is essentially equivalent to the minimum mass for a SN II-P progenitor (see above; Smartt et al. 2009). It is notable that the case of SN 2008bk offers a possible indication that metallicity could also play a role in the low luminosity. Smartt et al. (2009) assume in the cases of SNe 1999br and 2003gd that the metallicity in these environments was subsolar; on the other hand, they adopt essentially solar metallicity in the case of SN 2005cs. It will be interesting to see in future cases whether a two-parameter (mass and metallicity) trend is possibly emerging.
We have already noted that SN 2008bk is mag more luminous than SN 1999br ( mag; Pastorello et al. 2004). This is particularly surprising, given the close overall agreement between the spectra, light-curve shapes, and color evolution for both SNe 1999br and 2008bk; one is tempted to expect their luminosities near maximum brightness to at least be comparable, if not the same (however, see Pastorello et al. 2004 for an assessment of the diversity among low-luminosity SNe II-P). One possible reconciliation of the different luminosities could be to assume a distance to the host galaxy (NGC 4900) of SN 1999br which is different from what has been adopted previously. Pastorello et al. (2004) assumed a “short” distance (17.3 Mpc), which is essentially that derived from the Tully-Fisher relation (Tully 1988); if one adopts the “long” distance (39.5 Mpc) found by Jones et al. (2009) using the Expanding Photosphere Method (EPM), then mag, which is now mag more luminous than SN 2008bk. Although EPM has its own inherent uncertainties and pitfalls, the implication is that, assuming SNe 2008bk and 1999br are very similar events, the actual distance to the SN 1999br host may be somewhere in between the long and short estimates. (Our by-eye adjustment of the SN 1999br light curves in Figure 2 to match those of SN 2008bk would then imply that the distance to NGC 4900 could be Mpc.)
Finally, although it will be ultimately satisfying to validate the identification of the progenitor star by obtaining images of SN 2008bk years hence, when it has faded close to invisibility (e.g., Maund & Smartt 2009)777But note that Dessart, Livne, & Waldman (2010a) conjecture that at least some low-luminosity SNe II-P could be SN “impostors,” and therefore the star could survive what might be an outburst, rather than a core-collapse explosion., the quality of the pre-SN imaging data and high astrometric precision of the SN and progenitor positions instill in us confidence in the star’s identification. Furthermore, the late-time image from 2009 August (see Table 2), shown in Figure 12, when compared directly with Figure 6, demonstrates with relatively little doubt that the progenitor is known. As Mattila et al. (2008) point out, in the -band pre-SN image, once the PSF of the RSG was subtracted away, a faint source south of the SN position remains (we also see this same source, when the PSF of the SN is subtracted from the late-time -band images). Based on the arguments above, we consider it highly unlikely that this much fainter object is the SN progenitor.
References
- Aldering, Humphreys, & Richmond (1994) Aldering, G., Humphreys, R. M., & Richmond, M. W. 1994, AJ, 107, 662
- Asplund et al. (2004) Asplund, M., Grevesse, N., Sauval, A. J., Allende Prieto, C., & Kiselman, D. 2004, A&A, 417, 751
- Bersten & Hamuy (2009) Bersten, M. C., & Hamuy, M. 2009, ApJ, 701, 200
- Bertola (1964) Bertola, F. 1964, AnnAp, 27, 319
- Bessell & Brett (1988) Bessell, M. S., & Brett, J. M. 1988, PASP, 100, 1134
- Bibby & Crowther (2010) Bibby, J. L., & Crowther, P. A. 2010, MNRAS, 405, 2737
- Cardelli, Clayton, & Mathis (1989) Cardelli, J. A., Clayton, G. C., & Mathis, J. S. 1989, ApJ, 345, 245
- Carpenter (2001) Carpenter, J. M. 2001, AJ, 121, 2851
- Cohen, Darling, & Porter (1995) Cohen, J. G., Darling, J., & Porter, A. 1995, AJ, 110, 308
- Crampton et al. (2000) Crampton, D., Fletcher, J. M., Jean, I., et al. 2000, Proc. SPIE, 4008, 114
- Denicoló, Terlevich, & Terlevich (2002) Denicoló, G., Terlevich, R., & Terlevich, E. 2002, MNRAS, 330, 69
- DENIS Consortium (2005) The DENIS Consortium. 2005, VizieR Online Data Catalog, 2263, 0
- Dessart, Livne, & Waldman (2010a) Dessart, L., Livne, E., & Waldman, R. 2010a, MNRAS, 405, 2113
- Dessart, Livne, & Waldman (2010b) Dessart, L., Livne, E., & Waldman, R. 2010b, MNRAS, 408, 827
- Eldridge & Tout (2004) Eldridge, J. J., & Tout, C. A. 2004, MNRAS, 348, 201
- Elias, Frogel, & Humphreys (1985) Elias, J. H., Frogel, J. A., & Humphreys, R. M. 1985, ApJS, 57, 91
- Elmhamdi et al. (2003) Elmhamdi, A., Danziger, I. J., Chugai, N., et al. 2003, MNRAS, 338, 939
- Fraser et al. (2011) Fraser, M., Ergon, M., Eldridge, J. J., et al. 2011, MNRAS, 417, 1417
- Gilmozzi et al. (1987) Gilmozzi, R., Cassatella, A., Clavel, J., et al. 1987, Nature, 328, 318
- Gustafsson et al. (2008) Gustafsson, B., Edvardsson, B., Eriksson, K., et al. 2008, A&A, 486, 951
- Hamuy et al. (2001) Hamuy, M., Pinto, P. A., Maza, J., et al. 2001, ApJ, 558, 615
- Heger et al. (2003) Heger, A., Fryer, C. L., Woosley, S. E., Langer, N., & Hartmann, D. H. 2003, ApJ, 591, 288
- Hendry et al. (2005) Hendry, M. A., Smartt, S. J., Maund, J. R., et al. 2005, MNRAS, 359, 906
- Hirschi, Meynet, & Maeder (2004) Hirschi, R., Meynet, G., & Maeder, A. 2004, A&A, 425, 649
- Humphreys & McElroy (1984) Humphreys, R. M., & McElroy, D. B. 1984, ApJ, 284, 565
- Isserstedt (1975) Isserstedt, J. 1975, A&AS, 19, 259
- Jacobs et al. (2009) Jacobs, B. A., Rizzi, L., Tully, R. B., Shaya, E. J., Makarov, D. I., et al. 2009, AJ, 138, 332
- Jones et al. (2009) Jones, M. I., Hamuy, M., Lira, P., et al. 2009, ApJ, 696, 1176
- Karachentsev et al. (2003) Karachentsev, I. D., Grebel, E. K., Sharina, M. E., et al. 2003, A&A, 404, 93
- Kennicutt et al. (2003) Kennicutt, R. C., Jr., Armus, L., Bendo, G., et al. 2003, PASP, 115, 928
- Kochanek, Szczygiel, & Stanek (2011) Kochanek, C. S., Szczygiel, D. M., & Stanek, K. Z. 2011, ApJ, 737, 76
- Larsen (1999) Larsen, S. S. 1999, A&AS, 139, 393
- Larsen & Richtler (1999) Larsen, S. S., & Richtler, T. 1999, A&A, 345, 59
- Leonard et al. (2002) Leonard, D. C., Filippenko, A. V., Gates, E. L., et al. 2002, PASP, 114, 35
- Leonard et al. (2003) Leonard, D. C., Kanbur, S. M., Ngeow, C. C., & Tanvir, N. R. 2003, ApJ, 594, 247
- Levesque et al. (2005) Levesque, E. M., Massey, P., Olsen, K. A. G., et al. 2005, ApJ, 628, 973
- Levesque et al. (2006) Levesque, E. M., Massey, P., Olsen, K. A. G., et al. 2006, ApJ, 645, 1102
- Li et al. (2006) Li, W., Van Dyk, S. D., Filippenko, A. V., et al. 2006, ApJ, 641, 1060
- Li et al. (2008) Li, W., Van Dyk, S. D., Filippenko, A. V., et al. 2008, Central Bureau Electronic Telegrams, 1319, 1
- Li et al. (2011) Li, W., Bloom, J. S., Podsiadlowski, P., et al. 2011, Nature, in press (arXiv:1109.1593)
- Maoz & Mannucci (2008) Maoz, D., & Mannucci, F. 2008, The Astronomer’s Telegram, 1464, 1
- Matheson et al. (2000) Matheson, T., Filippenko, A. V., Barth, A. J., et al. 2000, AJ, 120, 1487
- Mattila et al. (2008) Mattila, S., Smartt, S. J., Eldridge, J. J., et al. 2008, ApJ, 688, L91
- Maund & Smartt (2009) Maund, J. R., & Smartt, S. J. 2009, Science, 324, 486
- Maund, Smartt, & Danziger (2005) Maund, J. R., Smartt, S. J., & Danziger, I. J. 2005, MNRAS, 364, L33
- McCall, Rybski, & Shields (1985) McCall, M. L., Rybski, P. M., & Shields, G. A. 1985, ApJS, 57, 1
- Monard (2008) Monard, L. A. G. 2008, Central Bureau Electronic Telegrams, 1315, 1
- Morrell & Stritzinger (2008) Morrell, N., & Stritzinger, M. 2008, Central Bureau Electronic Telegrams, 1335, 1
- Mould & Sakai (2008) Mould, J., & Sakai, S. 2008, ApJ, 686, L75
- Nomoto et al. (2006) Nomoto, K., Tominaga, N., Umeda, H., Kobayashi, C., & Maeda, K. 2006, Nuclear Physics A, 777, 424
- Pastorello et al. (2004) Pastorello, A., Zampieri, L., Turatto, M., et al. 2004, MNRAS, 347, 74
- Pastorello et al. (2009) Pastorello, A., Valenti, S., Zampieri, L., et al. 2009, MNRAS, 394, 2266
- Pettini & Pagel (2004) Pettini, M., & Pagel, B. E. J. 2004, MNRAS, 348, L59
- Pierce & Tully (1992) Pierce, M. J., & Tully, R. B. 1992, ApJ, 387, 47
- Pietrzyński et al. (2010) Pietrzyński, G., Gieren, W., Hamuy, M., et al. 2010, AJ, 140, 1475
- Pignata et al. (2008) Pignata, G., Maza, J., Hamuy, M., et al. 2008, Central Bureau Electronic Telegrams, 1319, 2
- Pilyugin, Vílchez, & Contini (2004) Pilyugin, L. S., Vílchez, J. M., & Contini, T. 2004, A&A, 425, 849
- Puche & Carignan (1988) Puche, D., & Carignan, C. 1988, AJ, 95, 1025
- Rizzi et al. (2007) Rizzi, L., Tully, R. B., Makarov, D., et al. 2007, ApJ, 661, 815
- Rousseau et al. (1978) Rousseau, J., Martin, N., Prévot, L., et al. 1978, A&AS, 31, 243
- Russell & Dopita (1990) Russell, S. C., & Dopita, M. A. 1990, ApJS, 74, 93
- Ryder et al. (1993) Ryder, S., Staveley-Smith, L., Dopita, M., et al. 1993, ApJ, 416, 167
- Schlegel, Finkbeiner, & Davis (1998) Schlegel, D. J., Finkbeiner, D. P., & Davis, M. 1998, ApJ, 500, 525
- Smartt et al. (2004) Smartt, S. J., Maund, J. R., Hendry, M. A., et al. 2004, Science, 303, 499
- Smartt et al. (2009) Smartt, S. J., Eldridge, J. J., Crockett, R. M., & Maund, J. R. 2009, MNRAS, 395, 1409
- Smith et al. (2011) Smith, N., Li, W., Silverman, J. M., Ganeshalingam, M., & Filippenko, A. V. 2011, MNRAS, 415, 773
- Sonneborn, Altner, & Kirshner (1987) Sonneborn, G., Altner, B., & Kirshner, R. P. 1987, ApJ, 323, L35
- Stetson (1987) Stetson, P. B. 1987, PASP, 99, 191
- Storchi-Bergmann, Calzetti, & Kinney (1994) Storchi-Bergmann, T., Calzetti, D., & Kinney, A. L. 1994, ApJ, 429, 572
- Terlevich et al. (1991) Terlevich, R., Melnick, J., Masegosa, J., Moles, M., & Copetti, M. V. F. 1991, A&A, 91, 285
- Tonry et al. (2001) Tonry, J. L., Dressler, A., Blakeslee, J. P., et al. 2001, ApJ, 546, 681
- Tully (1988) Tully, R. B. 1988, Nearby Galaxies Catalog, Cambridge and New York, Cambridge University Press, 221 p.
- Turatto et al. (1998) Turatto, M., Mazzali, P. A., Young, T. R., et al. 1998, ApJ, 498, L129
- Van Dyk (2005) Van Dyk, S. D. 2005, The Fate of the Most Massive Stars, 332, 47
- Van Dyk & Matheson (2011) Van Dyk, S. D., & Matheson, T. 2011, ApJ, in press
- Van Dyk, Li, & Filippenko (2003) Van Dyk, S. D., Li, W., & Filippenko, A. V. 2003, PASP, 115, 1289
- Van Dyk et al. (2002) Van Dyk, S. D., Garnavich, P. M., Filippenko, A. V., et al. 2002, PASP, 114, 1322
- Welch et al. (2007) Welch, D. L., Clayton, G. C., Campbell, A., et al. 2007, ApJ, 669, 525
- Woosley & Weaver (1986) Woosley, S. E., & Weaver, T. A. 1986, ARA&A, 24, 205
- Zampieri et al. (2003) Zampieri, L., Pastorello, A., Turatto, M., et al. 2003, MNRAS, 338, 711
- Zwicky (1964) Zwicky, F. 1964, ApJ, 139, 514
| Star | (mag) | (mag) | (mag) | (mag) |
|---|---|---|---|---|
| A | 17.459(004) | 16.328(003) | 15.728(004) | 15.085(008) |
| B | 16.939(003) | 16.283(003) | 15.910(003) | 15.447(008) |
| C | 18.894(012) | 18.120(015) | 17.662(015) | 17.132(013) |
| D | 18.574(005) | 17.898(003) | 17.512(004) | 17.045(008) |
| E | 18.184(005) | 17.314(003) | 16.813(003) | 16.290(010) |
| F | 19.415(007) | 18.251(003) | 17.531(003) | 16.832(008) |
| G | 19.025(006) | 17.714(003) | 16.836(003) | 15.861(008) |
| H | 20.092(011) | 18.642(004) | 17.664(000) | 16.561(008) |
| I | 19.392(008) | 18.054(003) | 17.178(003) | 16.219(006) |
| J | 17.512(012) | 17.401(012) | 17.289(012) | 16.918(011) |
| K | 15.013(001) | 14.278(018) | 15.080(051) | 13.497(014) |
| L | 16.794(004) | 16.130(004) | 15.790(004) | 15.364(007) |
| M | 17.515(004) | 17.060(004) | 16.814(004) | 16.444(007) |
| N | 18.730(004) | 18.031(004) | 17.649(004) | 17.165(004) |
| UT date | JD2450000 | (mag) | (mag) | (mag) | (mag) | SourcebbCHASE = 0.41 m PROMPT2 + Apogee U47; LCO duPont = Las Campanas Observatory 2.5 m duPont + SITe2K; S. Howerton = GRAS-008 + SBIG ST-L-11K 3, GRAS-015 + SBIG ST-8 3 or SBIG ST-10 3 CCD; Calar Alto = 2.2 m Calar Alto + CAFOS; NOT = 2.5 m Nordic Optical Telescope + ALFOSC; SMARTS = 1.3 m SMARTS + ANDICAM. |
|---|---|---|---|---|---|---|
| 2008 Mar 28.41 | 4553.90 | 12.94(13) | CHASE | |||
| 2008 Mar 29.40 | 4554.90 | 12.89(14) | 12.99(10) | CHASE | ||
| 2008 Apr 13.41 | 4569.91 | 12.94(05) | LCO duPont | |||
| 2008 May 10.79 | 4596.29 | 12.99(13) | S. Howerton | |||
| 2008 May 22.80 | 4608.30 | 13.02(06) | S. Howerton | |||
| 2008 May 30.85 | 4616.35 | 12.97(26) | S. Howerton | |||
| 2008 Jul 4.80 | 4651.30 | 13.07(12) | S. Howerton | |||
| 2008 Jul 21.65 | 4668.15 | 13.52(13) | S. Howerton | |||
| 2008 Aug 13.63 | 4691.13 | 15.64(11) | S. Howerton | |||
| 2008 Sep 13.02 | 4723.52 | 17.70(07) | 16.02(06) | 15.11(05) | 14.46(08) | Calar Alto |
| 2008 Sep 30.93 | 4740.43 | 17.83(07) | 16.22(06) | 15.32(05) | 14.62(08) | Calar Alto |
| 2008 Oct 15.91 | 4755.41 | 18.08(08) | 16.43(06) | 15.56(05) | 14.84(08) | Calar Alto |
| 2008 Dec 5.84 | 4806.34 | 18.38(07) | 16.87(06) | 16.06(05) | 15.40(08) | NOT |
| 2009 Jul 02.37 | 5014.87 | 19.04(03) | 18.39(03) | 18.07(03) | SMARTS | |
| 2009 Jul 16.36 | 5028.86 | 19.21(05) | 18.52(07) | 18.22(03) | SMARTS | |
| 2009 Aug 13.13 | 5056.63 | 20.67(06) | 19.55(08) | 19.14(05) | 18.67(08) | Calar Alto |
| 2009 Aug 13.16 | 5056.66 | 19.65(05) | 19.04(03) | 18.64(03) | NOT |
| UT Date | JD2450000 | DayaaThe approximate day is referenced to our estimate of the end of the plateau phase, JD 2454651.3. | Grism/Grating | Wavelength | InstrumentbbCTIO = Blanco 4 m telescope + R-C Spec (Cerro Tololo, Chile); CAHA = Calar Alto 2.2 m telescope + CAFOS SiTe (near Almeria, Spain). |
|---|---|---|---|---|---|
| Range (Å) | |||||
| 2008 Jul 23.36 | 4670.86 | 20 | KPGL3-1 | 4005–7738 | CTIO |
| 2008 Jul 24.35 | 4671.85 | 21 | KPGL3-1 | 4005–7738 | CTIO |
| 2008 Jul 25.31 | 4672.81 | 22 | KPGL3-1 | 4005–7738 | CTIO |
| 2008 Sep 14.04 | 4723.54 | 72 | G200 | 4900–10458 | CAHA |
| 2008 Sep 16.02 | 4725.52 | 74 | G200 | 3665–10463 | CAHA |
| 2008 Sep 30.93 | 4740.43 | 89 | R100 | 5710–9585 | CAHA |
| Band | Magnitude |
|---|---|
| 22.81(09) | |
| 22.03(07) | |
| 20.71(08) | |
| 19.26(14) | |
| 18.55(06) | |
| 18.14(10) |
| Region | SN offset ()bbAngular distance of the H ii region from SN 2008bk, deprojected for the host galaxy’s position angle and inclination (adopting the values for these from Bibby & Crowther 2010). See Figure 7. | SN offset (pc)ccAssuming a distance to the host galaxy of 3.4 Mpc (Pietrzyński et al. 2010). | 12 + log(O/H) | 12 + log(O/H) | Source | ||
|---|---|---|---|---|---|---|---|
| A | 12.3 | 203 | 8.45 | This work | |||
| B | 95.6 | 1576 | 8.52 | This work | |||
| #27 | 82.2 | 1355 | 8.53 | 8.47 | Bibby & Crowther (2010) | ||
| W13 | 103.2 | 1701 | 8.41 | 1.10 | 8.38 | McCall, Rybski, & Shields (1985) |