Modes of magnetic resonance of S=1 dimer chain compound NTENP.
Abstract
The spin dynamics of a quasi one dimensional bond alternating spin-gap antiferromagnet Ni(C9H24N4)NO2(ClO4) (abbreviated as NTENP) is studied by means of electron spin resonance (ESR) technique. Five modes of ESR transitions are observed and identified: transitions between singlet ground state and excited triplet states, three modes of transitions between spin sublevels of collective triplet states and antiferromagnetic resonance absorption in the field-induced antiferromagnetically ordered phase. Singlet-triplet and intra-triplet modes demonstrate a doublet structure which is due to two maxima in the density of magnon states in the low-frequency range. A joint analysis of the observed spectra and other experimental results allows to test the applicability of the fermionic and bosonic models. We conclude that the fermionic approach is more appropriate for the particular case of NTENP.
pacs:
76.30-v, 75.10.Pq, 75.30.KzI Introduction.
Dielectric magnetic crystals with an antiferromagnetic exchange interaction usually demonstrate Néel ordering at some critical temperature. Nevertheless, a number of antiferromagnetic systems do not order at temperatures far below the Curie-Weiss temperature. Examples are to be found among quasi one dimensional magnetic structures, networks of coupled magnetic dimers, frustrated magnets etc. Some of these systems have a gap of exchange origin in the magnetic excitation spectrum. This gap stabilizes the spin-disordered ground state against perturbations, such as interactions between the spin chains, anisotropy, etc. Spin-gap magnets remain in a disordered (”spin-liquid”) state down to zero temperature. The energy gap in the spectrum of triplet excitations may be varied by applying magnetic field or pressure. This provides an opportunity to control the stability of the spin-liquid state. When the gap vanishes at some critical field, the spins order antiferromagnetically. This phenomenon has been observed and studied recently for different spin-gap systems, such as the dimer magnet TlCuCl3 tlcucl3-oosawa ; tlcucl3-glazkov , the Haldane magnet PbNi2V2O5 pbnivo-tsujii ; pbnivo-smirnov , the spin =1 anisotropic chain system NiCl2-4SC(NH2)2 (abbreviated as DTN) DTNfirst ; DTN . Field induced antiferromagnetic ordering in spin-liquid systems was intensively discussed, in particular, as a kind of Bose-Einstein condensation of magnons (see, e.g. Refs. tlcucl3-nikuni, ,giamarchi-nature, ).
Elementary excitations of a Heisenberg spin-gap magnet are triplets, which may be classified by their spin projection and momentum . At zero field the lowest excited state is three-fold degenerate (). The energy of the spin sublevels depend on the magnetic field: . The energy gap vanishes at a critical field . Relativistic terms (e.g., crystal field, dipole-dipole interaction or anisotropic exchange) violate the high symmetry of the Heisenberg Hamiltonian. This results in a mixing of different spin states and in the lifting of the zero-field degeneracy of triplet spin sublevels. In this case the field dependence of spin sublevels, and hence the relation between the zero field energy and the critical field, become more complicated. There are three approaches to describing the spectrum in a magnetic field and calculating the critical field: fermionic models tsvelik ; affleck , the bosonic (or macroscopic) approach affleck ; farmar , and perturbative calculations zaliznyak ; golinelly . The fermionic approach is justified for the case of a purely one-dimensional spin-gap system. The bosonic approach implies proximity of three dimensional magnetic order. It is valid if the energy gap is much smaller then the main exchange integral. The perturbative approach is valid at low fields irrespectively to the system dimensionality. It demonstrates that quantized collective excitations are equivalent to sublevels of a single spin in an effective crystal field. Predictions of the perturbative model coincide with those of fermionic model (see Ref.zaliznyak, ), thus expanding applicability of the perturbative model in the one-dimensional case up to critical field. If the zero field spin sublevels are fixed, both types of results are indistinguishable at low field. Nevertheless, they differ in the vicinity of critical field: the perturbative/fermionic approach predicts a closing of the gap linearly with the magnetic field, while macroscopic approach predicts a faster square root dependence. The scenario of the spin gap behaviour in a magnetic field is not universal: the Haldane compound NENP was found to fit better to the fermionic model affleck , while another Haldane magnet PbNi2V2O8 and the dimer-type spin-liquid magnet TlCuCl3 fit to the macroscopic model pbnivo-smirnov ; farmar . Thus, it is of importance to study further spin-gap systems which demonstrate closing of a spin gap in a magnetic field.
Another problem that we address in this paper is the stability of excitations in spin liquid systems. The magnetic excitations spectrum usually includes several branches which may form two-particle continua. A decay of magnons is possible, if a single-magnon branch enters such a continuum. In this case magnon modes become overdamped, often resulting in a termination of the single-particle spectrum.
The recently found compound Ni(C9H24N4)NO2(ClO4), abbreviated as NTENP, is a good test probe for spin excitations at a critical field closing the gap, as well as for field induced ordering and spectrum termination.ntenp-first ; narumi ; hagiwara-prl94 ; zheludev2004 ; zheludev2006 Besides, it belongs to a new family of spin-gap magnets with dimerised spin chains. In crystals of NTENP, Ni2+ magnetic ions form dimerised spin S=1 chains running along axis of the triclinic crystal. In-chain exchange integral takes two alternating values and with a ratio . The larger exchange integral is K. narumi The spin gap in chains may be of a Haldane type, if chains are uniform (), or of a dimer nature in the opposite limit case . There is a zero gap point between these limiting cases at 0.6 (see, e.g., Ref. roma2003, ), thus NTENP belongs to the dimer class. The ground state of NTENP is a nonmagnetic singlet separated from the triplet excitations by an energy gap of about 1 meV. The triplet energy levels are split by the crystal field: the energies of the sublevels, found in neutron scattering experiments are 1.06, 1.15 and 1.96 meV, hagiwara-prl94 respectively. In zero magnetic field, the doubled energy of the lowest sublevel is a little bit lower than the energy of the upper sublevel. The excitations energies are field-dependent, and in a magnetic field the decay of magnons becomes allowed by the energy conservation law.hagiwara-prl94 ; zheludev2006 The critical field , closing the spin-gap is anisotropic: it varies from 85 kOe in a magnetic field applied along the chains to 114 kOe in the perpendicular orientation. narumi-prb The field-induced ordering takes place only at low temperatures: in a magnetic field of 100 kOe, applied along the chains, the Néel temperature is about 0.5 K. The phase diagrams for the induced ordering at different orientations of the magnetic field are described in Refs. hagiwara-prl96, , TateiwaPhysicaB, . Antiferromagnetic ordering above is confirmed by means of neutron scattering. hagiwara-prl94
In the present paper we report the detailed electron spin resonance (ESR) study of this material. This technique allowed us to detect excitations with energies of about 0.05meV (corresponding to the resonance frequency of approximately 10GHz) with the resolution of about 0.005meV (1 GHz). We observed magnetic resonance modes of thermally activated triplet excitations and the over-gap transitions, as well as antiferromagnetic resonance absorption in the field-induced ordered phase. The splitting of triplet modes was observed, which can be ascribed to the dispersion of the triplet excitations with wave vectors along the direction of a weak exchange (i.e. perpendicular to chains). Further, the spin resonance data provided a possibility for comparison of fermionic (perturbative) and bosonic (macroscopic) models. We found that our data favour the fermionic description. We refined parameters of the effective Hamiltonian of the triplet excitations and estimate the inter-chain exchange integral. The effects, related two the two-magnons decay of spin excitations, were observed.
II Experimental details and samples.
A set of custom-built transmission type ESR spectrometers covering the frequency range from 9 to 260 GHz was used for the experiments. The spectrometers were inserted in a 4He-bath cryostats equipped with 60—120 kOe cryomagnets. Microwave radiation was produced by commercial Gunn diode generators and backward wave oscillators. The microwave resonator with the sample inside was placed in a hermetically sealed chamber filled with heat exchange gas. The temperature of the sample may be stabilized by means of a heater in the interval between 1.3 K and 30 K. Experiments in the temperature range 0.4—1 K were performed in a custom-built spectrometer equipped with a 3He-3 pumping refrigerator. Microwave modes of several resonators were used to cover the entire frequency range.
In an experiment the signal transmitted through the resonator is recorded as a function of magnetic field. A diminishing of transmission means microwave absorption. Resonance absorption appears if the microwave frequency equals the frequency of a transition between states , (). The following selection rules should be satisfied: (i) the dipolar transition matrix element is non-zero (here is the amplitude of the oscillating field) and (ii) states and have the same wavevector . The total ESR absorption is a sum over all pairs of spin states and an integral over the -space.
The configuration of the microwave field in the resonator is different for different microwave modes, hence the polarization of microwave magnetic field in the sample is also different. Due to the finite sample size, even for a given mode, different polarizations of microwave field are present within the sample. Therefore, for the typical sample size, and for most of microwave resonator modes, the polarization selection rules do not prohibit any modes of magnetic resonance absorption.
We have used the samples of deuterated NTENP from the same batch as in Ref.zheludev2004, .
III Experimental results.
III.1 Above 1K: ESR of thermally activated excitations.
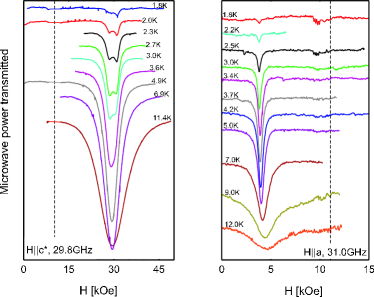
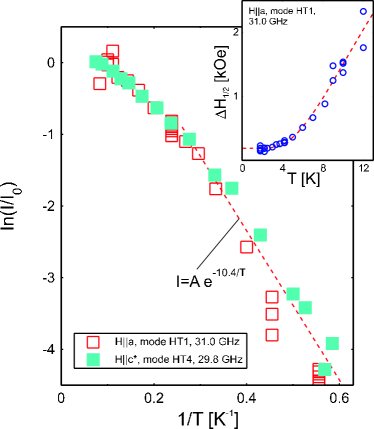
The intensity of the magnetic resonance absorption observed above 1K increases with temperature up to about 20 K. Upon heating beyond 20 K the lines broaden and disappear. Examples of the temperature evolution of spin resonance absorption for two orientations of the magnetic field are presented in Fig. 1. The lines are strongly shifted from the paramagnetic resonance position of free electron spins. The resonance field is anisotropic, which is in agreement with the zero-field splitting of the triplet sublevels observed in neutron scattering experiments. Below 5K the integrated intensity follows a law of thermal activation with the activation energy K (see Figure 2). This activation energy corresponds well to the known energy of lowest excited state of 1.06 meV.hagiwara-prl94 Exponential freezing out of intensity proves that this signal is due to transitions between sublevels of excited states. The temperature dependence of the linewidth is shown on the inset of Figure 2). The linewidth at =4K is practically the same as in the low-temperature limit. The resonance field at 4K also coincides with its low-temperature value. Thus, absorption at =4K may be attributed to noninteracting excitations distributed near the bottom of the spectrum.
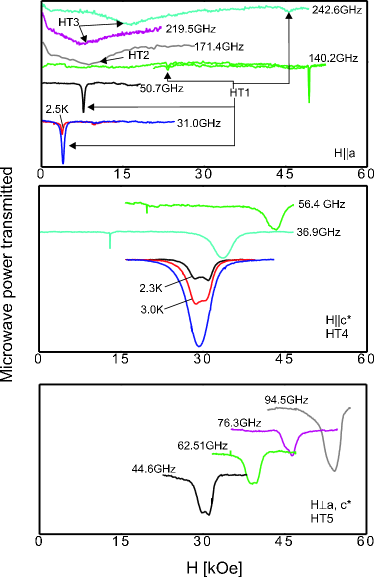
ESR absorption lines were collected at a set of frequencies at =4.2 K for three mutually orthogonal orientations: , and . Here is the crystallographic axis of the triclinic crystal and is perpendicular to the crystallographic -plane. From here on we will mark the resonance modes observed in the high temperature range 1 K as follows: HT1, HT2 and HT3 are the modes observed at , numbered in the order of ascend of zero-field frequency , HT4 is the mode observed at and HT5 is the mode observed at . Examples of the resonance lines at different frequencies are given in Figure 3.
At we observe single resonance lines for all modes. For or at low temperature the absorption line is split into two close components (see Figure 3). The intensities of the split components are approximately equal. The high frequency modes HT2 and HT3, observed in the orientation, are much broader then other resonance modes.
III.2 Below 1K: Singlet-triplet transition and antiferromagnetic resonance.
The experiments at K were performed only for because the critical field is a minimum at this orientation, enabling the largest value of .
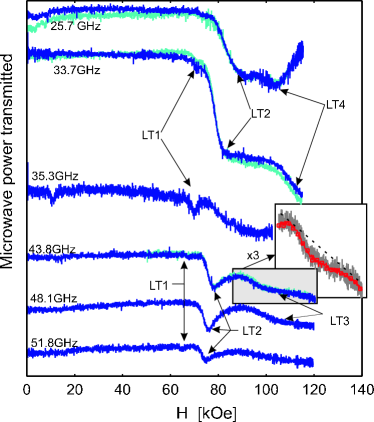
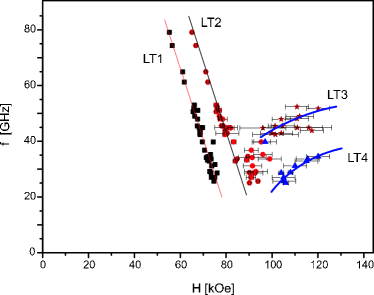
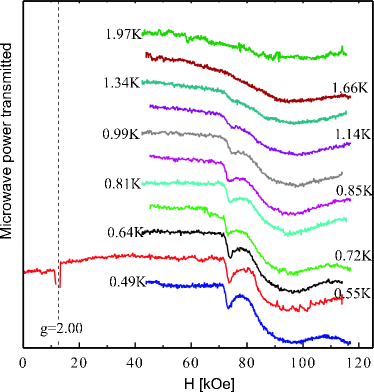
At temperatures below 1 K the triplet excitations are frozen out and do not contribute to resonance absorption. Nevertheless, other types of the ESR absorption arise at high fields (Figure 4). First, two absorption components (LT1 and LT2) split by about 10 kOe are observed below 90 kOe. These resonances shift to lower fields with the frequency increase. The second low-temperature absorption range is found above 90 kOe. Here two broad bands of microwave absorption denoted as LT3 and LT4 are found. Both of the absorption maxima shift to the higher fields with increasing frequency, as shown on Figure 5.
Mode LT1 is usually much weaker then LT2. The relative intensity of these modes varies irregularly with the frequency. This behaviour is, probably, due to the dependence of their excitation on the dominating polarization of microwave field. In contrast to HT-modes, intensities of modes LT1 and LT2 decrease with increasing temperature (see Figure 6), i.e. they are not thermally activated. These frequency-field and temperature dependences allow us to conclude that modes LT1 and LT2 correspond to singlet-triplet transitions. Two other low-temperature modes (LT3 and LT4) correspond to resonance modes of the field-induced ordered phase (above Hc) and may be considered as antiferromagnetic resonance modes.
Upon heating above 1K, the resonances LT1 and LT2 are no longer resolved. At several frequencies around 80—100 GHz we observed an indication of weak ESR mode at a temperature of 1.2K. This mode is, probably, related to modes LT1 and LT2. It is not split and located between LT1 and LT2 modes. A weak trace of the critical region survives to about 2.5 K in the form of a wide resonance, see Figure 6. We do not observe a clear anomaly in the temperature evolution of LT3 and LT4 modes at the Néel temperature (which is 0.6 K at the field of 100 kOe hagiwara-prl96 ; TateiwaPhysicaB ). Instead, these modes merge with the wide absorption near the critical field. This transformation is shown on Figure 7.
III.3 Frequency-field diagrams.
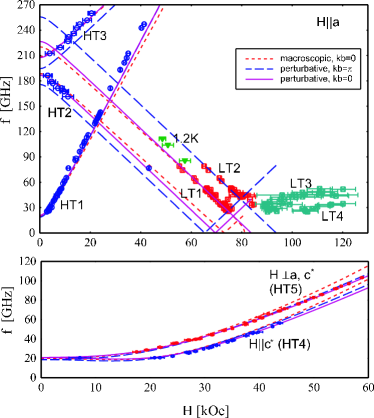
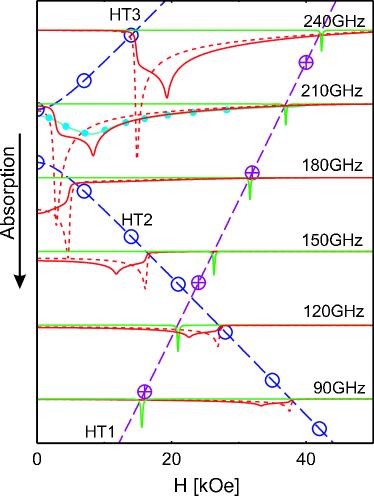
Resonance fields measured in different orientations are collected on the frequency-field diagram (Figure 8). We observe three thermally activated modes in orientation (HT1, HT2, HT3), one thermally activated mode at (HT4) and one thermally activated mode at (HT5). Positions of these modes are shown as measured at 4.2 K. At 0.4 K, in the orientation, we observe four modes (LT1, LT2, LT3, LT4). The frequencies of these modes are shown as measured at 0.4 K. A weak mode measured at 1.2 K originates, probably, from the temperature evolution of modes LT1, LT2 and is also plotted here. The splitting of modes HT4 and HT5 described above is too small to be resolvable on the Figure 8, being within the error bars.
Thermally activated modes HT1, HT2 and HT3 demonstrate zero-field gaps of , and GHz correspondingly. The frequencies of LT1 and LT2 modes may be approximated with a linear law with GHz/kOe (assuming ) and a gap of and GHz for modes LT1 and LT2 respectively. Critical fields for these modes, estimated as , are and kOe respectively.
IV Discussion.
This section is organized as follows: First, we will briefly summarize our experimental data and compare them with earlier results. Second, we will check the correspondence of perturbative and macroscopic approaches of spectrum description to experimental data. Finally, we will estimate the inter-chain coupling from the observed splitting of resonance modes and will analyze possible influence of magnon decay on the spectrum terminating in NTENP.
IV.1 Qualitative analysis.
Three types of spin resonance modes were observed: thermally activated intra-triplet transitions, singlet-triplet transitions and antiferromagnetic resonance absorption.
The zero field singlet-triplet transition frequencies estimated from the linear approximation of modes LT1 and LT2 ( and GHz, correspondingly) are in a good agreement with the lowest triplet excitation observed in neutron scattering experimentshagiwara-prl94 at GHz (i.e. meV). The frequencies of two other excitations were determined from neutron scattering as and GHz ( and meV). The zero-field ESR intratriplet transitions at , and GHz correspond well to the triplet sublevels energy differences, measured in neutron scattering experiments as , and GHz.
The derivative for the HT1 mode is approximately twice as large as expected for a free spins resonance with a -factor of 2.00. Besides, the zero field frequency of the HT1 mode is much smaller than the splitting of the triplet levels due to the main anisotropy term. This feature is well known for spin as a ”two-quantum” transition between the states with and (see, e.g. Ref.Abragam, ). This type of the -dependence should be observed for the direction of magnetic field along the main anisotropy axis and is very sensitive to the field orientation. Thus, our observation of HT1 mode proves that is close to the main anisotropy axis.
The extrapolation of modes LT1 and LT2 to zero frequency results in the critical fields of and kOe. This is again in agreement with the magnetization measurementsnarumi-prb on non-deuterated sample of NTENP done at 1.3 K where the increase of magnetization starts at 841 kOe for . A higher value of the critical field kOe was reported hagiwara-prl96 for deuterated NTENP. This value was extracted from the critical exponent fit of the phase boundary of the field-induced ordering. However, due to the lack of the experimental data points on the phase diagram in the immediate vicinity of the critical field this estimate of the should be considered with a higher error bar.
The singlet-triplet transitions (mode LT1 and LT2) should be forbidden in the Heisenberg case as transitions between different spin multiplets. ”Two-quantum” transitions (mode HT1) are also forbidden in the case of axial anisotropy, because there is no dipolar matrix element connecting states with and . In the presence of in-plane anisotropy it becomes allowed and should be observable at microwave magnetic field polarized parallel to static field. The modes HT2 and HT3 correspond to allowed transitions with large matrix elements at a conventional ESR polarization ( ). Despite this, the modes HT2,3 have weaker intensities and are broader than ”forbidden” modes. The intensity and lineshape for different modes will be analyzed in Subsection D.
Finally, there is a splitting of certain resonance modes: (i) Thermally activated modes HT4 and HT5 demonstrate splitting into two components of approximately equal intensity. (ii) Instead of a single-mode singlet-triplet transition, we observe two modes LT1 and LT2, LT1 is usually much weaker. This strong difference of LT1,2 modes intensities was repeated regularly for several samples. This excludes possible explanation of the splitting being caused by crystallites of different orientations.
IV.2 Comparison of the results of perturbative (fermionic) and macroscopic (bosonic) approaches to the low-energy dynamics of NTENP
| Our experiment: | Other | ||
| perturbative | macroscopic | experiments, | |
| model | model | Ref. | |
| zero-field | |||
| energies, GHz | 227, 247, 434 | 220, 240, 429 | 235, 273, 484hagiwara-prl94 |
| , kOe: | |||
| 83 | 81 | 85narumi-prb ; 92hagiwara-prl96 | |
| 119 | 86 | ||
| 117 | 83 | ||
| 108 | 82 | 114hagiwara-prl94 | |
We fit the observed ESR frequencies to the perturbative and macroscopic models mentioned in the Introduction. The -dependence of model parameters will be neglected in this Subsection because at low temperatures the quasiparticles are excited at the bottom of the spectrum. Consideration of the -dependence of energy levels near the bottom of the spectrum results in the asymmetric distortion of the absorption line, while the maximum of absorption still corresponds to the bottom of the spectrum due to a large statistical weight of the corresponding statesaffleck . The main anisotropy axis is taken to be parallel to the chain direction , this choice is based on the observation of the ”two-quantum” transition mode HT1. The second anisotropy axis may not be chosen from the symmetry consideration of the triclinic crystal and should be derived from the experiment. Thus, the direction of the second anisotropy axes in a plane perpendicular to is fitting parameter of the model. Finally, we will assume -factor to be isotropic.
The perturbative modelzaliznyak ; golinelly treats triplet excitations as non-interacting S=1 quasiparticles in the effective crystal field and in the external magnetic field. This approach is limited to low fields when the Zeeman energy is small in comparison with the spin gap. However, as it was shown in Ref.zaliznyak, , in a one dimensional case the results of perturbative formalism coincides with the fermionic formalism of Ref.tsvelik, , which is valid at all fields. For this reason, taking into account the strongly one-dimensional character of spin interactions in NTENP, we will apply the results of the perturbative approach all the way up to the critical field.
The effective Hamiltonian of the perturbative model is:
| (1) | |||||
here is the gap separating singlet state with zero energy from the excited triplets, and are the effective anisotropy constants, and is the -factor. This model includes 5 parameters: , , , and an angle between anisotropy axis and direction. Given these parameters, eigenenergies of the Hamiltonian (1) can be found in any orientation of magnetic field. Differences between the eigenenergies correspond to frequencies of thermally activated modes. The lowest eigenenergy corresponds to the singlet-triplet transition. The zero-field energies for this model are , and . The field dependences can be easily found for :
| (2) | |||||
| (3) |
For an arbitrary direction an analytical solution becomes too cumbersome. Critical fields for and are
| (4) | |||||
| (5) |
here is the angle in plane counted from direction.
The model was fit to the experimental data for thermally activated intertriplet transitions (modes HT1, 2, 3, 4, 5) and for LT1 as a singlet-triplet transition.The best fit corresponds to the following model parameters: GHz, GHz, GHz, and rad. The zero-field energies of triplet sublevels in frequency units, as predicted by this model, are collected in Table 1. The modelled frequency-field dependences are presented in Figure 8 by solid lines. They give a good approximation for the observed resonance modes.
The macroscopic (or bosonic) approachaffleck ; farmar describes the low energy spin dynamic of the spin-gap magnet as oscillations of a vector field . This model assumes that the spin oscillation frequencies are small with respect to the exchange frequency and that antiferromagnetic ordering appears above the critical field. Thus, the model requires non-zero inter-chain coupling.
The Lagrangian of the macroscopic model (without gradient terms) is
| (6) | |||||
here is the exchange constant describing the energy gap, and are the effective anisotropy constants, is a gyromagnetic ratio (, where GHz/kOe is a free electron gyromagnetic ratio). Below , the corresponding dynamic equation is:
| (13) |
For the case of the excitation energies are:
| (14) | |||||
| (15) |
The critical fields for and are
| (16) | |||||
| (17) |
Note, that for (i.e. , which corresponds to the case of NTENP) this model predicts no anisotropy of critical field for .
This model also has 5 fit parameters: , , , and the orientation of the axis with respect to the direction . The best fit obtained is shown on the Figure 8. It corresponds to the following parameters: GHz2, GHz2, GHz2, GHz/kOe (i.e. ), rad. The critical fields and zero-field energies of triplet states, predicted by this model, are collected in Table 1. This macroscopic model also yields predictions close to the experimental data, but the agreement is less satisfactory. In particular, systematic deviations are found for modes HT1, 4, 5.
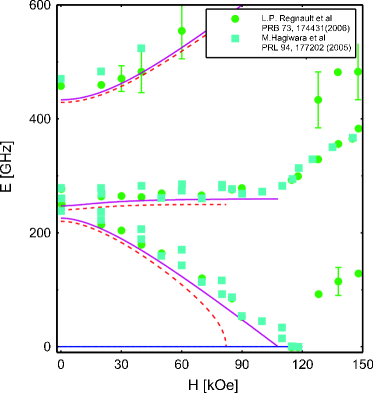
We conclude that the ESR data (Figure 8) favours the perturbative model though not unambiguously. To provide an additional check, we have calculated field dependences of energy levels in the orientation of magnetic field using the model parameters values determined above. These model predictions can be compared with independent data from neutron scattering, obtained in the same orientation of magnetic field hagiwara-prl94 ; zheludev2006 . As born out in Figure 9, predictions of the macroscopic model visibly deviate from the experimental points, while the perturbative model describe the neutron scattering data fairly well.
Thus we conclude that the perturbative (fermionic) model gives a better correspondence with the experiments for the case of NTENP. Disagreement of the macroscopic model with the experiment is probably due to the violation of low-frequency condition, since the energy of the upper triplet component of 450 GHz is about 40% of the largest exchange .
IV.3 The effect of inter-chain interaction.
Weak inter-chain interactions estimated as meVK were reported in Ref.zheludev2004, . These interactions will result in a dispersion of excitations propagating transverse to the chains. To take into account inter-chain coupling in the model calculations we will use form of excitations spectrum that combines the energy gaps and dispersive terms analogously to an antiferromagnet with anisotropic spin wave velocities:
| (18) | |||||
here are spin-wave stiffnesses along the chain and perpendicular to the chain, correspondingly (we use exchange energy in the form ), and are translation vectors of the rectangular lattice along the chains and in the transverse direction respectively, is the vector in -space relative to the point of minimum of energy, and () are the corresponding gaps, respectively.
The longitudinal spin-waves stiffness is due to the dominating in-chain exchange interaction and has a value of zheludev2004 : meVGHz. For a weak inter-chain interaction , and the dispersion for excitations propagating along the -axis is:
| (19) | |||||
From the exchange constants obtained in neutron scattering experiments we have K. Thus, all excitations with transverse wavevectors should be populated above 1K, including those at . Therefore, both points with maximum density of states of excitations will contribute to microwave absorption: the bottom of the spectrum at and the saddle point at . The parameters of effective Hamiltonian (1) in these points (, , and , , , respectively) are slightly different. This will result in the splitting of the resonance modes.
| (20) | |||||
| (21) | |||||
| (22) | |||||
Now we can ascribe LT1 and LT2 modes to the transitions between the ground state and and points in the excitations spectrum. This allows us to extract the value of from the splitting of these modes. The best fit corresponds to GHz (0.25meV).
The inter-chain exchange integral can be estimated as follows: K. This value is quite small and there are other interactions (i.e. dipolar, or anisotropic exchange interactions) of the same strength. Thus, the appearance of a weak transverse dispersion may be due to the combined action of several interactions, which are much weaker than the dominating in-chain exchange.
Frequency-field dependences for both the and excitations, calculated for all modes, are shown for comparison on the Figure 8. The splitting of resonance lines are well described by our dispersive model: The splitting is largest for the singlet-triplet transition (modes LT1 and LT2). It is due to the different values of lowest triplet sublevel energy in different points of -space. For the thermally activated modes, the splitting is much weaker, since it is determined by the difference of the triplet sublevels energies and all sublevels are shifted in the same direction due to the dispersion. For the HT1 mode the splitting is not observable because of the steep increase of frequency with magnetic field, while for modes HT4 and HT5 a weaker frequency-field dependence allows us to resolve the doublet by scanning the field. The predicted splitting of modes HT4 and HT5 is about 1kOe which is in agreement with experimental observations. As for the high-frequency modes HT2 and HT3 (), the predicted splitting of approximately 5kOe may not be observed because of the large linewidths of these modes (about 5kOe).
Equal intensities of the components of the split doublet for thermally activated modes HT4 and HT5 are due to almost equal population numbers at the top and bottom of the spectrum of transversal excitations. The observation of both LT1 and LT2 modes indicates that the ground state is a mixture of and states.
IV.4 Indications of the quasiparticles decay.
Taking into account the real values of the derivative , the linewidth of modes HT2, HT3 is about 20 GHz, while the linewidth of HT1 is 1 GHz. For modes HT4,5 it is about 4 GHz (splitting included).
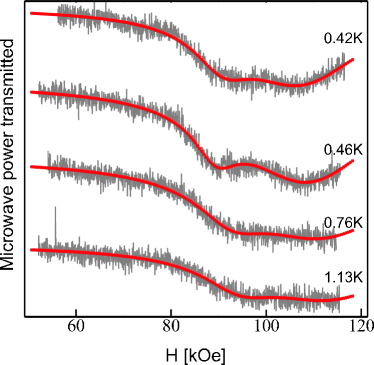
We performed a modelling of the ESR lineshape by integrating the expected signals over the -space.
Model calculations were performed in the perturbative approach using the best fit parameter values obtained as described in previous sections. The parameters , and for the effective Hamiltonian (1) where calculated using the zero field energies given in Table 1 for the perturbative model and using Eqn.(18). Then eigenfrequencies and eigenfunctions for Hamiltonian (1) and transition matrix elements were found. Finally, we calculated absorption by summing over the -space, taking into account the population of the sublevels involved in a given transition. The lineshape of individual transition was assumed to be Lorentzian with the inherent width of 0.5 GHz. This value was found to reproduce well the low-temperature linewidth of the narrow HT1 mode. The inherent linewidth was assumed to be the same for all transitions. The absorption was calculated for optimal polarization of the microwave magnetic field, i.e. for HT1 mode the longitudinal polarization of microwave field was used, while HT2 and HT3 modes absorption was calculated at transverse polarization. In an experiment both polarizations are usually present. For low frequency modes, the transverse polarization dominates.
Results of this modelling are presented on Figure 10. The model predicts that the absorption by modes HT2, HT3 should be in a wide band with a sharp edge corresponding to and a peak corresponding to , instead of the wide and approximately Lorentzian lines observed. The model predicts also, that the resonance absorption at the HT2 mode should be large enough to be detected at least at frequencies above 100 GHz. It disagrees with experimental observations, because, in the frequency range 170-240 GHz, a smeared peak is observed experimentally. Besides, below this frequency range, the resonance HT2 was not observed, while HT1 is observable.
A simple way to reconcile the model with the experiment is to suppose that the inherent linewidth of HT2 and HT3 modes is much larger then that for HT1 mode. The broad modes HT2 and HT3 involve transitions to the highest excitations branch, corresponding to , while the narrow modes HT1, HT4, HT5, LT1, LT2 correspond to transitions between lower energy branches. Therefore, the existence of a strong relaxation specifically for the excitations could explain observed discrepancy. We model this strong relaxation by assuming inherent linewidth of HT2 and HT3 modes to be equal to 5 GHz instead of 0.5 GHz. This, indeed, results in the smeared lineshape of HT3 resonance, as shown in Fig.10 in a solid line connecting filled circles.
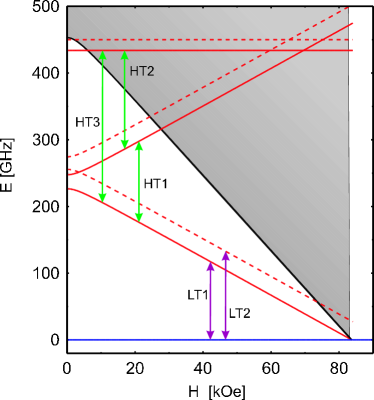
Possible reason for strong relaxation for the excitations is the entry of this branch into the two particle continuum range. Similar explanation was proposed in Ref.hagiwara-prl94, to describe the disappearance of the highest-energy excitations observed in neutron scattering experiment. The frequency corresponding to the bottom of the two particle continuum may be derived as a doubled frequency of the excitation (for the excitations with a positive dispersion). Energies of excitations and two-magnon continuum related to the lowest branch are shown in Figure 11. The decays of highest excitation branch into two excitations from the lowest branch may occur in NTENP due to the close values of the energy of highest excitation mode (which are 435 GHz for and 450 GHz for ) and the bottom of two particle continuum (which is 453GHz for ). In a magnetic field, the energy of the lowest branch decreases. At fields above 6 kOe the excitations of the highest branch became unstable with respect to the decays into two magnons of the lower branch.
It is an open question whether this intersection with the continuum destroys the excitation branch or just makes the magnon life time shorter. In any case, decay should result in a broadening of ESR line. The observed disappearance of the HT2 resonance in fields above 20 kOe (or in the frequency range below 150 GHz) may be due to such decays into two particles of lower branch.
IV.5 Antiferromagnetic resonance
The antiferromagnetic resonance absorption above consists of a broad band with two absorption maxima. This observation corresponds to the reported extreme broadening of the lowest energy antiferromagnetic mode in neutron scattering above for . zheludev2006 The splitting of the antiferromagnetic mode into two close resonances LT3 and LT4 may be due to the a dispersion in the transverse direction, analogous to the splitting of LT1,2 and HT4,5 modes described above.
V Conclusions.
The low-energy spin dynamics of the dimerised S=1 spin-chain compound NTENP is studied by means of ESR. Modes of magnetic resonance corresponding to transition between the spin sublevels of the collective triplet excitations of the spin-gap magnet are observed and identified. The singlet-triplet transitions to a spin gap state are also observed. The data analysis demonstrates that low-energy spin dynamics of this spin-gap magnet may be described by a perturbative model in the whole field range up to the critical field. The singlet-triplet transition and the intratriplet transitions have a doublet structure due to the dispersion of excitations propagating perpendicular to the chains. The energy of the inter-chain interaction is determined from the doublet splitting.
In addition we have observed a strong broadening and termination of spin resonance modes at the boundary of the two particle continuum, indicating the influence of the two-magnon decay processes on the spectrum of excitations in NTENP.
Acknowledgements.
The work was supported by grants of Russian Foundation for Basic Research (projects N 09-02-12341, 09-02-00736-a). One of the authors (V.G.) was supported by Presidential Grant for Young Scientists MK-4569.2008.2. Research at Oak Ridge sponsored by the Material Sciences and Engineering Division, Office of Basic Energy Sciences, US Department of Energy. Authors thank M.Zhitomirsky, I.Zaliznyak and O.Petrenko for their interest to the work and useful discussions.References
- (1) A.Oosawa, M.Ishi and H.Tanaka. Journal of Physics: Condenced Matter, 11 265 (1999).
- (2) V.N.Glazkov, A.I.Smirnov, H.Tanaka and A.Oosawa. Physical Review B, 69 184410 (2004).
- (3) N.Tsujii, O.Suzuki, H.Suzuki, H.Kitazawa, and G.Kido. Physical Review B 72 104402 (2005).
- (4) A.I.Smirnov, V.N.Glazkov, T.Kashiwagi, S.Kimura, M.Hagiwara, K.Kindo, A.Ya.Shapiro, and L.N.Demianets. Physical Review B, 77 100401(R) (2008).
- (5) V. S. Zapf, D. Zocco, B. R. Hansen, M. Jaime, N. Harrison, C. D. Batista, M. Kenzelmann, C. Niedermayer, A. Lacerda, and A. Paduan-Filho. Phys. Rev. Lett. 96, 077204 (2006)
- (6) S. A. Zvyagin, J. Wosnitza, A. K. Kolezhuk, V. S. Zapf, M. Jaime, A. Paduan-Filho, V. N. Glazkov, S. S. Sosin, and A. I. Smirnov Phys. Rev. B 77, 092413 (2008)
- (7) T.Nikuni, M.Oshikawa, A.Oosawa, and H.Tanaka. Physical Review Letters 84 5868 (2000).
- (8) T.Giamarchi, C.Ruegg, and O.Tchernyshyov. Nature Physics 4 198 (2008).
- (9) A.M.Tsvelik. Physical Review B 42 10499 (1990)
- (10) I.Affleck. Physical Review B 46 9002 (1992)
- (11) A.M.Farutin and V.I.Marchenko, Zh.Eksp.Teor.Fiz. 131 860 (2007) (JETP 104 751 (2007))
- (12) L.-P.Regnault, I.A.Zaliznyak and S.V.Meshhkov. J.Phys.:Condens.Matter 5 L677 (1993)
- (13) O.Golinelly, Th.Joliecoeur and R.Lacaze. J.Phys.:Condens.Matter 5 7847 (1993)
- (14) A.Escuer,R.Vicente and X.Solans. J.Chem.Soc. Dalton Trans. 531 (1997)
- (15) Y.Narumi, M.Hagiwara, M.Kohno, and K.Kindo. Physical Review Letters 86 324 (2001)
- (16) M.Hagiwara, L.P.Regnault, A.Zheludev, A.Stunault, N.Metoki, T.Suzuki, S.Suga, K.Kakurai, Y.Koike, P.Vorderwisch, and J.-H.Chung. Physical Review Letters 94 177202 (2005)
- (17) A.Zheludev, T.Masuda, B.Sales, D.Mandrus, T.Papenbrock, T.Barnes, and S.Park. Physical Review B 69 144417 (2004)
- (18) L.P.Regnault, A.Zheludev, M.Hagiwara, A.Stunault. Physical Review B 73 174431 (2006)
- (19) M. Hagiwara, Y. Narumi, K. Kindo, H. Nakano, M. Kohno, R. Sato, M. Takahashi. Journ. Magn. Magnetic Materials 272-276 876 (2004)
- (20) Y.Narumi, K.Kindo, M.Hagiwara, H.Nakano, A.Kawaguchi, K.Okunishi and M.Kohno. Physical Review B 69 174405 (2004)
- (21) M.Hagiwara, H.Tsujii, C.R.Rotundu, B.Andraka, Y.Takano, N.Tateiwa, T.C.Kobayashi, T.Suzuki, and S.Suga. Physical Review Letters 96, 147203 (2006)
- (22) N. Tateiwa, M. Hagiwara, H. Aruga-Katori, T. C. Kobayashi. Physica B 329-333 1209 (2003).
- (23) A.Abragam, B.Bleaney, Electron paramagnetic resonance of transition ions.