High luminosity, slow ejecta and persistent carbon lines:
SN 2009dc challenges thermonuclear explosion scenarios.
Abstract
Extended optical and near-IR observations reveal that SN 2009dc shares a number of similarities with normal Type Ia supernovae (SNe Ia), but is clearly overluminous, with a (pseudo-bolometric) peak luminosity of [erg s]. Its light curves decline slowly over half a year after maximum light (), and the early-time near-IR light curves show secondary maxima, although the minima between the first and the second peaks are not very pronounced. The bluer bands exhibit an enhanced fading after 200 d, which might be caused by dust formation or an unexpectedly early IR catastrophe. The spectra of SN 2009dc are dominated by intermediate-mass elements and unburned material at early times, and by iron-group elements at late phases. Strong C ii lines are present until 2 weeks past maximum, which is unprecedented in thermonuclear SNe. The ejecta velocities are significantly lower than in normal and even subluminous SNe Ia. No signatures of CSM interaction are found in the spectra. Assuming that the light curves are powered by radioactive decay, analytic modelling suggests that SN 2009dc produced of 56Ni assuming the smallest possible rise time of 22 d. Together with a derived total ejecta mass of , this confirms that SN 2009dc is a member of the class of possible super-Chandrasekhar-mass SNe Ia similar to SNe 2003fg, 2006gz and 2007if. A study of the hosts of SN 2009dc and other superluminous SNe Ia reveals a tendency of these SNe to explode in low-mass galaxies. A low metallicity of the progenitor may therefore be an important pre-requisite for producing superluminous SNe Ia. We discuss a number of possible explosion scenarios, ranging from super-Chandrasekhar-mass white-dwarf progenitors over dynamical white-dwarf mergers and Type I SNe to a core-collapse origin of the explosion. None of the models seem capable of explaining all properties of SN 2009dc, so that the true nature of this SN and its peers remains nebulous.
keywords:
supernovae: general – supernovae: individual: SN 2009dc – supernovae: individual: SN 2007if – supernovae: individual: SN 2006gz – supernovae: individual: SN 2003fg – galaxies: individual: UGC 10064 – galaxies: individual: UGC 10063.1 Introduction
Owing to their remarkable homogeneity in peak luminosity and light-curve shape, Type Ia supernovae (SNe Ia) are considered excellent tools to measure luminosity distances in the Universe, suitable to constrain possible cosmologies also beyond the converged CDM model (e.g. Leibundgut, 2001). In particular, with sufficiently precise observations of SNe Ia at low and high redshift the expansion history of the Universe can be reconstructed and a possible time evolution of Dark Energy can be probed (e.g. Riess et al., 2007).
Thanks to extensive observational campaigns and sophisticated modelling efforts over the past decade, some convergence has been achieved about the origin of ‘normal’ SNe Ia. There is a widespread consensus on the single-degenerate (SD) scenario of a white dwarf (WD) accreting matter from a non-degenerate companion until it approaches the Chandrasekhar mass () and ignites carbon near its centre. This leads to a thermonuclear runaway disrupting the star (e.g. Hillebrandt & Niemeyer, 2000). Since the explosions always occur close to , this scenario provides a natural explanation for the observed homogeneity among ‘normal’ SNe Ia. Within this picture the ratio of nuclear-statistical-equilibrium (NSE) material to intermediate-mass elements (IME) in the ejecta is likely the key parameter for both the width of the SN light curve (through the opacity generated by Fe-group elements) and its peak luminosity (through the radioactive decay of 56Ni; Pinto & Eastman 2001; Mazzali et al. 2001, 2007).
However, this emerging picture has recently been challenged by the discovery of a handful of objects whose properties cannot readily be explained within the framework (Howell et al., 2006; Branch, 2006; Hicken et al., 2007; Yamanaka et al., 2009). These SNe are characterised by high peak luminosities, a factor 2 larger than in all other SNe Ia (). At the same time, apart from their comparatively low ejecta velocities they share strong spectroscopic similarity with ordinary SNe Ia. To explain the early light curves of these events within spherical symmetry, a 56Ni mass exceeding 1 and a total ejecta mass in excess of 1.4 are required (Howell et al., 2006). The explosion of a super- WD stabilised by strong differential rotation (Howell et al., 2006; Branch, 2006), or a merger of two WDs, in sum again exceeding (Hicken et al., 2007), have been suggested as possible scenarios. However, Hillebrandt et al. (2007) and Sim et al. (2007) argued that these events could possibly be consistent with -WD explosions if strong deviations from spherical symmetry are invoked, with the ignition point located far off-centre and the 56Ni distribution being very one-sided. Alternatively, energy sources other than radioactivity may have to be considered.
Understanding superluminous SNe Ia is not only a merit by its own, but has important implications for cosmology. Spectroscopically similar to ordinary SNe Ia, some of these events may have entered into the cosmological SN Ia data sets, especially at high where they are favoured by their luminosity and where the data quality is mostly poor. Moreover, while they are apparently rare in the present Universe, without a better knowledge of their progenitors and explosion mechanisms it cannot be ruled out that superluminous SNe Ia were more abundant in the past. Since they may not obey the light-curve width – luminosity relations used to standardise SNe Ia, they may introduce systematic errors in the reconstruction of using SN data.
With the observations of SN 2009dc presented in this work, a comprehensive optical and near-IR data set of a superluminous SN Ia becomes available, extending observations of the same SN presented by Yamanaka et al. (2009) and Silverman et al. (2011) in both temporal and wavelength coverage. This allows us to study the properties and evolution of one member of this class in unprecedented detail, and to put constraints on possible explosion scenarios. The paper is organised as follows: in Section 2 the observations are presented and the techniques applied for data reduction and calibration are discussed. Sections 3 and 4 are devoted to the analysis of the photometric and spectroscopic evolution of SN 2009dc, respectively. Important physical properties of SN 2009dc and possible explosion mechanisms are discussed in Section 5, before a brief summary of our main results is given in Section 6.
2 Observations and data reduction
SN 2009dc was discovered in the course of the Puckett Observatory Supernova Search on UT 2009 April 9.31 at an unfiltered magnitude of , and confirmed on unfiltered exposures on April 10.42 at a magnitude of (Puckett, Moore & Newton, 2009). No object was visible at the SN position on images taken by T. Puckett on 2009 March 21 to a limiting magnitude of . A classification spectrum taken with the Telescopio Nazionale Galileo + DOLORES on UT 2009 April 16.22 revealed that SN 2009dc was a Type Ia supernova well before maximum light (Harutyunyan, Elias-Rosa & Benetti, 2009). The SN was reported to share similarity with SN 2006gz (Hicken et al., 2007) at pre-maximum phases in most spectral features, including prominent C ii absorption lines, but lower expansion velocities. The presence of carbon and the resemblance to suspected super- SNe Ia such as SN 2003fg (Howell et al., 2006) was confirmed by Marion, Garnavich & Challis (2009) based on optical and IR spectra obtained on UT 2009 April 18 and 19. Yamanaka et al. (2009) measured a peak absolute magnitude of MV,max and a slow light-curve decline of , and estimated an ejected 56Ni mass of at least . They concluded that the spectrophotometric properties of SN 2009dc are consistent with the explosion of a super- WD. In spectropolarimetric observations presented by Tanaka et al. (2010), SN 2009dc shows moderately strong polarisation in Si ii and Ca ii lines, but small continuum polarisation indicative of spherical symmetry on global scales. The authors consider this as support for the explosion scenario suggested by Yamanaka et al. (2009).
2.1 Distance and extinction
SN 2009dc is located in the outskirts of the S0 galaxy UGC 10064 (but see
Section 5.4 for an in-depth discussion on the host-galaxy
interaction with the late-type UGC 10063, and the expected stellar population),
at a redshift of (NED111NASA/IPAC Extragalactic Database
http://nedwww.ipac.caltech.edu/). This is well within
the Hubble flow, and a kinematic distance modulus of mag
is assumed, based on the average recession velocity of UGC 10064 and UGC 10063
corrected for local flow patterns (see Table 1 for details).
The extinction towards SN 2009dc is subject to some uncertainty. Narrow Na i D absorption lines can be discerned in the spectra both at zero redshift and the host-galaxy rest frame, suggesting a non-negligible amount of dust in the line of sight. The respective equivalent widths are and Å, measured from thirteen early-time spectra. Application of the formula of Turatto, Benetti & Cappellaro (2003) yields colour excesses of and mag in the Milky Way and the host galaxy, respectively. Alternatively, consulting the Schlegel, Finkbeiner & Davis (1998) dust maps suggests a foreground extinction of mag towards UGC 10064, and we adopt this value for the Galactic component. In ‘normal’ SNe Ia the colours measured at peak or during the tail phase are used to infer the total reddening caused by dust (e.g. Phillips et al., 1999). However, as will be shown in Section 3.1, the colour evolution of SN 2009dc differs significantly from that of ordinary SNe Ia, so that these methods cannot be applied with any confidence. Given the high luminosity of SN 2009dc and its blue early-time colours already before correcting for any host reddening, we rather consider the value derived from the interstellar Na i D lines as an upper limit for the actual host-galaxy colour excess. In the further analysis we therefore adopt a host-galaxy colour excess of mag as our best estimate, 50 per cent larger than the Galactic colour excess as motivated by the ratio of the Na i D lines. Despite our multi-wavelength coverage, the unknown intrinsic colours of the SN also prevent us from determining the dust properties directly. We therefore adopt a Cardelli, Clayton & Mathis (1989) reddening law with , assuming dust properties not too different from those in the Galaxy222Adopting a lower value for the host-galaxy reddening of e.g. as suggested by Wang et al. (2009a) for normal SNe Ia would reduce the inferred extinction in (and hence the peak luminosity calculated in Section 3.2) by 7 per cent..
Details on the SN, the presumed host galaxy UGC 10064 and its interacting companion UGC 10063 are summarised in Table 1.
| SN 2009dc | ||
|---|---|---|
| (J2000) | 15h51m1210 | 1 |
| (J2000) | +25°42′285 | 1 |
| offset from UGC 10064 nucleus | 158 W, 208 N | 1 |
| host reddening | mag | 2 |
| true | 2 | |
| JDmax,U | 2 | |
| JDmax,B | 2 | |
| JDmax,V | 2 | |
| JDmax,R | 2 | |
| JDmax,I | 2 | |
| 2 | ||
| 2 | ||
| 2 | ||
| 2 | ||
| 2 | ||
| MU,max | 2 | |
| MB,max | 2 | |
| MV,max | 2 | |
| MR,max | 2 | |
| MI,max | 2 |
| UGC 10064 | ||
|---|---|---|
| (J2000) | 15h51m1328 | 3 |
| (J2000) | +25°42′075 | 3 |
| redshift | 4 | |
| km s-1 | 4 | |
| km s-1 | 4 | |
| km s-1 | 4 | |
| distance modulus | mag | 4 |
| extinction-corr. app. mag | 3 | |
| absolute magnitude | 3,4 | |
| morphological typed | S0, | 3 |
| Galactic reddening | mag | 5 |
| UGC 10063 | ||
|---|---|---|
| (J2000) | 15h51m0851 | 3 |
| (J2000) | +25°43′215 | 3 |
| redshift | 4 | |
| km s-1 | 4 | |
| km s-1 | 4 | |
| km s-1 | 4 | |
| distance modulus | mag | 4 |
| extinction-corr. app. vis. mag | 4 | |
| absolute vis. magnitude | 4 | |
| morphological typed | SBd, | 3 |
| Galactic reddening | mag | 5 |
2.2 Reduction of photometric data
The reduction of optical photometric data (bias subtraction, overscan correction and flat-fielding) was performed using standard routines in iraf333iraf is distributed by the National Optical Astronomy Observatories, which are operated by the Association of Universities for Research in Astronomy, Inc, under contract to the National Science Foundation.. In the near-IR, an in-field dithering strategy allowed for the creation of source-free sky images, which were subtracted from the individual scientific images to eliminate the strong near-IR sky emission. Sub-exposures taken with the same filter during one night were aligned and combined before the photometric measurements were performed.
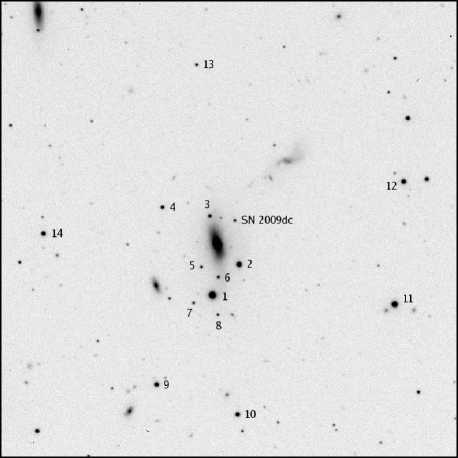
A sequence of field stars (Fig. 1) was calibrated with respect to Landolt (1992, for ) and Arnica (Hunt et al., 1998, for ) standard fields on several photometric nights. The calibrated magnitudes of these field stars, listed in Table 2, were used to determine the SN magnitudes under non-photometric conditions. For the six local standards we have in common, our magnitudes are consistent with those reported by Silverman et al. (2011), with average systematic differences ranging from 0.008 mag ( band) to 0.015 mag ( band).
| ID | ||||||||
|---|---|---|---|---|---|---|---|---|
| 1 | ||||||||
| 2 | ||||||||
| 3 | ||||||||
| 4 | ||||||||
| 5 | ||||||||
| 6 | ||||||||
| 7 | ||||||||
| 8 | ||||||||
| 9 | ||||||||
| 10 | ||||||||
| 11 | ||||||||
| 12 | ||||||||
| 13 | ||||||||
| 14 |
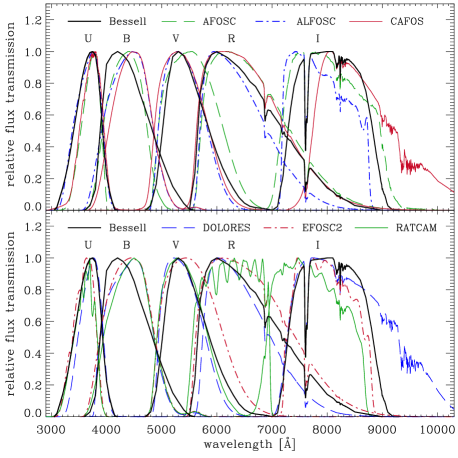
All SN measurements were done with point-spread function (PSF) fitting photometry using the software package snoopy, a dedicated tool for SN photometry written by F. Patat and implemented in iraf by E. Cappellaro. Measurement errors were estimated through an artificial star experiment. Since instruments with very different passbands were used for the follow-up of SN 2009dc (see Fig. 2), we made use of the ‘-correction’ technique (Stritzinger et al., 2002; Pignata et al., 2004) to calibrate the SN magnitudes to the standard photometric system of Johnson and Cousins (Bessell, 1990) in the optical bands. Our excellent spectroscopic coverage enabled the computation of the -correction solely on the basis of SN 2009dc spectra. In the same manner, a -correction was derived to compensate for the non-negligible redshift of SN 2009dc. At epochs where no spectra were available, the - and -correction terms were determined by linear interpolation or constant extrapolation. No - and -correction was applied in the near-IR bands, where the SN magnitudes were calibrated with first-order colour-term or simple zero-point corrections.
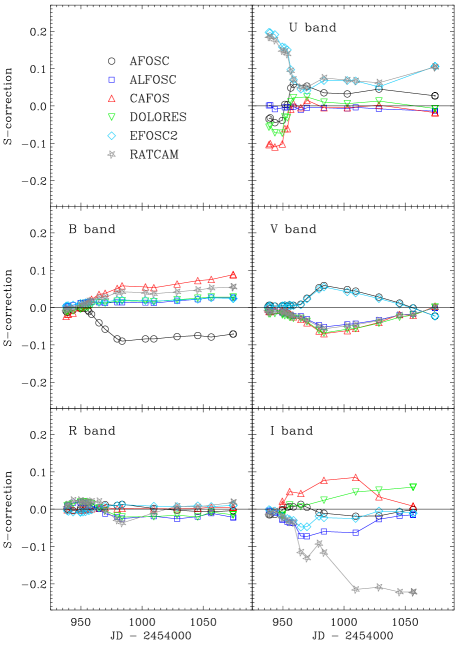
In Table 3 the fully calibrated - and -corrected Bessell magnitudes of SN 2009dc are reported. The uncertainties in brackets are the quadratic sums of the measurement errors and the uncertainties in the photometric zero points of the nights. Table 8 lists the - and -correction separately, meant as the quantity added to the zero-point calibrated magnitudes instead of a colour-term correction. The temporal evolution of the -correction for the different instruments is shown in Fig. 3. The colour-term corrected magnitudes and their uncertainties (determined analogously to the optical bands) are shown in Table 4.
| JDa | Epochb | Telescope | Seeingc | |||||
|---|---|---|---|---|---|---|---|---|
| 935.47 | JN | 3.16 | ||||||
| 937.49 | EP1 | 4.90 | ||||||
| 938.66 | NOT | 0.89 | ||||||
| 939.50 | JN | 2.96 | ||||||
| 939.69 | NOT | 0.70 | ||||||
| 942.44 | JN | 3.16 | ||||||
| 942.53 | LT | 1.84 | ||||||
| 943.49 | NOT | 2.03 | ||||||
| 944.57 | LT | 1.42 | ||||||
| 946.49 | JN | 3.16 | ||||||
| 949.53 | CA | 2.54 | ||||||
| 949.54 | TNG | 1.02 | ||||||
| 949.62 | LT | 1.37 | ||||||
| 950.63 | LT | 1.51 | ||||||
| 951.58 | CA | 1.70 | ||||||
| 953.68 | TNG | 1.32 | ||||||
| 954.41 | JN | 3.57 | ||||||
| 954.49 | LT | 1.70 | ||||||
| 955.50 | CA | 1.11 | ||||||
| 956.42 | LT | 1.56 | ||||||
| 956.48 | NOT | 0.82 | ||||||
| 958.63 | NOT | 0.55 | ||||||
| 959.65 | LT | 1.95 | ||||||
| 959.69 | NOT | 1.25 | ||||||
| 963.52 | LT | 1.31 | ||||||
| 964.41 | LT | 1.90 | ||||||
| 964.70 | TNG | 1.35 | ||||||
| 966.43 | LT | 1.37 | ||||||
| 968.56 | LT | 1.34 | ||||||
| 969.71 | NTT | 1.30 | ||||||
| 970.37 | JN | 2.96 | ||||||
| 970.37 | EP2 | 3.17 | ||||||
| 972.39 | JN | 3.16 | ||||||
| 973.47 | NOT | 1.46 | ||||||
| 976.52 | NOT | 0.59 | ||||||
| 977.38 | JN | 3.16 | ||||||
| 977.43 | Ekar | 2.84 | ||||||
| 978.59 | Ekar | 2.65 | ||||||
| 981.44 | LT | 1.37 | ||||||
| 982.62 | CA | 1.75 | ||||||
| 983.41 | LT | 1.28 | ||||||
| 987.54 | LT | 1.06 | ||||||
| 988.53 | NOT | 0.46 | ||||||
| 991.54 | LT | 1.42 | ||||||
| 995.43 | LT | 1.34 | ||||||
| 995.60 | NOT | 0.95 | ||||||
| 1006.46 | LT | 1.17 | ||||||
| 1007.48 | NOT | 0.65 | ||||||
| 1009.56 | LT | 1.48 | ||||||
| 1013.43 | LT | 1.34 | ||||||
| 1016.53 | TNG | 1.24 | ||||||
| 1021.42 | LT | 1.40 | ||||||
| 1022.43 | NOT | 0.65 | ||||||
| 1025.43 | LT | 1.26 | ||||||
| 1028.57 | NTT | 1.92 | ||||||
| 1032.42 | LT | 1.51 | ||||||
| 1033.42 | LT | 1.87 | ||||||
| 1034.42 | LT | 1.40 | ||||||
| 1037.41 | NOT | 1.29 | ||||||
| 1037.42 | LT | 1.73 | ||||||
| 1043.46 | CA | 1.22 | ||||||
| 1047.52 | LT | 1.45 | ||||||
| 1052.46 | LT | 1.73 |
| JDa | Epochb | Telescope | Seeingc | |||||
|---|---|---|---|---|---|---|---|---|
| 1056.37 | CA | 1.54 | ||||||
| 1056.40 | NOT | 0.68 | ||||||
| 1061.38 | Ekar | 1.70 | ||||||
| 1063.34 | Ekar | 1.51 | ||||||
| 1063.39 | LT | 1.59 | ||||||
| 1065.38 | LT | 1.37 | ||||||
| 1066.40 | LT | 1.28 | ||||||
| 1072.36 | CA | 1.27 | ||||||
| 1073.38 | LT | 1.12 | ||||||
| 1077.44 | LT | 1.17 | ||||||
| 1079.39 | CA | 2.70 | ||||||
| 1084.39 | LT | 1.14 | ||||||
| 1086.36 | LT | 1.09 | ||||||
| 1092.39 | LT | 1.95 | ||||||
| 1098.35 | LT | 1.17 | ||||||
| 1113.35 | LT | 0.95 | ||||||
| 1116.34 | LT | 1.34 | ||||||
| 1209.75 | NOT | 0.74 | ||||||
| 1247.85 | NTT | 1.34 | ||||||
| 1260.83 | NTT | 1.25 | ||||||
| 1263.90 | NTT | 1.03 | ||||||
| 1275.69 | NOT | 1.27 | ||||||
| 1409.48 | TNG | 0.75 |
| JDa | Epochb | Telescope | Seeingc | |||
|---|---|---|---|---|---|---|
| 941.68 | TNG-N | 1.43 | ||||
| 947.81 | REM | 3.24 | ||||
| 952.72 | REM | 2.76 | ||||
| 954.70 | TNG-N | 1.15 | ||||
| 963.55 | NOT-N | 0.68 | ||||
| 967.56 | REM | 3.36 | ||||
| 969.78 | NTT-S | 0.78 | ||||
| 993.61 | REM | 3.00 | ||||
| 1031.41 | TNG-N | 0.83 | ||||
| 1057.48 | NTT-S | 1.12 | ||||
| 1212.06 | LBT | 1.55 | ||||
| 1213.02 | LBT | 0.53 | ||||
| 1305.84 | NTT-S | 1.29 |
2.3 Reduction of spectroscopic data
| JDa | Epochb | Exposure time [s] | Telescopec | Grism / Grating | Range [Å] | Res. [Å]d |
|---|---|---|---|---|---|---|
| 937.7 | 1500 | TNG | LR-B | 3200 – 7900 | 10 | |
| 938.6 | 1500 | NOT | gm4 | 3200 – 9100 | 13 | |
| 939.7 | 900 | NOT | gm4 | 3200 – 9100 | 13 | |
| 941.7 | 1800 2 | TNG-N | IJ,HK | 8650 – 24700 | 18,36 | |
| 943.5 | 900 | NOT | gm4 | 3200 – 9100 | 14 | |
| 949.5 | 900 2 | TNG | LR-B,LR-R | 3200 – 9750 | 13 | |
| 949.6 | 1800 2 | CA | b200,r200 | 3300 – 10200 | 10 | |
| 951.6 | 2400 | CA | b200 | 3200 – 8750 | 10 | |
| 953.7 | 900 2 | TNG | LR-B,LR-R | 3250 – 9750 | 10 | |
| 954.7 | 1800 2 | TNG-N | IJ,HK | 8650 – 24700 | 18,36 | |
| 955.5 | 1800 2 | CA | b200,r200 | 3250 – 10300 | 9 | |
| 956.5 | 900 | NOT | gm4 | 3250 – 9100 | 14 | |
| 958.6 | 900 | NOT | gm4 | 3250 – 9100 | 14 | |
| 959.6 | 600 3 | NOT | gm4 | 3300 – 9100 | 13 | |
| 964.7 | 900 2 | TNG | LR-B,LR-R | 3200 – 9600 | 10 | |
| 969.7 | 900 2 | NTT | gm11,gm16 | 3350 – 9500 | 14 | |
| 970.8 | 3240 + 3000 | NTT-S | GB,GR | 9350 – 25000 | 23,32 | |
| 979.5 | 2400 + 2000 | Ekar | gm4,gm2 | 3600 – 9200 | 24,34 | |
| 983.6 | 2100 2 | CA | b200,r200 | 3300 – 10300 | 10 | |
| 1002.6 | 2100 | TNG | LR-B | 3400 – 7900 | 14 | |
| 1009.5 | 2400 2 | CA | b200,r200 | 3400 – 10300 | 10 | |
| 1028.5 | 1800 2 | NTT | gm11,gm16 | 3400 – 9500 | 21 | |
| 1031.5 | 3600 + 5760 | TNG-N | IJ,HK | 8650 – 24700 | 18,36 | |
| 1045.4 | 3600 2 | CA | b200,r200 | 3600 – 10000 | 10 | |
| 1056.5 | 4800 / 2700 2 | NOT / CA | gm4 / r200 | 3650 – 10000 | 17,11 | |
| 1074.4 | 2700 4 | CA | b200 | 3400 – 8750 | 12 | |
| 1112.3 | 3600 2 | CA | b200 | 3500 – 8750 | 12 |
An overview of our spectroscopic observations of SN 2009dc is given in Table 5. All spectra were taken with the slit along the parallactic angle to avoid differential flux losses (Filippenko, 1982). The reduction of the optical data followed standard procedures. The two-dimensional spectroscopic frames were debiased and flat-fielded, before an optimal, variance-weighted extraction of the spectra (Horne, 1986) was performed using the iraf routine apall. Wavelength calibration was accomplished with the help of arc-lamp exposures and checked against isolated night-sky lines. Second-order contamination in the spectra taken with NOT + ALFOSC was eliminated following the method of Stanishev (2007). The instrumental response functions were determined from observations of spectrophotometric standard stars (Oke, 1990; Hamuy et al., 1992, 1994). An atmospheric extinction correction was applied using tabulated extinction coefficients for each observatory. Telluric features were identified in the smooth spectra of the spectrophotometric standard stars and removed from the SN spectra. To check the flux calibration of the spectra, synthetic photometry was computed using Bessell (1990) passbands. If necessary, the spectral fluxes were adjusted to match the contemporaneous photometry. Finally, spectra obtained during the same night (at late phases also in subsequent nights) were combined to increase the signal-to-noise ratio (S/N); if the wavelength range of these spectra was different, they were averaged in their overlap region.
The reduction of our near-IR spectra mostly followed the procedure described for the optical bands, with a few noticeable differences. The total integration time in the near IR was split into several sub-exposures, with the target off-set along the slit. Subsequent exposures could thus be subtracted from each other to remove the sky emission. After extraction and wavelength-calibration the SN spectra were divided by those of a telluric A0 standard star taken at similar airmass to remove telluric absorptions, and multiplied by a Vega spectrum to provide a relative flux calibration. Proper absolute flux calibration was achieved by comparison with contemporaneous photometry.
3 Photometric evolution
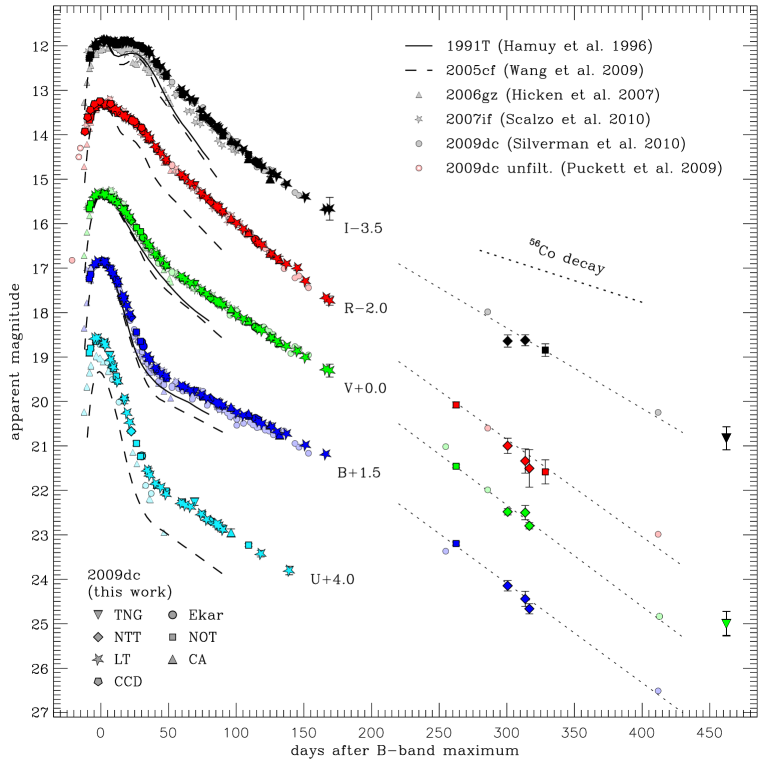
Figure 4 shows that our photometry of SN 2009dc is generally in good agreement with that published by Silverman et al. (2011). There are some systematic discrepancies in the band and – at more advanced epochs – in the band, which we attribute to missing - and -corrections in the Silverman et al. data. With absolute peak magnitudes between and in the optical bands, SN 2009dc is roughly a factor 2 more luminous than the bulk of SNe Ia, and also slightly more luminous than the possible super- SNe 2003fg (Howell et al., 2006) and 2006gz (Hicken et al., 2007).
Morphologically, the light curves of SN 2009dc resemble those of other SNe Ia. In the and probably also the bands, a secondary light-curve maximum exists, delayed by 25 d with respect to the peak in . The immediate post-maximum decline is faster in the bluer bands, accompanied by a strong evolution towards redder colours within the first month after peak.
However, compared to other SNe Ia the evolution of the light curves is very slow, both during the rise and the decline. With an unfiltered discovery magnitude of 16.5 (Puckett et al., 2009) on April 9.3, SN 2009dc was only 1.2 mag below peak more than 16 d before -band maximum light. Silverman et al. (2011) reported a detection of SN 2009dc at 3.5 mag below peak in an even earlier, unfiltered image taken with KAIT on April 4, 21.2 d before -band maximum. This is clearly longer than the canonical rise time of SNe Ia of 17–20 d (Riess et al., 1999; Conley et al., 2006; Strovink, 2007; Hayden et al., 2010). Silverman et al. (2011) also mentioned a non-detection in an unfiltered image taken on March 28, 28 d before -band maximum, to a limiting magnitude of 19.3. The rise time of SN 2009dc is therefore at least 22 d, but probably not more than 30 d.
With a polynomial fit to the -corrected -band light curve of SN 2009dc, a of is inferred. Correcting for the effect of reddening (Phillips et al., 1999), this turns into . Yamanaka et al. (2009) reported a of , marginally consistent with our result within the uncertainties, whereas Silverman et al. (2011) derived , in excellent agreement with our value. This decline rate is among the lowest ever measured for SNe Ia, similar to those of SNe 2006gz (0.69; Hicken et al. 2007) and 2007if (0.71; Scalzo et al. 2010).
The decline of the -band light curve is remarkably linear for more than 300 d after maximum, with only a slight shoulder after one month. The first and second maximum in the band are almost equally bright. However, the minimum in between is not very pronounced, and with 25 d the offset of the two maxima is not particularly large. This is similar to the situation in SN 2006gz, but contrary to the trend of more pronounced and delayed secondary maxima that is observed in other SNe Ia with small (Hamuy et al., 1996). Moreover, the first -band maximum does not precede those in the bluer band as in other luminous SNe Ia, but is slightly delayed. This behaviour is reminiscent of subluminous SNe Ia. However, in the latter it appears to be a consequence of the small 56Ni mass (Kasen, 2006), which cannot be the reason in SN 2009dc. Alternatively, 56Ni could be more strongly mixed (Kasen, 2006), but this is disfavoured by the long rise time and the weak line blanketing in the UV part of early spectra, indicative of little Fe-group material in the outer shells (c.f. Section 4.1).
The late-time photometric behaviour of SN 2009dc deserves special attention after the lesson taught by SN 2006gz (Maeda et al., 2009): the slow decline of the light curves of SN 2006gz soon after peak must have been followed by a rapid drop at later times, when the SN was too close to the Sun to be observed. An attempt to recover the SN photometrically one year after maximum failed, and the derived upper limits indicate a faster average post-maximum decline than observed in normal SNe Ia (Maeda et al., 2009). In SN 2009dc, no accelerated decline is seen until 180 d after peak. The decline rates between 60 and 170 d, ranging from mag (100 d)-1 in to mag (100 d)-1 in (c.f. Table 6), are comparable to those of normal SNe Ia. However, thereafter the situation changes completely. While the -band light curve continues its linear decline from earlier phases, the bluer bands now show a much more rapid fading than before, with decline rates very similar to that in (Table 6). This behaviour is at odds with both that of normal SNe Ia and the expectation that around 300 d the (bolometric) decline rate should slow down and approach the 56Co decay rate of 0.98 mag (100 d)-1, since the ejecta are then fully transparent to -rays, but still mostly opaque to positrons. There are hints that the decline might eventually slow down more than 400 d after the explosion. However, this very late decline rate is very uncertain, since our last photometric measurement might be contaminated by host-galaxy light or background sources. The discrepancy between expectation and observation is addressed again when studying the pseudo-bolometric light curve in Section 3.2, and possible reasons are discussed in Section 5.2.
| Intervala | |||||
|---|---|---|---|---|---|
| 60–170 d | 1.94 | 1.42 | 1.95 | 2.62 | 2.59 |
| 150–330 d | 2.19 | 2.28 | 2.48 | 2.04 | |
| 260–330 d | 2.59 | 2.30 | 2.40 | ||
| 260–460 d | 1.69 | 1.42 |
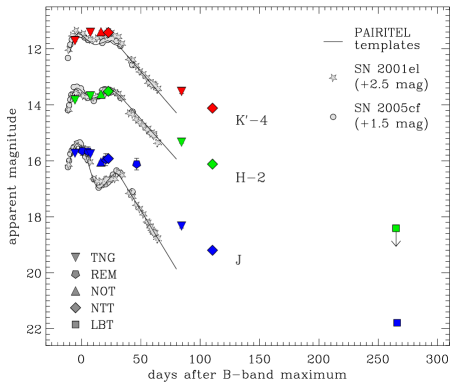
In the bands (Fig. 5), the paucity of observations makes an analysis of the light curves less robust. Nevertheless, in all three bands the secondary maximum seems to be particularly bright, whereas the first maximum is weak () or degraded to a shoulder (). The steep decline in characteristic for normal SNe Ia after the first peak is almost entirely absent in SN 2009dc. Since the majority of the flux in the near IR is caused by fluorescence (e.g. Kromer & Sim, 2009), the lack of emission compared to ordinary SNe Ia around the time of -band maximum suggests less flux re-distribution from the blue and UV part of the spectrum to redder wavelengths. This is in agreement with a high UV flux until 10 d after maximum light as also reported by Silverman et al. (2011), and a strong fading in the UV thereafter. After the secondary peak, the light curves of SN 2009dc decline more slowly than those of ordinary SNe Ia, and it was possible to recover the SN in deep -band images taken at the LBT 266 d after -band maximum light. Note that with peak absolute magnitudes of about to , SN 2009dc is overluminous also in , and . It does not follow the behaviour of normal SNe Ia, which are nearly standard candles in the near IR (with M to ; Krisciunas et al., 2004; Wood-Vasey et al., 2008).
3.1 Colour evolution
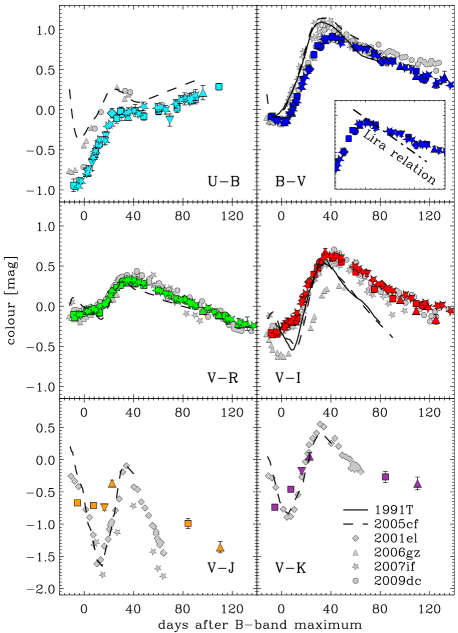
Figure 6 presents the time-evolution of the , , and colours of SN 2009dc. The basic behaviour of these curves appears typical of a SN Ia, starting with relatively blue colours before and around maximum light, turning redder until 40 d thereafter, and then again evolving towards bluer colours (except for which monotonically becomes redder). However, at a higher level of detail differences become evident. The early colour of SN 2009dc is unusually blue because of little UV line blanketing and the weakness of Ca ii H&K (c.f. Section 4.1). In normal SNe Ia, the and colours are bluest around and immediately after maximum light, whereas in SN 2009dc they monotonically turn redder from the start of our observations until 40 d after maximum light. Even more importantly, SN 2009dc does not conform with the uniform colour evolution of other SNe Ia between 30 and 90 d after maximum, known as the Lira relation (Lira, 1995; Phillips et al., 1999). Instead, its colour evolves much more slowly, and is redder than predicted by the Lira relation by almost 0.3 mag at 90 d. Hence, for SN 2009dc, none of the colour criteria usually used to estimate the reddening in SNe Ia can be employed confidently.
Note that the colour evolution of SN 2009dc shares more similarities with those of SNe 2006gz and 2007if than with the bulk of SNe Ia (Fig. 6), suggesting that some of the observed colour characteristics may be generic for superluminous SNe Ia.
3.2 Bolometric light curve
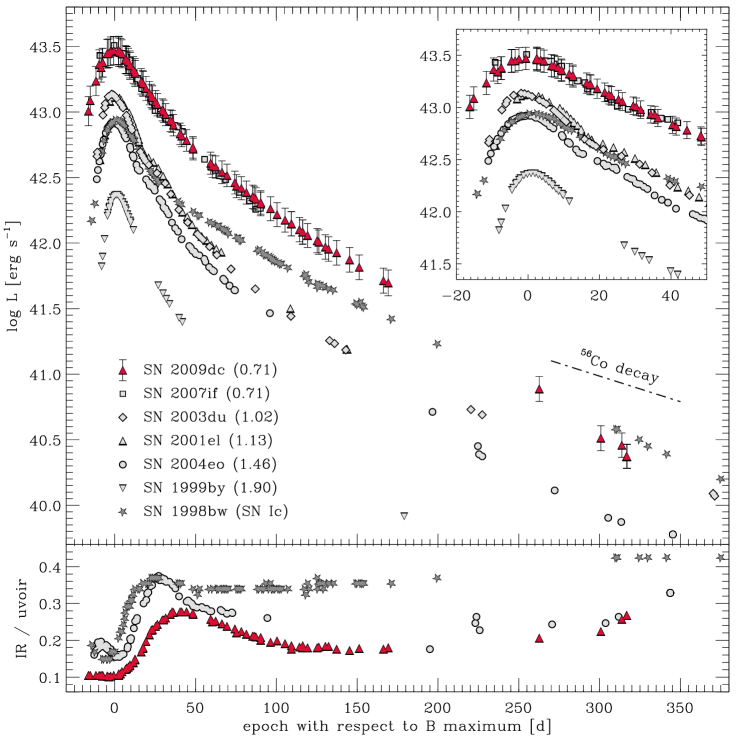
A pseudo-bolometric light curve (see, e.g., Nomoto, Filippenko & Shigeyama, 1990) of SN 2009dc was constructed from our filtered photometry. To this aim, the -through--band magnitudes were first converted into monochromatic fluxes. The spectral energy distribution (SED) was then interpolated linearly and integrated over wavelength, assuming zero flux at the blue edge of the band and the red edge of the band. In case of missing data, a NIR correction to the -through- light curve was estimated by interpolation between adjacent epochs with NIR data. At very late phases, constant - and colours were assumed. We find a NIR contribution to the pseudo-bolometric light curve of 10 per cent around maximum light, 28 per cent 40 d after maximum, and 20 per cent 100 d after maximum. Compared to ordinary SNe Ia and core-collapse SNe, this NIR contribution in SN 2009dc is quite low (Fig. 7, bottom panel). Wavelength regions other than the optical and near-IR are believed to contribute very little to the total bolometric flux in SNe Ia (Contardo, Leibundgut & Vacca, 2000), and are neglected here.444Actually, owing to the relatively high UV flux in SN 2009dc indicated by its very blue early-time spectra, the mid and far UV could have a non-negligible effect on the pre-maximum bolometric light curve. Unfortunately, the SWIFT UVOT photometry presented by Silverman et al. (2011) only starts at maximum light, when the contribution of these bands has dropped below the 10 per cent level. The resulting quasi-bolometric light curve of SN 2009dc is shown in Fig. 7 (top panel), along with those of the normal Type Ia SNe 2003du (Stanishev et al., 2007a, = 1.02), 2001el (Krisciunas et al., 2003, = 1.13) and 2004eo (Pastorello et al., 2007b, = 1.46), the subluminous SN Ia 1999by (Garnavich et al., 2004, = 1.90), the superluminous SN Ia 2007if (Scalzo et al., 2010, = 0.71) and the Type Ic hypernova 1998bw (Galama et al., 1998; McKenzie & Schaefer, 1999; Sollerman et al., 2000; Patat et al., 2001). Neither SN 1998bw, which is one of the most luminous non-interacting core-collapse SNe known to date (with about 0.4 of 56Ni synthesised; Maeda et al. 2006), nor any of the classical SNe Ia can compete with SN 2009dc in terms of luminosity. With [erg s-1], SN 2009dc outshines ordinary SNe Ia by a factor at peak555For the same assumption on the host-galaxy reddening [host = 0.10 mag], Silverman et al. (2011) derive a peak bolometric luminosity of [erg s-1]. Based on a slightly larger host reddening [host = 0.14 mag] Yamanaka et al. (2009) obtain [erg s-1]. Both results are in agreement with our estimate., and the difference increases during the first 150 d past maximum. Only SN 2007if keeps up with SN 2009dc, showing a strikingly similar bolometric light curve. After the peak phase, SNe generally have a decline rate which is significantly faster than the 56Co decay. The reason for this behaviour is an increasing escape fraction of -rays due to decreasing opacities. SN 2009dc also shows this behaviour, but fades more slowly than normal SNe Ia until 150 d past maximum. This is an indication for a larger -ray opacity, caused by the low ejecta velocities or by a larger ejecta mass. SN 1998bw has very massive ejecta (Maeda et al. 2006 estimated M ) and thus shows an even slower late-time decline.
However, as already noted in Section 3, the behaviour of SN 2009dc changes substantially 200–250 d after maximum. The decline of the pseudo-bolometric light curve becomes steeper than it was the months before. In fact, one year after the explosion, SN 2009dc is no longer more luminous than the normal SN Ia 2003du. Unfortunately, we do not have full wavelength coverage at those late phases (the pseudo-bolometric light curve is based on -through--band photometry), so that this statement must be taken with a grain of salt. Nevertheless, there is a clear flux deficit in the optical regime (out to the band) with respect to expectations based on an extrapolation from earlier epochs. It is unlikely that an increased - and -band flux could make up for this.
4 Spectroscopic evolution
4.1 Optical spectra

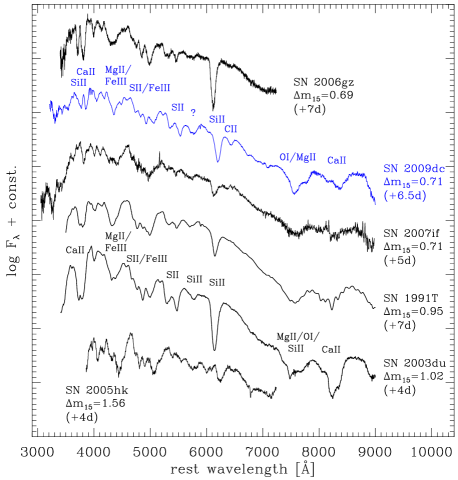
The optical spectra of SN 2009dc, presented in Fig. 8 show a transition from a blue pseudo-continuum with superimposed P-Cygni features at early phases to line-dominated emission after a few months. Throughout its evolution, SN 2009dc is characterised by comparatively narrow spectral features, indicating a small extension (in velocity space) of the line-formation zone, and resulting in reduced line blending compared to ordinary SNe Ia. In this respect, SN 2009dc resembles 02cx-like SNe Ia (Li et al., 2003), which have comparably low ejecta velocities. However, given that the latter are at least moderately subluminous, no direct conclusions on similar progenitors or explosion mechanisms can be drawn. In what follows, the spectra of SN 2009dc at several characteristic epochs will be described in more detail and compared with those of other normal and peculiar SNe Ia.
4.1.1 One week before maximum
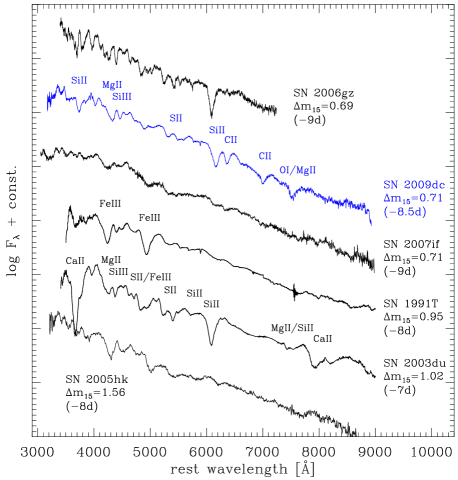
In the day spectrum of SN 2009dc (Fig. 9), lines of Si ii, Si iii, S ii, C ii, O i and possibly Mg ii can be identified. Compared to normal SNe Ia, represented by SN 2003du in Fig. 9, all features due to intermediate-mass elements appear shallower. In particular, the Ca ii lines, very prominent in SN 2003du, are weak. The Ca ii NIR triplet cannot be identified, and Ca ii H&K form merely a shoulder to the red of Si ii . The equivalent width (EW) of Si ii is only 44 Å, compared to 71 Å in SN 2003du. On the contrary, lines due to unburned material are very pronounced. While in most normal SNe Ia at best a hint of O i can be discerned at early phases (probably blended with Mg ii), the line is one of the strongest features in SN 2009dc. The same is true for C ii features (, ), which are only occasionally identified in very early SN Ia spectra (e.g. Thomas et al., 2007; Tanaka et al., 2008; Taubenberger et al., 2008), but are present at unprecedented strength in the day spectrum of SN 2009dc. The overall continuum shape is rather blue, and down to the blue cut-off of the spectrum at 3200 Å no severe flux depression due to blanketing of Fe-group lines is observed. In summary, lines from unburned material are strong in SN 2009dc at early phases, whereas all lines from burning products are relatively weak. Of course, line formation does not only depend on the composition, but also on the ionisation and excitation conditions, and indeed the weakness of lines from singly ionised IMEs and Fe-group elements could be explained by a high ionisation (supported also by the relative strength of Si iii ). However, the simultaneous strength of O i and the lack of detectable Fe iii lines do not favour this scenario. Instead, we believe that the composition of the line-formation zone at day is indeed dominated by unburned material.
With its spectral properties, SN 2009dc deviates from any of the established sub-classes of peculiar SNe Ia. The classical very luminous SN Ia 1991T is characterised by very high ionisation, the blue spectrum being dominated by prominent Fe iii lines and little else. In particular, lines from IMEs are very weak, and no features of C ii or O i are found. Contrary to the low-velocity SN 2009dc, the lines in SN 1991T are rather broad, and their blueshift is similar to that in normal SNe Ia. 02cx-like SNe like SN 2005hk show the same low ejecta velocities as SN 2009dc, but apart from that their early-time spectra closely resemble those of 91T-like objects.
A comparison with other superluminous SNe Ia reveals that SN 2007if has similar velocities as SN 2009dc, but apparently a higher ionisation. This results in much weaker lines from IMEs and unburned material and the presence of Fe iii lines. However, Fe iii in SN 2007if is not as strong as in SN 1991T, indicating that the ionisation is not quite as high, or the Fe-group-element abundance above the photosphere is lower. In SN 2006gz, on the contrary, the same features as in SN 2009dc are present (though with weaker C ii lines). Line blending seems to be even lower, and all features are sharp and pronounced. However, contrary to common sense these narrow lines do not correspond to particularly low velocities of the ejecta as determined from the blueshift of the P-Cygni minima (which is comparable to that in normal SNe Ia and significantly larger than in SN 2009dc).
4.1.2 One week past maximum
By a week after maximum (Fig. 10), the spectrum of SN 2009dc has evolved significantly, but its main characteristics have not changed too much. There is still a blue continuum, spectral features are not particularly deep, and the line velocities are even lower than before. The UV flux has diminished compared to the first observations, suggesting stronger UV line blanketing due to Fe-group elements. Also the lines from IMEs (Si ii, S ii, Mg ii) have become more pronounced, and the Ca ii H&K and NIR triplet lines are now clearly visible (though still weak compared to normal SNe Ia). O i is very pronounced, although the shape of the feature indicates blending with another line, most likely Mg ii . The C ii lines are weaker than before maximum light, but still clearly detected. This is remarkable given that in no other SN Ia have such strong C ii lines been found at such a relatively late epoch. The identification of an absorption feature at 5760 Å remains unclear: compared to Si ii it is at too blue a wavelength to be identified with Si ii . Na i D, possibly blended with Si ii , could be an explanation.
Apart from the lower velocities and the C ii lines, the spectrum of SN 2009dc is now fairly similar to that of SN 1991T. A normal SN Ia like 2003du has deeper Si ii, S ii and Ca ii lines, whereas in SN 2005hk these IME features are shallower than in SN 2009dc and at even lower velocity. SN 2009dc’s superluminous colleagues again reveal some variation in line velocities and strengths within this subgroup: both SN 2006gz and 2007if show higher velocities than SN 2009dc at this phase, but while the absorption lines in SN 2006gz are as deep as in a normal SN Ia, those in SN 2007if are even less pronounced than those in SN 2009dc.
4.1.3 Five weeks past maximum
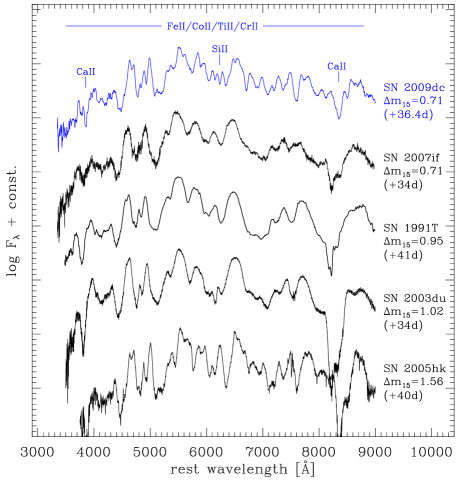
Five to six weeks after maximum the spectra of all SNe Ia are dominated by lines of Fe-group elements (Fe ii, Co ii, Ti ii, Cr ii) and Ca ii, and SN 2009dc is no exception in this respect (Fig. 11). SN 2003du, SN 1991T and the superluminous SN 2007if are very similar at this epoch, showing fairly broad and blended spectral features. This suggests that at least the inner ejecta of SN 2007if have velocities comparable to normal SNe Ia. SN 2009dc, on the contrary, has much narrower and less blended lines. There is now a remarkable similarity between SN 2009dc and the 02cx-like SN Ia 2005hk in terms of velocities and line blending, but also in the relative strengths of different lines. Exceptions are Ca ii (which is weaker in SN 2009dc) and Si ii (which can still be identified in SN 2009dc but is absent in SN 2005hk).
4.1.4 Nebular phase
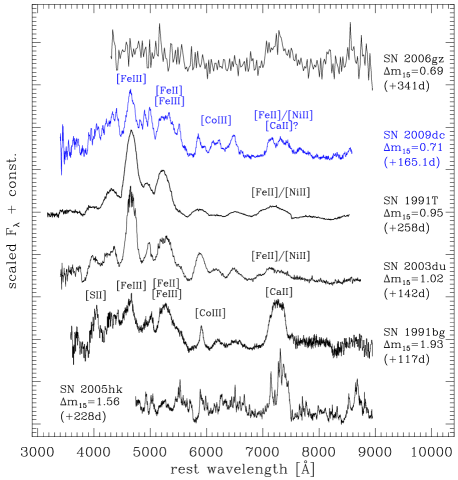
Figure 12 presents late-time spectra of SNe 2009dc, 2006gz, 1991T, 2003du, 2005hk and the prototypical subluminous Type Ia SN 1991bg. Several of the spectra are too early to be considered fully nebular, but in all of them the (forbidden) emission lines dominate over residual photospheric flux. SNe 2003du and 1991T have very similar spectra with prominent [Fe ii], [Fe iii] and [Co iii] emission lines, the reduced strength of the [Co iii] lines in SN 1991T being a consequence of the later epoch of the spectrum with more Co already decayed to Fe. The lines in SN 1991T are also broader than those in SN 2003du, indicating more Fe-group material at higher velocities, in agreement with the larger Ni mass and the detection of Fe-group material in the outer layers in early spectra (Ruiz-Lapuente et al., 1992; Mazzali et al., 1995). SN 2009dc once more shows narrower and better resolved emission lines owing to the low ejecta velocities. However, there are also more subtle differences. The emission feature at 4650 Å, mostly a blend of [Fe iii] lines, is much less pronounced in SN 2009dc, indicating a lower Fe iii-to-Fe ii ratio than normal. This lower ionisation is most likely explained by enhanced recombination as a consequence of the relatively low velocities / high densities in the inner ejecta of SN 2009dc. In this particular aspect, SN 2009dc resembles subluminous SNe Ia such as SN 1991bg, which also show suppressed [Fe iii] lines in their nebular spectra because of low velocities and temperatures (Mazzali et al., 1997). However, 91bg-like SNe also show a prominent emission feature at 7300 Å, identified as [Ca ii] by Mazzali et al., which is significantly weaker and probably dominated by [Fe ii] and [Ni ii] in SN 2009dc.
The nebular spectra of SNe 2006gz (Maeda et al., 2009) and 2005hk (Sahu et al., 2008) deserve some comments. The SN 2005hk spectrum is characterised by a multitude of extremely narrow features (much narrower now than those of SN 2009dc) and by the complete absence of prominent [Fe ii] and [Fe iii] lines. In fact, despite the relatively advanced epoch, this spectrum is not yet nebular in most parts, which is probably a consequence of the low velocities and the corresponding high densities. The spectrum of SN 2006gz also is highly peculiar: there is a strong feature at 7300 Å, but like in SN 2005hk there is almost no emission in the blue (though this region suffers from very low S/N). In SN 2006gz this unusual spectral appearance comes along with an unexpectedly low luminosity for the given epoch, seemingly inconsistent with the large 56Ni mass derived from early-time data. Given that we find an accelerated light-curve decline also in SN 2009dc past 200 d (Section 3), one could speculate that at a sufficiently late epoch (more than a year after the explosion) the spectra of SN 2009dc might look similar to the nebular spectrum of SN 2006gz.
4.1.5 C ii lines
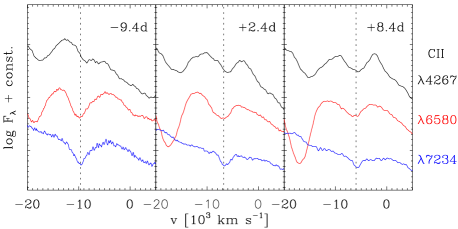
As mentioned earlier, SN 2009dc is the Type Ia SN with the strongest and most persistent C ii lines ever observed. C ii can be identified from the earliest spectra to about two weeks after maximum light. Previously, C ii features were only reported in very early spectra of normal SNe Ia (e.g. Thomas et al., 2007), in pre-maximum spectra of the superluminous SN Ia 2006gz (Hicken et al., 2007) and – more tentatively – around maximum light in some 02cx-like SNe (e.g., Sahu et al., 2008) and the superluminous SNe 2003fg (Howell et al., 2006) and 2007if (Scalzo et al., 2010). In SN 2009dc there is little doubt that the C ii identification is correct, since not only the line, but also the line is clearly detected (Fig. 13). There may even be C ii in form of a notch around 4150 Å, but Scalzo et al. (2010) suggested Cr ii as an alternative explanation for this feature in SN 2007if. Given that this line strengthens while C ii and fade with time we tend to agree with this interpretation.
4.2 NIR spectra
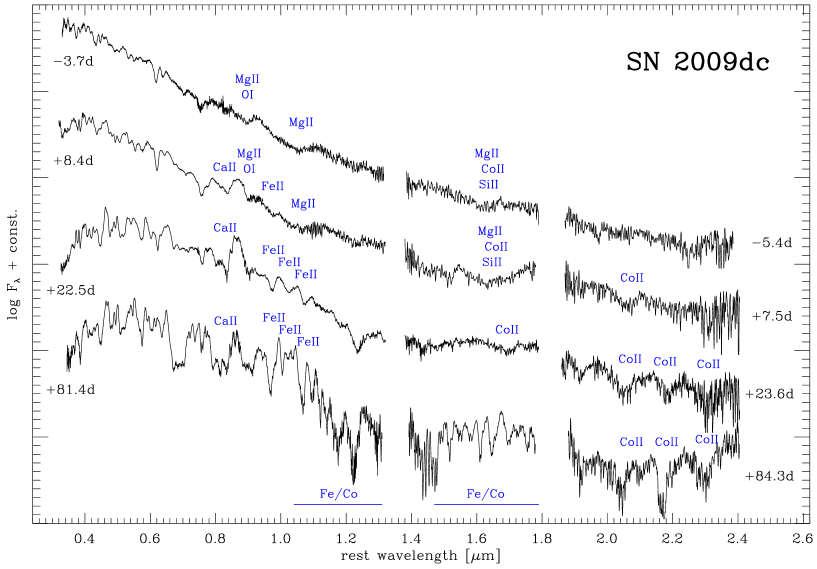
At four epochs, our optical spectra of SN 2009dc are complemented by NIR spectra, so that combined spectra can be constructed which cover a wavelength interval from 0.35 to 2.45 m (with gaps in the NIR where the earth’s atmosphere is opaque). These spectra are presented in Fig. 14. Starting with a relatively smooth, blue continuum before maximum light, the NIR spectra of SN 2009dc show increasing structure as the SN evolves, and develop some flux deficit in the band. In the d spectrum, Co ii lines start to be visible in the -band region, which is a typical feature of SNe Ia at these epochs (Marion et al., 2009a). The +84.3 d spectrum, finally, shows a large number of narrow absorptions and emissions in the - and -band regions, most of them due to Co ii, Fe ii and other Fe-group elements (Marion et al., 2009a). In spite of the prominent C ii features in the optical part of the spectrum, there is no evidence at any time for C i lines in the NIR. On the contrary, in the carbon-rich Type Ic SN 2007gr, C i was unambiguously detected in the NIR early on (Valenti et al., 2008), indicating a quite different level of ionisation. Similarly, we do not find any features which could be attributed to the NIR He i 1.083 and 2.058 m lines. Being the strongest He i lines in the entire optical and NIR regime, these lines are sensitive indicators of the amount of He present in the SN ejecta. Their absence requires nearly He-free conditions, which could be a challenge for some of the potential explosion models discussed in Section 5.3.
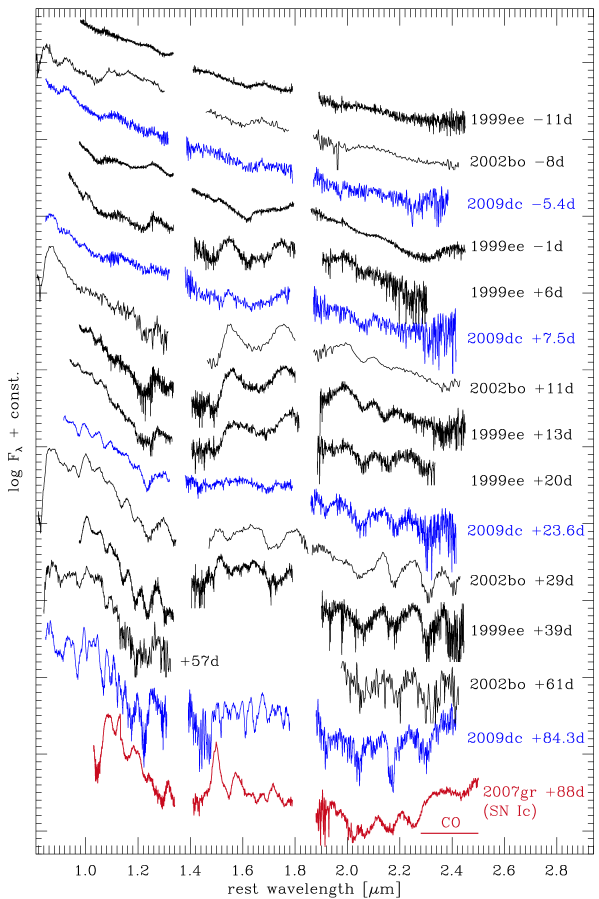
Figure 15 presents a comparison of the NIR spectra of SN 2009dc with those of the well-sampled normal SNe Ia 1999ee (Hamuy et al., 2002) and 2002bo (Benetti et al., 2004). While SNe 1999ee and 2002bo are very consistent with each other in their spectral evolution, SN 2009dc shows both similarities and differences. The overall spectral energy distribution of SN 2009dc and its time evolution resemble those of the other objects, but the flux deficit between 1.2 and 1.5 m in the +23.6 d spectrum of SN 2009dc is less pronounced compared to SNe 1999ee and 2002bo. This is reflected by the weaker post-maximum drop in the band seen in the light curves (Fig. 5).
With its fairly smooth, blue continuum, the d spectrum of SN 2009dc resembles the d spectrum of SN 2002bo. At d the difference to normal SNe Ia is most pronounced in the region around m, where SN 2009dc shows only a hint of the strong P-Cygni feature seen in other objects and normally attributed to Fe-group elements (Marion et al., 2009a). On day , SN 2009dc shows the typical blends of Co ii lines in the -band region, which all SNe Ia develop a few weeks after maximum light. Also the -band region strongly resembles e.g. that of SN 2002bo on day . At the same time, however, the -band region in SN 2009dc shows less structure than in ordinary SNe Ia.
Interestingly, as a consequence of the decreasing velocities the same region is resolved into a large number of individual, narrow lines by day , most of them attributed to Fe-group elements (Co ii and Fe ii in particular). Probably the same lines dominated this region already at earlier epochs, but were so strongly blended that they mimicked a continuous emission. The -band region of SN 2009dc on day is characterised by the same features as that of SN 2002bo on day (Fe ii and other Fe-group lines), but again all lines are narrower and better resolved. Only the Co ii lines in the -band region are still strongly blended. Accordingly, little evolution is seen in that region compared to the d spectrum, except for a relative increase in the flux beyond 2.3 m. The latter might be caused by emission of the first overtone band of CO, as observed at similar epochs in some stripped-envelope CC-SNe (e.g. in SN 2007gr, Hunter et al., 2009, see Fig. 15). Given that SN 2009dc had similarly strong C and O features at early phases and comparably low ejecta velocities as SN 2007gr, molecule formation at comparable epochs in these two objects appears possible, although it has never been observed in ordinary SNe Ia even at much later phases (Bowers et al., 1997; Spyromilio et al., 2004).
4.3 Ejecta velocities
One of the most characteristic properties of SN 2009dc throughout its spectroscopic evolution is the low expansion velocity of the ejecta deduced from spectral lines. As shown in Fig. 16, even 10 d before maximum light the velocities do not exceed 10 000 km s-1, regardles of which element is considered. The highest velocities are measured in carbon and oxygen, in agreement with the idea that unburned material should predominantly be found in the outer layers. IMEs are at somewhat lower velocities: Si ii yields a velocity estimate of 9000 km s-1, whereas the S ii blend with an effective wavelength of 5455 Å yields just 7500 km s-1. Given that the sulphur lines are intrinsically quite weak, they are often considered to be a better tracer of the photosphere than Si ii .
During the following 20–30 d, the measured line velocities generally decrease, levelling at 7000 km s-1 in the case of oxygen, and at 5500 km s-1 in the case of silicon. C ii has a steeper velocity gradient than Si ii , and by the time the carbon features disappear (about two weeks after maximum) they form in deeper layers than Si ii . This suggests the presence of a zone at – km s-1 where IMEs and unburned material are mixed. Global asphericities could in principle lead to a similar behaviour, but are disfavoured for the respective layers by the spectropolarimetry presented by Tanaka et al. (2010). S ii always has the lowest velocities of all lines studied here, reaching 5000 km s-1 already a week after maximum light. Thereafter, the identification of this feature is not certain; in fact the accelerated slow-down seen in Fig. 16 is an indication that blending with other lines becomes important at that epoch.
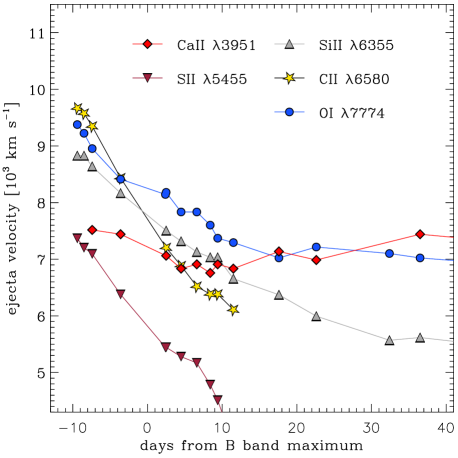
An exception to the trend of decreasing velocities is made by Ca ii. The Ca ii H&K lines are hardly detected in the earliest spectra, but then remain at a fairly constant velocity of 7000–7500 km s-1 throughout the photospheric phase. In particular, no high-velocity features are seen in the Ca ii lines, which are otherwise ubiquitous in early spectra of SNe Ia (Mazzali et al., 2005). The constantly low velocity constrains the Ca ii abundance in the layers above 8000 km s-1 to be very low, since already small amounts of Ca ii should be visible given the intrinsic strength of the H&K lines.
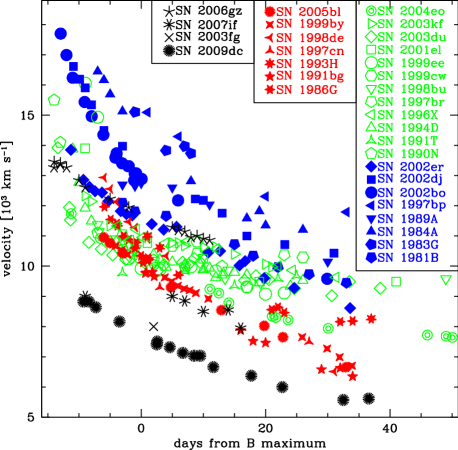
In Fig. 17, where the Si ii velocity evolution of a large number of SNe Ia is compared, the exceptional position of SN 2009dc is evident. At all times, SN 2009dc has significantly lower velocities than all other SNe Ia, including subluminous, 91bg-like events. Even most other superluminous SNe Ia (with the exception of SN 2003fg, for which only one epoch of spectroscopy is available) show significantly higher velocities than SN 2009dc, SN 2007if by 2000 km s-1 and SN 2006gz by 4000 km s-1.
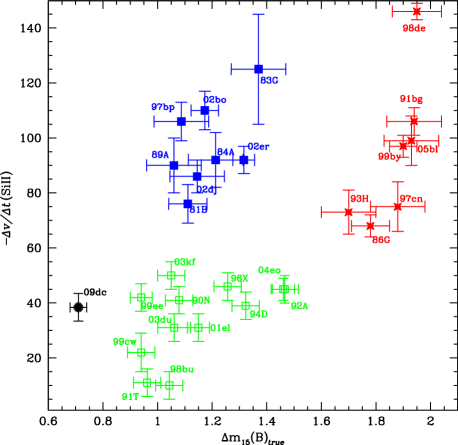
In a hierarchical cluster analysis, Benetti et al. (2005) arranged all SNe Ia in three groups (LVG, HVG and FAINT) based on their post-maximum velocity gradient and their . With a velocity gradient of km s-1 (100 d)-1, and , SN 2009dc extends the group of LVG SNe to smaller (Fig. 18). However, given the peculiarities of SN 2009dc, we hesitate to blindly assign it to the LVG group. Branch et al. (2006) proposed an alternative scheme, based on the EWs of Si ii and at maximum light. With 50–60 Å and 5–8 Å, respectively, SN 2009dc would end up in the shallow-silicon group, close to the boundary to core-normal SNe. However, again the overall spectrophotometric similarity of SN 2009dc to other members of this group (e.g. SN 1991T) is limited.
5 Discussion
5.1 Explosion parameters
In order to estimate the most relevant explosion parameters of SN 2009dc, we have employed the analytic description of Arnett (1982). This model allows to derive the mass of 56Ni produced in the explosion, the ejecta mass and the total explosion energy on the basis of the early-time bolometric luminosity evolution (c.f. Section 3.2). The model makes the simplifying assumptions of spherical symmetry, homologously expanding ejecta, no mixing of 56Ni, a constant mean optical opacity , radiation-pressure dominance, and the applicability of the diffusion approximation for photons, restricting its application to early phases when the ejecta are optically thick.
In the Arnett model the peak of the bolometric light curve occurs when the radiative losses equal the energy release by radioactivity. Numerical simulations (Höflich & Khokhlov, 1996) have shown that this equality holds at least approximately, and that the deviations to either side are typically not larger than 20 per cent in a broad set of models studied in detail. Lacking information on the nature of SN 2009dc, we make use of the original Arnett relation, but add in quadrature an additional 20 per cent to the error of the derived 56Ni masses. The SN luminosity at peak is thus given by
| (1) |
where . is the energy release per decay (1.73 MeV and 3.57 MeV for 56Ni and 56Co, respectively, not taking into account the energy in neutrinos, for which the ejecta are optically thin). is the decay time (8.77 d and 111.4 d, respectively) and the atomic mass of 56Ni/56Co. For a given , the masses of 56Ni and 56Co at peak can be calculated from the initial 56Ni mass () through the decay chain 56Ni 56Co 56Fe (assuming that ).
A complication in the case of SN 2009dc is the unknown rise time. Since the explosion was different from a normal SN Ia, there is a priori no reason to believe that the rise time should be the same. A lower limit to the rise time is provided by a very early detection 21.2 d before maximum light in a pre-discovery image, as reported by Silverman et al. (2011), when the SN was about 3.5 mag below peak. The last non-detection down to a limiting magnitude of 19.3 dates to one week before this detection, i.e. 28 d before maximum light (Silverman et al., 2011). We have therefore carried out the calculations twice, once for a rise time of 22 d and once for a rise time of 28 d. With [erg s-1] and d, a 56Ni mass of is derived. For d, a 56Ni mass of would be required to power the light curve. In both cases the quoted errors include uncertainties in the distance and reddening estimates, and a 20 per cent error intrinsic to the analytic model. These numbers are consistent with those obtained by Yamanaka et al. (2009) and Silverman et al. (2011) using Arnett’s law and assuming a similar host reddening, i.e., [for host = 0.14 mag and d] and [for host = 0.10 mag and d], respectively. Based on our calculation, the lowest 56Ni mass for SN 2009dc, as derived for a short rise time, small distance, low reddening and a peak luminosity exceeding the instantaneous energy deposition by 20 per cent, is 1.20 . This is just below , which may be important to reconcile SN 2009dc with thermonuclear explosion scenarios (see Section 5.3).
The Arnett (1982) description also allows to obtain estimates of the ejecta mass of SN 2009dc, using the relation
| (2) |
In this formula, is the effective photon diffusion
time, the velocity scale of the homologous expansion,
and an integration constant. We have calculated all quantities
relative to SN 2003du [ = 1.02], assuming that the mean optical
opacity is approximately the same in these two
SNe.666Given the large abundance of Fe-group material in
SN 2009dc, the of a Type Ia SN appears to be a
better match than that of a core-collapse SN, no matter what the
nature of SN 2009dc actually is. The ratio of the effective
diffusion times in SNe 2009dc and 2003du has been estimated measuring
the widths of the bolometric light-curve peaks [between points where
], yelding . Similarly, the ratio of velocity
scales has been estimated from the velocities measured in Si ii at maximum light, yielding . With Eq. 2 we obtain
= 2.84 assuming that SN 2003du was a -explosion. then yields foe.
These numbers confirm the conclusion of Yamanaka et al. (2009) and Silverman et al. (2011), i.e. that it is impossible to explain SN 2009dc by the explosion of a -WD. In fact, already the 56Ni mass – whose estimate is more robust than that of the total ejecta mass – probably exceeds 1.4 . A total ejecta mass of 2.8 is furthermore an utmost challenge for all scenarios that invoke thermonuclear explosions of WDs. It is noteworthy that the total explosion energy is just 15 per cent larger than in ordinary SNe Ia. At the same time, the energy production through nuclear burning probably exceeds that in normal SNe Ia by at least a factor of . This indicates that whatever the progenitor is, it should have a high binding energy per unit mass unless we underestimate the amount of low-opacity material (and hence also the total ejecta mass).
Of course, there is the caveat that in the case of SN 2009dc Arnett’s law might simply not be applicable, if some of the assumptions that enter into this model are not fulfilled. Strong deviations from spherical symmetry could for instance produce significant deviations from the Arnett model. However, the degree of asphericity is limited by the negligible continuum polarisation found by Tanaka et al. (2010) in polarisation spectra of SN 2009dc.
5.2 Enhanced late-time decline
As shown in Sections 3 and 3.2, starting at 200–250 d after maximum the late-time light curves of SN 2009dc decline much more rapidly than before. This behaviour is most pronounced in the and filters (Fig. 4), which are characterised by forbidden Fe emission lines (Section 4.1). Since the and bands dominate the optical emission at late times, also the pseudo-bolometric light curve, constructed from - to -band data with estimated corrections for the , and contributions, reflects this trend (Fig. 7). The enhanced late-time fading of SN 2009dc was also noted by Silverman et al. (2011), who showed that an estimate based on their photometry taken 403 d after maximum would yield a 56Ni mass of only 0.4 . In the following we discuss possible explanations for this behaviour, although no final conclusion can be achieved with the available data.
First of all, it should be stressed that an increased luminosity decline after some point cannot be explained by other radioactive species starting to dominate over 56Co. In order to dominate at late times, such a nucleus needs to have a longer half life than 56Co, which would result in a slow-down of the decline rather than an acceleration once it starts to dominate the energy deposition.
Depending on the perspective, the situation encountered in SN 2009dc can be interpreted in two ways: as a late-time flux deficit (at least in the optical regime) or as a flux excess during the first 200–250 d after the explosion. If interpreted as late-time deficit, there are again two scenarios: a decrease in the true bolometric luminosity, or a re-distribution of flux into wavelength regions not covered by our observations.
A drop in the true bolometric luminosity would require a change in the energy deposition rate, caused by an increased -ray or positron escape fraction. While this happens in all SNe as the ejecta expand, it is normally a gradual process, and it may be doubted whether a situation can be constructed that leads to a rather sudden drop of the opacity after some point in time. The alternative is a re-distribution of the emission into other wavelength regions, most likely the IR (Silverman et al., 2011). Since we have no constraints on the late-time IR luminosity of SN 2009dc beyond the band, this is, however, pure speculation. A flux re-distribution into the IR could be achieved by an unexpectedly early IR catastrophe (Axelrod, 1980), where Fe ii recombines to Fe i which emits predominantly at IR wavelengths. Alternatively, dust may form within the ejecta, leading to an absorption of optical light and re-emission in form of a thermal continuum determined by the temperature of the dust grains. Dust formation has never been observed in SNe Ia so far. However, from the early spectra we have indications that the ejecta of SN 2009dc contained more carbon than those of other SNe Ia, which opens the possibility of graphite condensation once the ejecta have cooled down sufficiently. In fact, if the (highly uncertain) detection of CO emission in the +84.3 d NIR spectrum was correct, the additional cooling through molecular bands might create favourable conditions for dust formation at a later moment (Fassia et al., 2001). The scenario of an IR catastrophe, on the other hand, seems to suffer from more shortcomings. First of all, even in very late observations of SNe Ia no IR catastrophe has ever been observed, although theoretical models predict it to occur between one and two years after the explosion (see, e.g., Leloudas et al., 2009). An IR catastrophe requires low densities; the densities in the slowly expanding SN 2009dc after 200 d, however, are much higher than those in a two or three times older normal SN Ia.
Seen from a different perspective, it might well be that the reason for the strange light curve of SN 2009dc must not be searched for in its late-time, but rather in its early-time behaviour, in a sense that during the first 200–250 d there was some extra emission that stopped after that time. Such a flux excess could arise from ejecta-CSM interaction. This scenario would help to turn SN 2009dc into a more ‘normal’ object since much less 56Ni would be required to power the light curve. Moreover, it would partially explain the low velocities by kinetic energy transfer to swept-up material, and – if the extra emission was in the form of an underlying continuum – the fairly shallow spectral features at early epochs could be understood (Hamuy et al., 2003). What argues against this interaction scenario is the lack of direct interaction signatures such as high-velocity spectral features or narrow emission lines. At least if the CSM was hydrogen-rich, narrow H emission should have shown up. On the other hand, a sufficiently massive, hydrogen-free CSM is not straightforward to obtain. Eventually, a lot of fine-tuning would be necessary for the interaction contribution to mimic the temporal evolution of a SN light curve, especially if the interaction is supposed to boost the SN luminosity by a factor 2 or more (in the end, the colour evolution of SN 2009dc is not too different from that of a normal SN Ia, and the light-curve decline after the peak phase follows the slope of objects powered by 56Co decay).
Whatever the truth behind the late-time light-curve dimming is, it was very likely also the reason for the highly peculiar late-time behaviour of SN 2006gz (Maeda et al., 2009). The mechanism may have worked more efficiently in SN 2006gz – a spectrum taken a year after maximum shows essentially no emission in the blue part, and a photometric recovery of the SN almost failed – but by extrapolation one may guess that SN 2009dc is on a good way to catch up.
5.3 Explosion models
The high luminosity of SN 2009dc, its low ejecta velocities, and the chemical composition of the ejecta with a lot of IMEs, C and O, but without any trace of H or He, pose a challenge to any explosion model one can think of, be it thermonuclear or core collapse. In particular, as demonstrated by Yamanaka et al. (2009) and Silverman et al. (2011) and as is evident from the derived explosion parameters (Section 5.1), in the absence of CSM interaction there is no way for SN 2009dc to be the explosion of a regular -WD. In what follows, we go through possible progenitors and explosion channels for SN 2009dc, some of them already scrutinised in the literature, others being new suggestions to widen the discussion. A successful model has to explain the large production of 56Ni, the ejection of of material with low kinetic energy per mass, the presence of C and O in all layers down to 6000 km s-1, the absence of H and He, and the peculiar evolution of the late-time SN luminosity. This discussion is based on SN 2009dc and the explosion parameters derived for it. However, given the similarities within the group of superluminous SNe Ia, most arguments are also valid for other members of this class.
5.3.1 Rotating ‘super-’ white dwarfs
Rapidly rotating WDs were first suggested by Howell et al. (2006) as a progenitor for the superluminous SN Ia 2003fg. Indeed, as shown by Yoon & Langer (2005), differentially rotating WDs can be stabilised by centrifugal force and exceed the Chandrasekhar mass of non-rotating WDs by quite a margin. However, this model faces some problems.
At least within the single-degenerate scenario it is difficult for a WD to accrete all the material and gain all the angular momentum needed to grow to . CO WDs are typically born with masses of 0.6 (Koester, Schulz & Weidemann, 1979; Weidemann & Koester, 1983; Liebert, Bergeron & Holberg, 2005) and with slow rotation (e.g., Spruit, 1998). Even if the WD was initially as massive as 1 , it would still have to accrete at least another solar mass of material, provided by the binary companion. This large mass requires the companion itself to be quite massive, but its mass is limited by the fact that its ZAMS mass must have been lower than that of the primary, since it is less evolved. This narrows down the possible parameter space for primary and secondary significantly. In fact, Langer et al. (2000) estimated that no CO WD can grow much beyond 2 by accretion from a non-degenerate companion, which is probably not enough to explain the ejecta mass of 2.8 derived for SN 2009dc (Section 5.1).
Some of the problems concerning the accretion and spin-up could be avoided if the secondary was also a CO WD, disrupted in the course of a merger, with its material being accreted steadily onto the primary (Hicken et al., 2007). However, in the case of a merger of two massive WDs with a mass ratio close to one, a dynamical merger with a detonation triggered already during the act of merging (Pakmor et al., 2010) may be the more likely outcome. This scenario is discussed in the next section.
A problem of all rotating models, be it a single WD or the result of a WD merger, may be the kinetic energy of the ejecta. Synthesising at least 1.2 of 56Ni plus some IMEs, SN 2009dc produced 50 to 100 per cent more energy than a normal SN Ia. If this energy is distributed to 2 of ejecta, it will result in high ejecta velocities unless the specific binding energy is significantly larger than in a -WD. Yoon & Langer (2005) indeed see an increase in the specific binding energy by a factor 1.7 when going from a non-rotating -WD to a rotating WD with 2 . However, given that the binding energy is only a fraction of the total explosion energy this does not affect the specific kinetic energy by too much. Accordingly, Pfannes, Niemeyer & Schmidt (2010) find that the ejecta velocities of a detonating 2.1 WD are very similar to those encountered in normal SNe Ia, and too high to be compatible with SN 2009dc.
5.3.2 Dynamical white-dwarf mergers
Pakmor et al. (2010) presented WD merger calculations in which a detonation was triggered dynamically in a hot spot during the process of merging. The computation was performed for the merger of two 0.9 WDs, which produced 0.1 of 56Ni. However, the prerequisite for a dynamical explosion is not only the absolute mass of the WDs, but also a mass ratio close to one (Pakmor et al., 2010). The central densities of WDs are a steep function of their mass. Hence, it may be expected that e.g. a pair of 1.2 WDs produces much more 56Ni during a dynamical merger, although it may not be sufficient for SN 2009dc. The total ejecta mass of such an event would be 2.4 , which is at least closer to the value deduced for SN 2009dc than rotating models can probably get. Of course, CO WDs with are rare (e.g. Liebert et al., 2005) and so are binary systems of them, but since the rate of superluminous SNe Ia is low (and not well known) this would per se not exclude this scenario.
Beyond 1.2 , essentially all WDs which have not grown through accretion or mergers are ONe rather than CO WDs (Koester et al., 1979; Weidemann & Koester, 1983). From the detection of carbon in the early spectra one can conclude that SN 2009dc cannot have been a merger of two ONe WDs, but a merger of an ONe WD and a similarly massive CO WD could be feasible. Because of its higher mean atomic mass, an ONe WD releases less energy when burned to 56Ni than a CO WD, which could help in keeping the ejecta velocities low. A problem might be the susceptibility of ONe WDs to electron captures on 20Ne and 24Mg. In fact, numerical simulations have shown that ONe WDs do not explode, but collapse to a neutron star when approaching (Miyaji et al., 1980; Saio & Nomoto, 1985). This, of course, does not have to be true for a dynamical merger, where the detonation triggered by an ‘external event’ and propagating supersonically might leave the ONe WD no time to collapse.
5.3.3 Core collapse in an envelope-stripped massive star
Explaining SN 2009dc as a core-collapse explosion of a stripped star has the obvious advantage that no strict limits on the ejecta mass apply. Core-collapse events whose ejecta exceed are common. Unfortunately, other hallmarks of core-collapse explosions are not met by SN 2009dc. Typical core-collapse SNe produce of the order of 0.1 of 56Ni, and this number goes up to 0.5 for some -ray burst related hypernovae like SNe 1998bw (Galama et al., 1998; Maeda et al., 2006) or 2003dh (Hjorth et al., 2003) which – contrary to SN 2009dc – are characterised by a very large kinetic energy and high ejecta velocities. Beyond this, Umeda & Nomoto (2008) recently constructed a series of core-collapse models from very massive (20–100 ) progenitors, assuming little fall-back of synthesised 56Ni onto the newly formed black hole. They found ejected 56Ni masses up to several (see also Moriya, et al.2010). However, given the very large total ejecta masses, the composition of these objects – as of all core-collapse SNe – cannot be considered Ni-rich. SN 2009dc is different in this respect, with probably more than half of its ejecta being made up of 56Ni. More generally, the overall abundance pattern as suggested by the spectral time series of SN 2009dc is not typical of core-collapse SNe. SN 2009dc is characterised by prominent IME lines, most notably those of Si ii and S ii, which are weak (Si ii , see e.g. Branch et al., 2006) or absent (S ii lines) in stripped-envelope core-collapse SNe. The latter events, on the other hand, always eject a large amount of oxygen, giving rise to a prominent [O i] emission in the nebular phase. SN 2009dc does show O i lines in early-time spectra, but no hint of [O i] at late times, contrary to all objects with an undisputed classification as stripped-envelope core-collapse SNe known to date. This indicates a lack of mixing of O and 56Ni, which is difficult to achieve in core-collapse explosions.
5.3.4 Core collapse with activity of the central remnant
Within the core-collapse scenario a possible way to reduce the mass of 56Ni needed to power the light curve of SN 2009dc could be heating from an active compact remnant. Indeed, the birth of a magnetar was proposed by Maeda et al. (2007) to explain the unusual light-curve evolution of the Type Ib SN 2005bf, characterised by a broad, delayed peak and a deep luminosity drop thereafter. An energy source different from radioactivity allows more freedom in the light-curve shape, as an exponential tail is not a necessary consequence. Accordingly, within such a scenario the late-time luminosity drop seen in SN 2009dc could be explained by the termination of the heating from the central object. Compared to CSM interaction as an alternative non-radioactivity-related energy source, heating from a compact remnant has the advantage that the energy is injected at the centre and released on photon diffusion time scales, which allows the light curve to rise smoothly to peak (Maeda et al., 2007). Moreover, since the photons propagate through the entire ejecta, the normal processes of spectrum formation take place, resulting in a fairly normal SN spectrum (as was the case for SN 2005bf; Tominaga et al., 2005; Folatelli et al., 2006). Narrow emission lines are not expected.
What remains a problem, however, is the SN Ia-like abundance pattern derived from the spectra of SN 2009dc, as detailed above. SN 2005bf was spectroscopically undoubtedly a stripped-envelope core-collapse SN, and showed the hallmark [O i] and [Ca ii], but only weak Fe emission lines in its nebular spectra. All of this is not the case for SN 2009dc.
5.3.5 Type I SNe: thermonuclear explosions of AGB-star cores
Developed back in the 1970s (Ergma & Paczyński 1974; Couch & Arnett 1975; Iben 1982, but see Iben & Renzini 1983), the idea of exploding AGB star cores has not found much resonance during the past two decades. While stars with ZAMS masses between 8 and 10 are predicted to form ONeMg cores and possibly undergo electron-capture core collapse, those between 0.5 and 8 end up with degenerate CO cores after core He burning. The subsequent He shell burning or AGB phase is characterised by strong mass loss, and is usually terminated by the ejection of the envelope as planetary nebula and the formation of a CO WD that cools by radiative processes. However, in the most massive AGB stars the degenerate CO core might grow to 1.4 before mass-loss processes can reduce the total mass of the star below that value. In this case, carbon would be ignited in the core and a thermonuclear runaway would drive a flame through the entire star and disrupt it. Iben & Renzini (1983) proposed the term ‘Type I SN’ for such an explosion, based on its thermonuclear origin but the likely presence of H lines in the spectrum.
To make Type I SNe a suitable model for SN 2009dc, several conditions have to be fulfilled. At the time of explosion, the AGB star needs to have a total mass between 2.5 and 3 , which is probably feasible. It must have lost its H envelope through stellar winds or binary interaction to prevent H lines, most notably H, from appearing in the SN spectra. The mass of the degenerate CO core (i.e., 1.4 ) is an upper limit for the amount of 56Ni that can be produced in such an explosion, but if the core is burned entirely to Fe-group material this might still be consistent with SN 2009dc within the large uncertainties (Section 5.1). Such a complete burning of the core is only possible if the thermonuclear flame propagates as a detonation, and not as a deflagration that gives the star time to pre-expand. The He envelope would then have to be burned to carbon, oxygen and IMEs, in order to match the abundance pattern observed in the ejecta of SN 2009dc. This could be problematic, since too much energy might be released by the He burning to be consistent with the low ejecta velocities. If, on the other hand, a part of the He is left unburned, it might show up in the spectra, in particular in the near IR. If such Type I SNe exist, they are probably rare, but small rates are not a problem as long as only superluminous SNe Ia shall be explained. In the end, detailed numerical simulations of hydrodynamics and radiative transfer are required to assess the feasibility of this model.
5.4 The host galaxy of SN 2009dc
As mentioned in Section 2.1, SN 2009dc is located in the outskirts of the S0 galaxy UGC 10064. Although lenticular galaxies are by no means dead stellar systems (e.g. Emsellem et al., 2007; Kawabata et al., 2009), such a host galaxy might still be considered as an indication for a predominantly old stellar population. This is consistent with the lack of H ii-region emission lines in the spectra of SN 2009dc, suggesting no strong star formation activity at the SN location.
However, UGC 10064 is not an isolated, unperturbed system. At the same redshift, about 98.1 arcsec to its north-west (corresponding to a projected distance of 44.6 kpc), there is the irregularly shaped, strongly distorted galaxy UGC 10063. Almost an order of magnitude less luminous than UGC 10064, UGC 10063 is characterised by a distinctly blue colour, indicative of luminous, young stars. It shows a tidal tail bridging the gap to its larger neighbour, and, as already mentioned by Silverman et al. (2011), SN 2009dc is located at the approximate endpoint of this tail (see Fig. 19).
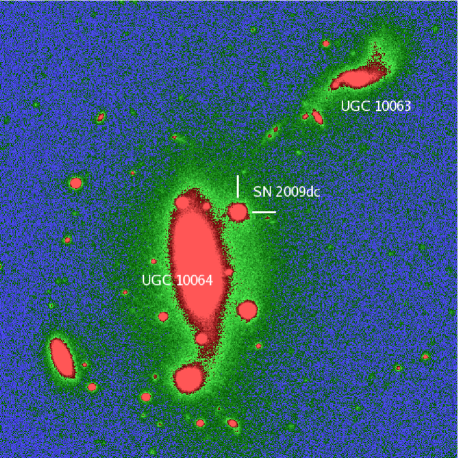
Coincident to our observations of SN 2009dc, we obtained deep photometry of UGC 10064 and UGC 10063 at the NOT on 2009 August 12, spectroscopy of UGC 10064 with DOLORES at the TNG on 2009 July 4, and spectroscopy of UGC 10063 with CAFOS at the Calar Alto 2.2m on 2009 May 4. In addition to our own optical photometry, UV photometry from GALEX (Morrissey et al., 2007) and NIR photometry from 2MASS (Skrutskie et al., 2006) were available. We used sextractor (Bertin & Arnouts, 1996) in common aperture mode, using the band to define the apertures, to derive magnitudes from all imaging data. We then used zpeg (Le Borgne & Rocca-Volmerange, 2002) to match our photometry to galaxy evolutionary scenarios. Using the standard set of nine evolutionary scenarios included with this code and the internal presciptions for treating extinction by dust, we match the photometry of UGC 10064 to a galaxy with a mass that underwent a starburst 4 Gyr ago. The photometry of UGC 10063 matches an Sd galaxy of mass . Our spectra, the fluxes inferred from our photometry, and the best-fit zpeg template for each galaxy are shown in Figure 20.
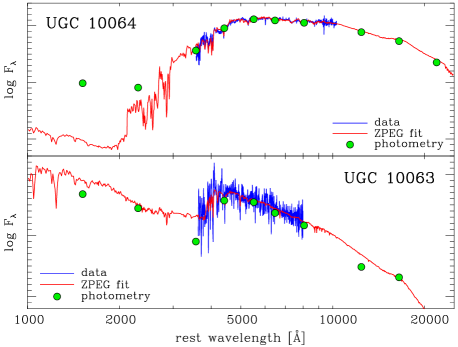
Interestingly, there appears to be an excess of UV flux for UGC 10064 compared to the best fitting zpeg template, that of a starburst of 4.0 Gyr age. Inspection of the GALEX images indeed shows a visible UV flux concentrated at the core of UGC 10064. Using the methods described by Childress et al. (2010), we measure the emission-line fluxes of UGC 10064 by subtracting a best-fit stellar template. Though weak emission lines are detected, their flux ratios indicate ionisation by an active galactic nucleus according to the BPT (Baldwin, Phillips & Terlevich, 1981) diagram boundaries defined by Kewley et al. (2006). This indicates that the UV excess and weak-emission-line flux in UGC 10064 are likely to be caused by an active nucleus, and that no significant star-formation has occurred in the galaxy for at least several Gyr. Thus, if SN 2009dc was born from the stellar population of UGC 10064, it is likely to have a long delay time.
In contrast to the old stellar population of UGC 10064 is the much younger population of UGC 10063. The best fitting zpeg template is that of an Sd galaxy whose luminosity-weighted stellar age is 1.5 Gyr. The spectrum of UGC 10063 shows no emission from recent star formation, and is dominated by strong Balmer absorption features indicating the galaxy to be in a post-starburst phase (as was also noted by Silverman et al., 2011). This implies that UGC 10063 underwent a strong burst of star formation a few hundred Myr before the explosion of SN 2009dc, perhaps induced by a close encounter with UGC 10064. Intriguigingly, this is a time scale similar to that reported by Childress et al. (2010) for the parent population of SN 2007if, and could be indicative of a similar time scale for the explosion of SN 2009dc.
A more in-depth study of the stellar population at the SN site has to be postponed to a moment when the SN will have faded below detectability. For the time being, it is not possible to decide if the SN descended from an old, low-mass stellar population as expected for its S0 host, or from the significantly younger population that dominates the tidal tail of the companion galaxy.
5.5 Host galaxies of superluminous SNe Ia
| SN | SN | Surveya | Host galaxy | Morphologyb | Redshift | Host M | Host |
|---|---|---|---|---|---|---|---|
| SN 2003fg | SNLS | anonymous | Irr | 0.244 | ? | ||
| SN 2004gu | Texas | FGC 175A | spiral | 0.046 | |||
| SN 2006gz | Puckett / LOSS | IC 1277 | Scd | 0.024 | |||
| SN 2007if | ROTSE / SNF | anonymous | ? | 0.074 | |||
| SNF20080723-012 | ? | SNF | anonymous | spiral | 0.075 | ||
| SN 2009dc | Puckett | UGC 10064 | S0 | 0.021 | |||
| UGC 10063 | SBd | 0.021 | |||||
| SN 2009dr | ? | PTF | anonymous | ? | 0.1 |
The question of host galaxies and parent populations is crucial for narrowing down the range of possible explosion scenarios for superluminous SNe Ia. In particular, it might help discriminating between a thermonuclear or core-collapse origin, since the stellar populations involved are significantly different. To date, at least seven SNe Ia are known to be superluminous in the sense that their 56Ni yields are incompatible with the explosions of -WDs. These SNe do not form a homogeneous group: differences in their early (ionisation state, line velocities) and late spectra (line widths, strength of Fe lines; Taubenberger et al. in prep.) are evident. Their hosts also exhibit some heterogeneity, but we will show below that the ensemble of superluminous SN Ia hosts have on average lower masses, and presumably lower metallicities, than those of full samples of SNe Ia from untargeted surveys. In Table 7, some basic properties of the host galaxies of superluminous SNe Ia are summarised.
We derived the host masses by collecting previously published host masses where available, and by applying the code zpeg to multi-band photometry of the other hosts, available from public sources (SDSS, GALEX, 2MASS) or our own observations. Previously published masses for host galaxies of superluminous SNe Ia include that of the host of SN 2003fg at (Howell et al., 2006) and that of the host of SN 2007if at (Childress et al., 2010). For FGC 175A, the host of SN 2004gu (Contreras et al., 2010), optical photometry was obtained from SDSS DR7 (Abazajian et al., 2009), UV data from GALEX, and photometry from 2MASS. Archival photometry from Subaru was available for IC 1277 (Maeda et al., 2009), the host of SN 2006gz, along with 2MASS data. We used our own optical VLT + FORS2 photometry for the host of SNF20080723-012 to derive its mass. Our own NOT images of 2009 August 12 provided photometry of both UGC 10064 and UGC 10063, while GALEX UV and 2MASS IR were also available. Optical photometry from SDSS is available at the site of SN 2009dr (Quimby et al., 2009), but the host is not detected.
We used sextractor in common aperture mode, using either the band or band to define the apertures, to derive magnitudes from all imaging data. We then used zpeg to derive host masses from our photometry, finding for FGC 175A, for IC 1277, for the host of SNF20080723-012, for UGC 10064, and for UGC 10063. The host of SN 2009dr is undetected in SDSS data, so using the SDSS -band limiting magnitude of (Stoughton et al., 2002) at the redshift of this object ( Quimby et al., 2009) we estimate that the host must be fainter than . With a (conservatively large) solar mass-to-light ratio from Blanton et al. (2003), this places an upper mass limit for its host at .
The mass-metallicity (MZ) relation (Tremonti et al., 2004) supports the interpretation of this result as a prevalence of low-metallicity environments for the preferred birthplace of superluminous SNe Ia. To confirm this interpretation, we collected spectroscopic data for the hosts of SN 2004gu, SN 2006gz, SNF20080723-012 and SN 2009dc. Note that contrary to the case of SN 2007if (Childress et al., 2010), whose host was a dwarf galaxy and therefore chemically well mixed, a metallicity gradient is expected for these more massive galaxies. The derived core metallicities are hence upper limits for the actual metallicities in the immediate SN environments.
The emission-line fluxes from the SDSS spectrum of the host of SN 2004gu were derived by Tremonti et al. (2004), while we measured emission-line fluxes for the host of SN 2006gz from an archival Subaru + FOCAS spectrum (Maeda et al., 2009), and for the host of SNF20080723-012 from our own nebular-phase observations of the SN using FORS2 on the VLT. We then employed the O3N2 method of Pettini & Pagel (2004) to derive gas-phase oxygen abundances of , , and . We note that the error bar for the metallicity of the host of SNF20080723-012 is likely underestimated, as contamination from the nebular SN prevents fitting of the stellar continuum to obtain absorption corrections for Balmer line fluxes. Using the conversion formulae of Kewley & Ellison (2008), we converted these metallicity values to the scale of Tremonti et al. (2004) to place them on a common scale with the fiducial MZ relation, and compared these to the solar oxygen abundance of Delahaye et al. (2010). This yields final metallicities of , , and . The metallicity of the host of SN 2007if was determined in precisely the same manner by Childress et al. (2010), who found . The metallicity of UGC 10064 was previously measured by Wegner & Grogin (2008) using stellar absorption features. They found . Though systematic discrepancies between galaxy metallicities measured from stellar features and those from nebular emission are known, this metallicity for UGC 10064 is consistent with its host mass and the MZ relation.
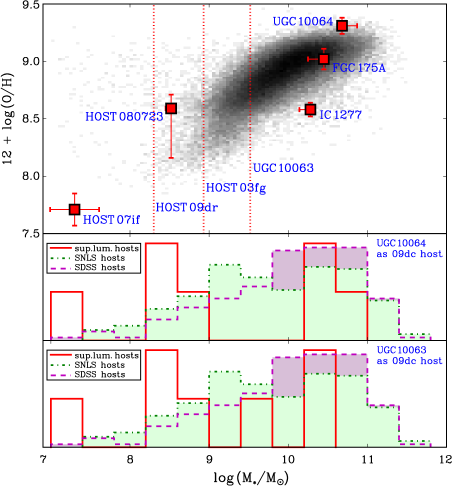
In Fig. 21 (top panel) we compare the derived masses and metallicities of the hosts of superluminous SNe Ia with those of SDSS galaxies. For the hosts of SNe 2003fg and 2009dr, as well as for UGC 10063, no metallicities could be determined, so that these galaxies are included as vertical lines; for the SN 2009dr host the upper mass limit is shown. There seems to be a tendency of the hosts of superluminous SNe Ia to have on average lower masses than the SDSS galaxies. This trend also holds in the histograms in the lower two panels, where the host-mass distibution of superluminous SNe Ia is compared to those of SNe Ia from the non-targeted SDSS and SNLS (Sullivan et al., 2010) surveys. In the middle panel UGC 10064 has been assumed to be the host of SN 2009dc, in the bottom panel UGC 10063.
The host-mass distribution of superluminous SNe Ia has a mean and dispersion of or , depending on whether UGC 10064 or UGC 10063 is considered as the host of SN 2009dc. These numbers are conspicuously lower than the and obtained for all SNLS and SDSS SN Ia hosts, respectively.
To verify whether the observed distributions differ to a statistically significant degree, we ran a Kolmogorov-Smirnov test, using the SDSS and SNLS host-mass distributions as a reference, and assuming in our null hypothesis that the hosts of superluminous SNe Ia have been drawn from the same distributions. At a customary significance level of , this null hypothesis is not rejected for both reference distributions. If, however, the significance is relaxed to , the null hypothesis is rejeceted for the SDSS reference distribution (but not yet for the SNLS reference distribution). This outcome is independent of which galaxy is adopted as the host of SN 2009dc, since it is driven by the high frequency of low-mass dwarf galaxies among the hosts of superluminous SNe Ia. Of course, this is all low-number () statistics, and one should note that the addition of a single event might change the result considerably. Nevertheless, we tentatively claim weak evidence for an excess of low-mass galaxies as hosts of superluminous SNe Ia.
5.6 Concerns for cosmology
The group of superluminous SNe Ia deserves particular attention for their potential role as troublemakers in SN cosmology. Spectroscopically fairly similar to ordinary SNe Ia (of the core-normal or shallow-silicon variety; Branch et al. 2006), these objects will be identified as SNe Ia in surveys, especially at high where the S/N of spectra is usually poor.
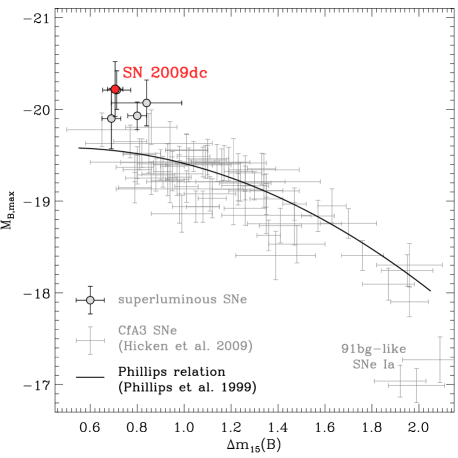
However, superluminous SNe Ia are no good standardisable candles. This is demonstrated in Fig. 22, where SN 2009dc is plotted in an absolute-magnitude vs. decline-rate diagram. It is clearly brighter than all other SNe Ia (from the CfA3 data set; Hicken et al. 2009), and also 0.65 mag brighter than anticipated by the Phillips et al. (1999) relation for its of 0.69.
It is hence likely that in high- SN surveys SN 2009dc would be regarded as less luminous than it actually is, and that too small a distance would be inferred. At the same time, if the redshift was to be determined from a cross-correlation with other SN Ia spectra, it would probably be slightly overestimated due to the lower expansion velocities. In sum, these effects would move SN 2009dc towards the lower-right in a Hubble diagram where the distance is plotted as a function of redshift.
Having a small number of outliers in the Hubble diagram is by itself not sufficient to really affect SN cosmology. Instead, an evolution of the average SN Ia properties with look-back time would be required. However, such an evolutionary effect could exactly be generated by superluminous SNe Ia. First of all, while apparently rare in the local Universe, their tentative tendency to be affiliated with low-metallicity dwarf galaxies (c.f. Section 5.5) might suggest an intrinsically larger abundance at high . Even more importantly, a Malmquist bias is expected, making it more likely for cosmological SN Ia data sets to contain superluminous SNe Ia at the highest redshifts, where they are favoured by their sheer luminosity. Systematic errors in the reconstruction of using SN Ia data may thus be introduced by superluminous SNe Ia unless they are recognised and treated correctly.
6 Conclusions
Optical and NIR observations of SN 2009dc have revealed an overall similarity with SNe Ia in light-curve shape and spectral evolution, but also highlighted a number of important differences. Most evidently, SN 2009dc is by a factor more luminous than ordinary SNe Ia over the first 200 d after the explosion (M, ), and is characterised by a slow decline from the light-curve peak (). The bands show secondary maxima, delayed by 25 d with respect to the peak in . The minima between the first and secondary maxima, however, are not very pronounced. The spectra of SN 2009dc are characterised by a blue pseudo-continuum with lines of IMEs, carbon and oxygen early on, but dominated by Fe-group material at later phases, when the photosphere recedes into 56Ni-rich zones. In particular, the nebular spectra show mostly [Fe ii] emission, indicative of a low level of ionisation. At early epochs most spectral lines are relatively shallow, and the ionisation is typical of normal to bright SNe Ia. The ejecta velocities are 30 per cent lower than in typical LVG SNe Ia.
A curiosity of SN 2009dc is an enhanced fading of its optical light curves after 200 d, at a phase when the decline in normal SNe Ia slows down. Lacking IR information, we cannot verify whether this results from a re-distribution of radiation into the IR regime (through dust formation or an IR catastrophe). Nevertheless, we are inclined to believe this, since the only alternative seems to be CSM interaction that contributes to the earlier light curve and suddenly ends at 200 d – a scenario that generates more problems than it solves (see below). The late-time behaviour of SN 2009dc reminds of what was observed in SN 2006gz, and we speculate that both SNe shared the same fate.
Using the analytic light-curve model of Arnett (1982), the 56Ni mass synthesised in the explosion was estimated. The biggest uncertainty in this exercise is the unknown rise time. For the minimum possible rise time of 22 d we obtained , for a rise time of 28 d . Using the velocity information from spectra, the model also allowed us to estimate a total ejected mass of 2.8 , and a kinetic energy of 1.6 foe. These numbers confirm that – in the absence of CSM interaction – the progenitor of SN 2009dc cannot have been a -WD.
Finding an explosion scenario that explains SN 2009dc with all its peculiarities turns out to be difficult. For all models based on WDs an ejecta mass of 2.8 is either the very limit of what could potentially be achieved (for a merger of two -WDs) or already beyond (for a super--WD grown by accretion from a non-degenerate companion). Thermonuclear explosions in hydrogen-stripped stellar cores (Type I SNe) might be an alternative, but detailed numerical calculations which show whether this model may work have not yet been performed. In particular, it is unclear whether H- and He-free SNe can be achieved in this way, and whether the ejecta velocities would match the observations. Core collapse of an envelope-stripped progenitor, finally, might be another option. Large ejecta masses are easy to achieve in this way, but the 56Ni- and IME-rich composition of the SN 2009dc ejecta and the lack of nebular [O i] emission disfavour this scenario.
A completely different approach is to assume that SN 2009dc was a relatively normal (probably thermonuclear) explosion, and that the observed peculiarities arise from interaction with a dense CSM. Such a scenario might explain both the high luminosity and the low ejecta velocities by conversion of kinetic energy into radiation, and the light-curve fading after 200 d by the end of the CSM interaction. However, we have argued that it would require a lot of fine-tuning to have a temporal evolution of the interaction strength that mimics a radioactivity-driven light curve over more than half a year. Moreover, an interaction strong enough to boost the SN luminosity by a factor 2 or more should leave a direct spectroscopic imprint in the form of narrow emission lines (which are not observed). At least a H-rich CSM can thus be excluded.
Whatever mechanism produces objects like SN 2009dc, it should be consistent with the finding that these events show a tendency to explode in low-mass hosts (and probably low-metallicity environments). While this trend for the entire group is fairly robust, little can be said about the stellar population giving rise to SN 2009dc in particular, since it is not clear whether the SN ‘belongs’ to the outskirts of an S0 galaxy (UGC 10064) or to a tidal tail from an interacting less luminous, blue companion (UGC 10063).
A final warning is addressed to the high- SN Ia surveys. Superluminous SNe Ia deviate systematically from the light-curve width vs. luminosity relations used to standardise SNe Ia for cosmological distance determination. For this reason, care should be taken to exclude superluminous SNe from the cosmological SN Ia data sets, which could be achieved e.g. by disregarding SNe with (Fig. 22). This is even more important as their high intrinsic luminosity and their association with (probably metal-poor) low-mass host galaxies should result in a bias that favours their detection at high redshift. If not accounted for, this could lead to systematic errors in the reconstruction of the expansion history of the Universe.
Acknowledgments
This work is based on observations collected at the 2.2 m Telescope of the Centro Astronómico Hispano Alemán (Calar Alto, Spain), the Italian 3.58 m Telescopio Nazionale Galileo, the 2.56 m Nordic Optical Telescope and the 2.0 m Liverpool Telescope (La Palma, Spain), the 3.58 m New Technology Telescope and 0.60 m Rapid Eye Mount (La Silla, Chile), the 1.82 m Copernico Telescope on Cima Ekar (Asiago, Italy), and the 2 8.2 m Large Binocular Telescope (Arizona, United States). The Telescopio Nazionale Galileo is operated by the Fundación Galileo Galilei of the INAF (Instituto Nazionale di Astrofisica) at the Spanish Observatorio del Roque de los Muchachos of the Instituto de Astrofisica de Canarias. ESO observations have been performed under programmes 083.D-0728, 083.D-0970 and 184.D-1140. We thank the support astronomers at the Telescopio Nazionale Galileo, the 2.2 m Telescope at Calar Alto, the Nordic Optical Telescope and the Large Binocular Telescope for performing the follow-up observations of SN 2009dc.
This research made use of the NASA/IPAC Extragalactic Database (NED), operated by the Jet Propulsion Laboratory, California Institute of Technology, under contract with the National Aeronautics and Space Administration; the Lyon-Meudon Extragalactic Database (LEDA), supplied by the LEDA team at the Centre de Recherche Astronomique de Lyon, Observatoire de Lyon; the Online Supernova Spectrum Archive (SUSPECT), initiated and maintained at the Homer L. Dodge Departent of Physics and Astronomy, University of Oklahoma; and the SMOKA archive, operated by the Astronomy Data Center, National Astronomical Observatory of Japan. Some data used in this paper were obtained from the Sloan Digital Sky Survey (SDSS). Funding for the SDSS and SDSS-II has been provided by the Alfred P. Sloan Foundation, the Participating Institutions, the National Science Foundation, the U.S. Department of Energy, the National Aeronautics and Space Administration, the Japanese Monbukagakusho, the Max Planck Society, and the Higher Education Funding Council for England. The SDSS Web Site is http://www.sdss.org/. We also benefited greatly from the information provided by the Bright Supernova web pages (maintained by D. Bishop) as part of the Rochester Academy of Sciences (http://www.RochesterAstronomy.org/snimages).
The authors are indebted to the referee, D. Branch, for his constructive comments. Our thanks go to F. K. Röpke, S. A. Sim, I. R. Seitenzahl, A. J. Ruiter, M. Fink, I. Maurer, K. Nomoto and K. Maeda for inspiring discussions, to M. Fink and S. Benítez Herrera for assistance with observations, and to K. Maeda and K. Kawabata for images and spectra of SN 2006gz obtained with the Subaru telescope. ST acknowledges support by the Transregional Collaborative Research Centre TRR 33 ‘The Dark Universe’ of the German Research Foundation (DFG). MC is supported by the Director, Office of Science, Office of High Energy Physics, of the U.S. Department of Energy under Contract No. DE-AC02-05CH11231 and by a grant from the Gordon & Betty Moore Foundation. SB, FB, PAM and MT are partially supported by the PRIN-INAF 2009 with the project ‘Supernovae Variety and Nucleosynthesis Yields’. VS acknowledges financial support from Fundação para a Ciência e a Tecnologia under program Ciência 2008. This research has benefited from the European supernova collaboration led by SB.
References
- Abazajian et al. (2009) Abazajian K. N., et al., 2009, ApJS, 182, 543
- Arnett (1982) Arnett W. D., 1982, ApJ, 253, 785
- Axelrod (1980) Axelrod T. S., 1980, PhD thesis, Univ. California
- Baldwin et al. (1981) Baldwin J. A., Phillips M. M., Terlevich R., 1981, PASP, 93, 5
- Benetti et al. (2004) Benetti S., et al., 2004, MNRAS, 348, 261
- Benetti et al. (2005) Benetti S., et al., 2005, ApJ, 623, 1011
- Bertin & Arnouts (1996) Bertin E., Arnouts S., 1996, A&AS, 117, 393
- Bessell (1990) Bessell M. S., 1990, PASP, 102, 1181
- Blanton et al. (2003) Blanton M. R., et al., 2003, ApJ, 592, 819
- Bowers et al. (1997) Bowers E. J. C., Meikle W. P. S., Geballe T. R., Walton N. A., Pinto P. A., Dhillon V. S., Howell S. B., Harrop-Allin M. K., 1997, MNRAS, 290, 663
- Branch (2006) Branch D., 2006, Nature, 443, 283
- Branch et al. (2006) Branch D., et al., 2006, PASP, 118, 560
- Cardelli et al. (1989) Cardelli J. A., Clayton G. C., Mathis J. S., 1989, ApJ, 345, 245
- Childress et al. (2010) Childress M., et al., 2010, ApJ submitted
- Conley et al. (2006) Conley A., et al., 2006, AJ, 132, 1707
- Contardo et al. (2000) Contardo G., Leibundgut B., Vacca W. D., 2000, A&A, 359, 876
- Contreras et al. (2010) Contreras C., et al., AJ, 139, 519
- Couch & Arnett (1975) Couch R. G., Arnett W. D., 1975, ApJ, 196, 791
- Delahaye et al. (2010) Delahaye F., Pinsonneault M. H., Pinsonneault L., Zeippen C. J., 2010, APJL submitted (arXiv:1005.0423)
- Emsellem et al. (2007) Emsellem E., et al., 2007, MNRAS, 379, 401
- Ergma & Paczyński (1974) Ergma E., Paczyński B., 1974, Acta Astronomica, 24, 1
- Fassia et al. (2001) Fassia A., et al., 2001, MNRAS, 325, 907
- Filippenko (1982) Filippenko A. V., 1982, PASP, 94, 715
- Filippenko et al. (1992) Filippenko A. V., et al., 1992, ApJ, 384, L15
- Fixsen et al. (1996) Fixsen D. J., Cheng E. S., Gales J. M., Mather J. C., Shafer R. A., Wright E. L., 1996, ApJ, 473, 576
- Folatelli et al. (2006) Folatelli G., et al., 2006, ApJ, 641, 1039
- Galama et al. (1998) Galama T. J., et al., 1998, Nature, 395, 670
- Garnavich et al. (2004) Garnavich P. M., et al., 2004, ApJ, 613, 1120
- Gómez et al. (1996) Gómez G., López R., Sánchez F., 1996, AJ, 112, 2094
- Hamuy et al. (1992) Hamuy M., Walker A. R., Suntzeff N. B., Gigoux P., Heathcote S. R., Phillips M. M., 1992, PASP, 104, 533
- Hamuy et al. (1994) Hamuy M., Suntzeff N. B., Heathcote S. R., Walker A. R., Gigoux P., Phillips M. M., 1994, PASP, 106, 566
- Hamuy et al. (1996) Hamuy M., Phillips M. M., Suntzeff N. B., Schommer R. A., Maza J., Smith R. C., Lira P., Avilés R., 1996, AJ, 112, 2438
- Hamuy et al. (2002) Hamuy M., et al., 2002, AJ, 124, 417
- Hamuy et al. (2003) Hamuy M., et al., 2003, Nature, 424, 651
- Harutyunyan et al. (2009) Harutyunyan A., Elias-Rosa N., Benetti S., 2009, CBET, 1768
- Hayden et al. (2010) Hayden B. T., et al., 2010, ApJ, 712, 350
- Hicken et al. (2007) Hicken M., Garnavich P. M., Prieto J. L., Blondin S., DePoy D. L., Kirshner R. P., Parrent J., 2007, ApJ, 669, L17
- Hicken et al. (2009) Hicken M., et al., 2009, ApJ, 700, 331
- Hillebrandt & Niemeyer (2000) Hillebrandt W., Niemeyer J., 2000, ARA&A, 38, 191
- Hillebrandt et al. (2007) Hillebrandt W., Sim S. A., Röpke F. K., 2007, A&A, 465, L17
- Hjorth et al. (2003) Hjorth J., et al., 2003, Nature, 423, 847
- Höflich & Khokhlov (1996) Höflich P., Khokhlov A., 1996, ApJ, 457, 500
- Horne (1986) Horne K., 1986, PASP, 98, 609
- Howell et al. (2006) Howell D. A., et al., 2006, Nature, 443, 308
- Hunt et al. (1998) Hunt L. K., Mannucci F., Testi L., Migliorini S., Stanga R. M., Baffa C., Lisi F., Vanzi L., 1998, AJ, 115, 2594
- Hunter et al. (2009) Hunter D., et al., 2009, A&A, 508, 371
- Iben (1982) Iben I. Jr., 1982, ApJ, 253, 248
- Iben & Renzini (1983) Iben I. Jr., Renzini A., 1983, ARAA, 21, 271
- Kasen (2006) Kasen D., 2006, ApJ, 649, 939
- Kawabata et al. (2009) Kawabata K. S., Maeda K., Nomoto K., Taubenberger S., Tanaka M., Hattori T., Itagaki K., 2010, Nature, 465, 326
- Kewley & Ellison (2008) Kewley, L. J., Ellison S. L., 2008, ApJ, 681, 1183
- Kewley et al. (2006) Kewley L. J., Groves B., Kauffmann G., Heckman T., 2006, MNRAS, 372, 961
- Koester et al. (1979) Koester D., Schulz H., Weidemann V., 1979, A&A, 76, 262
- Krisciunas et al. (2003) Krisciunas K., et al., 2003, AJ, 125, 166
- Krisciunas et al. (2004) Krisciunas K., Phillips M. M., Suntzeff N. B., 2004, ApJ, 602, L81
- Krisciunas et al. (2007) Krisciunas K., et al., 2007, AJ, 133, 58
- Kromer & Sim (2009) Kromer M., Sim S. A., 2009, MNRAS, 398, 1809
- Landolt (1992) Landolt A. U., 1992, AJ, 104, 340
- Langer et al. (2000) Langer N., Deutschmann A., Wellstein S., Höflich P., 2000, A&A, 362, 1046
- Le Borgne & Rocca-Volmerange (2002) Le Borgne D., Rocca-Volmerange B., 2002, A&A, 386, 446
- Leibundgut (2001) Leibundgut B., 2001, ARA&A, 39, 67
- Leloudas et al. (2009) Leloudas G., et al., 2009, A&A, 505, 265
- Li et al. (2003) Li W., et al., 2003, PASP, 115, 453
- Liebert et al. (2005) Liebert J., Bergeron P., Holberg J. B., 2005, ApJ, 156, 47
- Lira (1995) Lira P., 1995, Master thesis, Univ. Chile
- Maeda et al. (2006) Maeda K., Mazzali P. A., Nomoto K., 2006, ApJ, 645, 1331
- Maeda et al. (2007) Maeda K., et al., 2007, ApJ, 666, 1069
- Maeda et al. (2009) Maeda K., Kawabata K., Li W., Tanaka M., Mazzali P. A., Hattori T., Nomoto K., Filippenko A. V., 2009, ApJ, 690, 1745
- Marion et al. (2009) Marion H., Garnavich P., Challis P., 2009, CBET, 1776
- Marion et al. (2009a) Marion G. H., Höflich P., Gerardy C. L., Vacca W. D., Wheeler J. C., Robinson E. L., 2009a, AJ, 138, 727
- Mazzali et al. (1995) Mazzali P. A., Danziger I. J., Turatto M., 1995, A&A, 297, 509
- Mazzali et al. (1997) Mazzali P. A., Chugai N., Turatto M., Lucy L. B., Danziger I. J., Cappellaro E., della Valle M., Benetti S., 1997, MNRAS, 284, 151
- Mazzali et al. (2001) Mazzali P. A., Nomoto K., Cappellaro E., Nakamura T., Umeda H., Iwamoto K., 2001, ApJ, 547, 988
- Mazzali et al. (2005) Mazzali P. A., et al., 2005, ApJ, 623, L37
- Mazzali et al. (2007) Mazzali P. A., Röpke F. K., Benetti S., Hillebrandt W., 2007, Sci, 315, 825
- McKenzie & Schaefer (1999) McKenzie E. H., Schaefer B. E., 1999, PASP, 111, 964
- Miyaji et al. (1980) Miyaji S., Nomoto K., Yokoi K., Sugimoto D., 1980, Pub. Astr. Soc. Japan, 32, 303
- Moriya (et al.2010) Moriya T., Tominaga N., Tanaka M., Maeda K., Nomoto K., 2010, ApJ, 717, L83
- Morrissey et al. (2007) Morrissey P., et al., 2007, ApJS, 173, 682
- Mould et al. (2000) Mould J., et al., 2000, ApJ, 529, 786
- Nomoto et al. (1990) Nomoto K.., Filippenko A. V., Shigeyama T., 1990, A&A, 240, L1
- Oke (1990) Oke J. B., 1990, AJ, 99, 1621
- Pakmor et al. (2010) Pakmor R., Kromer M., Röpke F. K., Sim S. A., Ruiter A. J., Hillebrandt W., 2010, Nature, 463, 61
- Pastorello et al. (2007a) Pastorello A., et al., 2007a, MNRAS, 376, 1301
- Pastorello et al. (2007b) Pastorello A., et al., 2007b, MNRAS, 377, 1531
- Patat et al. (2001) Patat F., et al., 2001, ApJ, 555, 900
- Pettini & Pagel (2004) Pettini M., Pagel B. E. J., 2004, MNRAS, 348, L59
- Pfannes et al. (2010) Pfannes J. M. M., Niemeyer J. C., Schmidt W., 2010, A&A, 509, A75
- Phillips et al. (1999) Phillips M. M., Lira P., Suntzeff N. B., Schommer R. A., Hamuy M., Maza J., 1999, AJ, 118, 1766
- Phillips et al. (2007) Phillips M. M., et al., 2007, PASP, 119, 360
- Pignata et al. (2004) Pignata G., et al., 2004, MNRAS, 355, 178
- Pinto & Eastman (2001) Pinto P. A., Eastman R. G., 2001, NewA, 6, 307
- Puckett et al. (2009) Puckett T., Moore R., Newton J., 2009, CBET, 1762
- Quimby et al. (2009) Quimby R., Kasliwal M. M., Nugent P., Howell D. A., Rau A., Bhalerao V., 2009, CBET, 1783
- Riess et al. (1999) Riess A. G., et al., 1999, AJ, 118, 2675
- Riess et al. (2007) Riess A. G., et al., 2007, ApJ, 659, 98
- Ruiz-Lapuente et al. (1992) Ruiz-Lapuente P., Cappellaro E., Turatto M., Gouiffes C., Danziger I. J., Della Valle M., Lucy L. B., 1992, ApJ, 387, L33
- Sahu et al. (2008) Sahu D. K., et al., 2008, ApJ, 680, 580
- Saio & Nomoto (1985) Saio H., Nomoto K., 1985, A&A, 150, L21
- Scalzo et al. (2010) Scalzo R. A., et al., 2010, ApJ, 713, 1073
- Schlegel et al. (1998) Schlegel D. J., Finkbeiner D. P., Davis M., 1998, ApJ, 500, 525
- Sim et al. (2007) Sim S. A., Sauer D. N., Röpke F. K., Hillebrandt W., 2007, MNRAS, 378, 2
- Silverman et al. (2011) Silverman J. M., Ganeshalingam M., Li W., Filippenko A. V., Miller A. A., Poznanski D., 2011, MNRAS, 410, 585
- Skrutskie et al. (2006) Skrutskie M. F., et al., 2006, AJ, 131, 1163
- Sollerman et al. (2000) Sollerman J., Kozma C., Fransson C., Leibundgut B., Lundqvist P., Ryde F., Woudt P., 2000, ApJ, 537, L127
- Spruit (1998) Spruit H., 1998, A&A, 333, 603
- Spyromilio et al. (2004) Spyromilio J., Gilmozzi R., Sollerman J., Leibundgut B., Fransson C., Cuby J.-G., 2004, A&A, 426, 547
- Stanishev (2007) Stanishev V., 2007, AN, 328, 948
- Stanishev et al. (2007a) Stanishev V., et al., 2007a, A&A, 469, 645
- Stanishev et al. (2007b) Stanishev V., et al., 2007b, AIP Conference Proceedings, 924, 336
- Stoughton et al. (2002) Stoughton C., et al., 2002, AJ, 123, 485
- Stritzinger et al. (2002) Stritzinger M., et al., 2002, AJ, 124, 2100
- Strovink (2007) Strovink M., 2007, ApJ, 671, 1084
- Sullivan et al. (2010) Sullivan M., et al., 2010, MNRAS, 406, 782
- Tanaka et al. (2008) Tanaka M., et al., 2008, ApJ, 677, 448
- Tanaka et al. (2010) Tanaka M., et al., 2010, ApJ, 714, 1209
- Taubenberger et al. (2008) Taubenberger S., et al., 2008, MNRAS, 385, 75
- Thomas et al. (2007) Thomas R. C., et al., 2007, ApJ, 654, L53
- Tominaga et al. (2005) Tominaga N., et al., 2005, ApJ, 633, L97
- Tremonti et al. (2004) Tremonti C. A., et al., 2004, ApJ, 613, 898
- Turatto et al. (1996) Turatto M., Benetti S., Cappellaro E., Danziger I. J., Della Valle M., Gouiffes C., Mazzali P. A., Patat F., 1996, MNRAS, 283, 1
- Turatto et al. (2003) Turatto M., Benetti S., Cappellaro E., 2003, in Hillebrandt W., Leibundgut B., eds, Proceedings to the ESO/MPA/MPE Workshop “From Twilight to Highlight: The Physics of Supernovae”. Springer, Berlin, p. 200
- Umeda & Nomoto (2008) Umeda H., Nomoto K., 2008, ApJ, 673, 1014
- Valenti et al. (2008) Valenti S., et al., 2008, ApJ, 673, L155
- Wang et al (2009b) Wang X., et al., 2009b, ApJ, 697, 380
- Wang et al. (2009a) Wang X., et al., 2009a, ApJ, 699, L139
- Wegner & Grogin (2008) Wegner G., Grogin N., 2008, A&A, 136, 1
- Weidemann & Koester (1983) Weidemann V., Koester D., 1983, A&A, 121, 77
- Wood-Vasey et al. (2008) Wood-Vasey W. M., et al., 2008, ApJ, 689, 377
- Yamanaka et al. (2009) Yamanaka M., et al., 2009, ApJ, 707, L118
- Yoon & Langer (2005) Yoon S.-C., Langer N., 2005, A&A, 435, 967
Appendix A Table of S- and K-corrections
| Epoch | Tel.b | ||||||||||
|---|---|---|---|---|---|---|---|---|---|---|---|
| NOT | |||||||||||
| NOT | |||||||||||
| LT | |||||||||||
| NOT | |||||||||||
| LT | |||||||||||
| CA | |||||||||||
| TNG | |||||||||||
| LT | |||||||||||
| LT | |||||||||||
| CA | |||||||||||
| TNG | |||||||||||
| LT | |||||||||||
| CA | |||||||||||
| LT | |||||||||||
| NOT | |||||||||||
| NOT | |||||||||||
| LT | |||||||||||
| NOT | |||||||||||
| LT | |||||||||||
| LT | |||||||||||
| TNG | |||||||||||
| LT | |||||||||||
| LT | |||||||||||
| NTT | |||||||||||
| NOT | |||||||||||
| NOT | |||||||||||
| Ekar | |||||||||||
| Ekar | |||||||||||
| LT | |||||||||||
| CA | |||||||||||
| LT | |||||||||||
| LT | |||||||||||
| NOT | |||||||||||
| LT | |||||||||||
| LT | |||||||||||
| NOT | |||||||||||
| LT | |||||||||||
| NOT | |||||||||||
| LT | |||||||||||
| LT | |||||||||||
| TNG | |||||||||||
| LT | |||||||||||
| NOT | |||||||||||
| LT | |||||||||||
| NTT | |||||||||||
| LT | |||||||||||
| LT | |||||||||||
| LT | |||||||||||
| NOT | |||||||||||
| LT | |||||||||||
| CA | |||||||||||
| LT | |||||||||||
| LT | |||||||||||
| CA | |||||||||||
| NOT | |||||||||||
| Ekar | |||||||||||
| Ekar | |||||||||||
| LT | |||||||||||
| LT | |||||||||||
| LT | |||||||||||
| CA | |||||||||||
| LT | |||||||||||
| LT | |||||||||||
| CA | |||||||||||
| LT | |||||||||||
| LT | |||||||||||
| LT | |||||||||||
| LT | |||||||||||
| LT | |||||||||||
| LT | |||||||||||
| NOT | |||||||||||
| NTT | |||||||||||
| NTT | |||||||||||
| NTT | |||||||||||
| NOT | |||||||||||
| TNG |