Insights Into the High-energy -ray Emission of Markarian 501 from Extensive Multifrequency Observations in the \FermiEra
Abstract
We report on the -ray activity of the blazar Mrk 501 during the first 480 days of \Fermioperation. We find that the average LAT -ray spectrum of Mrk 501 can be well described by a single power-law function with a photon index of . While we observe relatively mild flux variations with the Fermi-LAT (within less than a factor of 2), we detect remarkable spectral variability where the hardest observed spectral index within the LAT energy range is , and the softest one is . These unexpected spectral changes do not correlate with the measured flux variations above GeV. In this paper, we also present the first results from the 4.5-month-long multifrequency campaign (2009 March 15 – August 1) on Mrk 501, which included the VLBA, Swift, RXTE, MAGIC and VERITAS, the F-GAMMA, GASP-WEBT, and other collaborations and instruments which provided excellent time and energy coverage of the source throughout the entire campaign. The extensive radio to TeV data set from this campaign provides us with the most detailed spectral energy distribution yet collected for this source during its relatively low activity. The average spectral energy distribution of Mrk 501 is well described by the standard one-zone synchrotron self-Compton model. In the framework of this model, we find that the dominant emission region is characterized by a size pc (comparable within a factor of few to the size of the partially-resolved VLBA core at 15-43 GHz), and that the total jet power ( erg s-1) constitutes only a small fraction () of the Eddington luminosity. The energy distribution of the freshly-accelerated radiating electrons required to fit the time-averaged data has a broken power-law form in the energy range GeV TeV, with spectral indices 2.2 and 2.7 below and above the break energy of GeV. We argue that such a form is consistent with a scenario in which the bulk of the energy dissipation within the dominant emission zone of Mrk 501 is due to relativistic, proton-mediated shocks. We find that the ultrarelativistic electrons and mildly relativistic protons within the blazar zone, if comparable in number, are in approximate energy equipartition, with their energy dominating the jet magnetic field energy by about two orders of magnitude.
1 Introduction
Blazars constitute a subclass of radio-loud active galactic nuclei (AGN), in which a jet of magnetized plasma assumed to emanate with relativistic bulk velocity from close to a central supermassive black hole points almost along the line of sight. The broadband emission spectra of these objects are dominated by non-thermal, strongly Doppler-boosted and variable radiation produced in the innermost part of the jet. Most of the identified extragalactic -ray sources detected with the EGRET instrument (Hartman et al. 1999) on board the Compton Gamma Ray Observatory belong to this category. Blazars include flat-spectrum radio quasars (FSRQs) and BL Lacertae objects (BL Lacs). Even though blazars have been observed for several decades at different frequencies, the existing experimental data did not permit unambiguous identification of the physical mechanisms responsible for the production of their high-energy (-ray) emission. Given the existing high-sensitivity detectors which allow detailed study of the low-energy (synchrotron) component of blazar sources (extending from radio up to hard X-rays), one of the reasons for the incomplete understanding of those objects was only moderate sensitivity of previous -ray instruments. This often precluded detailed cross-correlation studies between the low- and high-energy emission and did not provide enough constraints on the parameters of the theoretical models. Some of the open and fundamental questions regarding blazar sources are (i) the content of their jets, (ii) the location and structure of their dominant emission zones, (iii) the origin of their variability, observed on timescales from minutes to tens of years, (iv) the role of external photon fields (including the extragalactic background light, EBL) in shaping their observed -ray spectra, and (v) the energy distribution and the dominant acceleration mechanism for the underlying radiating particles.
The Large Area Telescope (LAT) instrument (Atwood et al., 2009) on board the \FermiGamma-ray Space Telescope satellite provides a large improvement in the experimental capability for performing -ray astronomy, and hence it is shedding new light on the blazar phenomenon. In this paper, we report on the \Fermiobservations of the TeV-emitting high-frequency-peaked — or, according to a more recent classification (Abdo et al., 2010c), high-synchrotron-peaked (HSP) — BL Lac object Markarian 501 (Mrk 501; RA=16h 45m 52.22s, Dec= 39∘ 45’ 36.6” , J2000, redshift ), which is one of the brightest extragalactic sources in the X-ray/TeV sky. Mrk 501 was the second extragalactic object (after Markarian 421) identified as a very high energy (thereafter VHE) -ray emitter (Quinn et al., 1996; Bradbury et al., 1997). After a phase of moderate emission lasting for about a year following its discovery (1996), Mrk 501 went into a state of surprisingly high activity and strong variability, becoming 10 times brighter than the Crab Nebula at energies TeV, as reported by various instruments/groups (Catanese et al., 1997; Samuelson et al., 1998; Aharonian et al., 1999a, b, c; Djannati-Ataï et al., 1999). In 1998-1999, the mean VHE -ray flux dropped by an order of magnitude, and the overall VHE spectrum softened significantly (Piron, 2000; Aharonian et al., 2001). In 2005, -ray flux variability on minute timescales was observed in the VHE band, thus establishing Mrk 501 as one of the sources with the fastest -ray flux changes (Albert et al., 2007a). During the 2005 VHE flux variations (when Mrk 501 was 3–4 times dimmer than it was in 1997), significant spectral variability was detected as well, with a clear “harder when brighter” behavior. Those spectral variations are even more pronounced when compared with the spectrum measured during the low activity level recently reported in Anderhub et al. (2009).
The spectral energy distribution (SED) and the multifrequency correlations of Mrk 501 have been intensively studied in the past (e.g., Pian et al., 1998; Villata & Raiteri, 1999; Krawczynski et al., 2000; Sambruna et al., 2000; Tavecchio et al., 2001; Katarzyński et al., 2001; Ghisellini et al., 2002; Gliozzi et al., 2006; Anderhub et al., 2009), but the nature of this object is still far from being understood. The main reasons for this lack of knowledge are the sparse multifrequency data during long periods of time, and the moderate sensitivity available in the past to study the -ray emission of this source. Besides, most of the previous multifrequency campaigns were triggered by an enhanced flux level in some energy band, and hence much of our information about the source is biased towards “high-activity” states, where perhaps distinct physical processes play a dominant role. In addition, until now we knew very little about the GeV emission of Mrk 501. The only detection reported at GeV energies before \Fermiwas in Kataoka et al. (1999), but the significance of this detection was too low to include Mrk 501 in the 3rd EGRET catalog (Hartman et al., 1999). Moreover, Mrk 501 was not detected by EGRET during the large X-ray and VHE -ray flare which lasted for several months in 1997 (Pian et al., 1998).
The large improvement in the performance provided by the Fermi-LAT compared with its predecessor, EGRET, provides us with a new perspective for the study of blazars like Mrk 501. However, it is important to emphasize that blazars can vary their emitted power by one or two orders of magnitude on short timescales, and that they emit radiation over the entire observable electromagnetic spectrum (from eV up to eV). For this reason, the information from Fermi-LAT alone is not enough to understand the broadband emission of Mrk 501, and hence simultaneous data in other frequency ranges are required. In particular, the frequency ranges where the low- and high-energy spectral components peak in the SED representation are of major importance. In the case of Mrk 501, those peaks are typically located around keV (low-energy bump) and GeV (high-energy bump), and hence simultaneous UV/X-ray and GeV/TeV observations are essential for the proper reconstruction of the overall SED of Mrk 501. At TeV energies there has been a substantial improvement in the instrumental capability as a result of the deployment of a new generation of imaging atmospheric Cherenkov telescopes (IACTs). In particular, for the study of Mrk 501, the new telescope systems MAGIC and VERITAS provide greater sensitivity, wider energy range and improved energy resolution compared with the previous generation of instruments. Simultaneous observations with Fermi-LAT and IACTs like MAGIC or VERITAS (potentially covering six decades in energy, from MeV to TeV) can, for the first time, significantly resolve both the rising and the falling segments of the high-energy emission component of Mrk 501, with the expected location of the SED peak in the overlapping energy range between those instruments. Because of the smaller collection area, and the self-veto problem111The self-veto problem in EGRET is the degradation of the effective area at high energies (5 GeV) due to backsplash of secondary particles from the calorimeter causing the anticoincidence system to veto the event. This problem is substantially reduced in LAT by using a segmented anticoincidence detector., the sensitivity of EGRET to detect -rays with energies larger than 10 GeV was about two orders of magnitude lower than that of Fermi-LAT222This estimate includes the larger exposure from Fermi-LAT due to the 4 times larger field of view.. Besides, during the period of operation of EGRET, the sensitivity of the previous generation of IACTs was only moderate, with relatively low sensitivity below TeV. Therefore, the higher sensitivity and larger energy range of the newer -ray instruments has become a crucial tool for studying Mrk 501, and the blazar phenomenon in general.
In order to exploit the performance of the Fermi-LAT and the new IACTs, as well as the capabilities of several existing instruments observing at radio-to-X-ray frequencies, a multifrequency (from radio to TeV photon energies) campaign was organized to monitor Mrk 501 during a period of 4.5 months, from mid-March to August 2009. The scientific goal was to collect a very complete, simultaneous, multifrequency data set that would allow current theoretical models of broadband blazar emission to be tested. This, in turn, should help us to understand the origin of high-energy emission of blazar sources and the physical mechanisms responsible for the acceleration of radiating particles in relativistic jets in general. In this paper, the only reported result from the multifrequency observations is the overall SED averaged over the duration of the observing campaign. A more in-depth analysis of the multifrequency data set will be given in a forthcoming paper. The scientific results from the data collected during the two-day time interval 2009 March 23-25 (which includes extensive observations with the Suzaku X-ray satellite) will be reported in a separate paper (Acciari et al., 2010b). The paper is organized as follows. In §2 we introduce the LAT instrument and describe the LAT data analysis. In §3 we report on the flux/spectral variability of Mrk 501 observed during the first 16 months of Fermi-LAT operation, and compare it with the flux variability observed in X-rays by the all-sky instruments RXTE (Bradt et al., 1993) All Sky Monitor (ASM) and the Swift (Gehrels et al., 2004) Burst Alert Telescope (BAT). In §4 we analyze the -ray spectrum of Mrk 501 measured by Fermi-LAT in the energy range GeV. §5 reports on the overall SED obtained during the 4.5-month-long multifrequency campaign organized in 2009. §6 is devoted to SED modeling, the results of which are further discussed in §7. Conclusions are presented in §8.
2 Fermi-LAT Data Selection and Analysis
The Fermi-LAT is an instrument to perform -ray astronomy above MeV. The instrument is an array of identical towers, each one consisting of a tracker (where the photons are pair-converted) and a calorimeter (where the energies of the pair-converted photons are measured). The entire instrument is covered with an anticoincidence detector to reject charged-particle background. The LAT has a peak effective area of m2 for GeV photons, an energy resolution typically better than and a field of view (FoV) of about sr, with an angular resolution ( containment angle) better than for energies above GeV. Further details on the LAT can be found in Atwood et al. (2009).
The LAT data reported in this paper were collected from 2008 August 5 (MJD 54683) to 2009 November 27 (MJD 55162). During this time, the Fermi-LAT instrument operated mostly in survey mode. The analysis was performed with the Fermi Science Tools software package version v9r15p6. Only events with the highest probability of being photons — those in the “diffuse” class — were used. The LAT data were extracted from a circular region of radius centered at the location of Mrk 501. The spectral fits were performed using photon energies in the energy range GeV. At photon energies above 0.3 GeV the effective area of the instrument is relatively large ( m2) and the angular resolution relatively good ( containment angle smaller than ). In particular, because of the better angular resolution, the spectral fits using energies above GeV (instead of GeV) are less sensitive to possible contamination from unaccounted (perhaps transient), neighboring -ray sources and hence have smaller systematic errors, at the expense of reducing somewhat the number of photons from the source. In addition, a cut on zenith angle () was applied to reduce contamination from Earth-albedo -rays, which are produced by cosmic rays interacting with the upper atmosphere.
The background model used to extract the -ray signal includes a Galactic diffuse emission component and an isotropic component. The model that we adopted for the Galactic component is gll_iem_v02.fit333http://fermi.gsfc.nasa.gov/ssc/data/access/lat/BackgroundModels.html. The isotropic component, which is the sum of the extragalactic diffuse emission and the residual charged-particle background, is parametrized here with a single power-law function. To reduce systematic uncertainties in the analysis, the photon index of the isotropic component and the normalization of both components in the background model were allowed to vary freely during the spectral point fitting. Owing to the relatively small size of the region analyzed (radius 10∘) and the hardness of the spectrum of Mrk 501, the high-energy structure in the standard tabulated isotropic background spectrum isotropic_iem_v02.txt does not dominate the total counts at high energies. In addition we find that for this region a power-law approximation to the isotropic background results in somewhat smaller residuals for the overall model, possibly because the isotropic term, with a free spectral index, compensates for an inaccuracy in the model for the Galactic diffuse emission, which is also approximately isotropic at the high Galactic latitude of Mrk 501 (). In any case, the resulting spectral fits for Mrk 501 are not significantly different if isotropic_iem_v02.txt is used for the analysis. In addition, the model also includes five nearby sources from the 1FGL catalog (Abdo et al., 2010b): 1FGL J1724.0+4002, 1FGL J1642.5+3947, 1FGL J1635.0+3808, 1FGL J1734.4+3859, and 1FGL J1709.6+4320. The spectra of those sources were also parameterized by a power-law functions, whose photon index values were fixed to the values from the 1FGL catalog, and only the normalization factors for the single sources were left as free parameters. The spectral analysis was performed with the post-launch instrument-response functions P6_V3_DIFFUSE using an unbinned maximum-likelihood method (Mattox et al., 1996). The systematic uncertainties on the flux were estimated as at GeV, at MeV and at GeV and above444http://fermi.gsfc.nasa.gov/ssc/data/analysis/LAT_caveats.html.
3 Flux and Spectral Variability
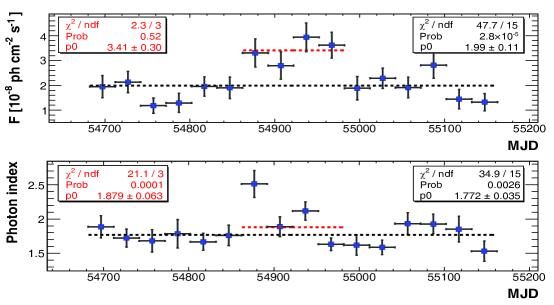
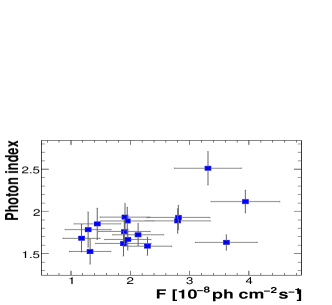
The high sensitivity and survey-mode operation of Fermi-LAT permit systematic, uninterrupted monitoring of Mrk 501 in -rays, regardless of the activity level of the source. The measured -ray flux above GeV and the photon index from a power-law fit are shown in the left panel of Figure 1. The data spans the time from 2008 August 5 (MJD 54683) to 2009 November 27 (MJD 55162), binned in time intervals of 30 days. The Test Statistic (TS) values555The Test Statistic value quantifies the probability of having a point -ray source at the location specified. It is roughly the square of the significance value: a TS of 25 would correspond to a signal of approximately 5 standard deviations (Mattox et al., 1996). for the 16 time intervals are all in excess of 50 (i.e., standard deviations, hereafter ), with three-quarters of them greater than 100 (i.e., ). During this 480-day period, Mrk 501 did not show any outstanding flaring activity in the Fermi-LAT energy range, but there appear to be flux and spectral variations on timescales of the order of 30 days. During the 120-day period MJD 54862–54982, the photon flux above GeV was ph cm-2 s-1, which is about twice as large as the averaged flux values before and after that time period, which are ph cm-2 s-1 and ph cm-2 s-1, respectively. Remarkably, the photon index changed from for the first 30-day interval of this “enhanced-flux period” to for the last 30-day interval. As shown in the red legend of the bottom plot in the left panel of Figure 1, a constant fit to the photon index values of this 120-day period gives a null probability of , hence a deviation of . A constant fit to the entire 16-month period gives a null probability of , hence spectral variability is detected for the entire data set at the level of . It is worth stressing that the spectral variability in the 480-day time interval is entirely dominated by the spectral variability occurring during the 120-day time interval of MJD 54862–54982, with no significant spectral variability before or after this “enhanced-flux period”. The right plot in Figure 1 does not show any clear correlation between the flux and the spectral variations. The discrete correlation function computed as prescribed in Edelson & Krolik (1988) gives for a time lag of zero.
Mrk 501 is known for showing spectral variability at VHE -ray energies. During the large X-ray/-ray flare in 1997, Whipple and (especially) CAT observations showed evidence of spectral curvature and variability (Samuelson et al., 1998; Djannati-Ataï et al., 1999). The spectral changes are larger when comparing the measurements from 1997 with the low states from 1998 and 1999, as reported by CAT and HEGRA (Piron, 2000; Aharonian et al., 2001). The MAGIC telescope, with lower energy threshold and higher sensitivity than the Whipple, HEGRA and CAT telescopes, observed remarkable spectral variability in 2005, when the -ray activity of Mrk 501 was significantly smaller than that observed in 1997 (Albert et al., 2007a). The spectral variability is even larger when comparing the MAGIC measurements from 2005 with those from 2006 when the source was in an even lower state (Anderhub et al., 2009). However, despite the measured spectral variability at VHE -ray energies, the outstanding spectral steepening at GeV energies observed during the time interval MJD 54862–54892 was not envisioned in any of the previous works in the literature; the modeled spectrum of Mrk 501 at GeV energies was always assumed to be hard (photon indices ). This observational finding, further discussed in §4 and §7, shows the importance of having a -ray instrument capable of long-term, uninterrupted, high-sensitivity monitoring of Mrk 501 and other HSP BL Lacs, and it points to the important role Fermi-LAT will play in improving our understanding of the physics behind the blazar phenomenon.
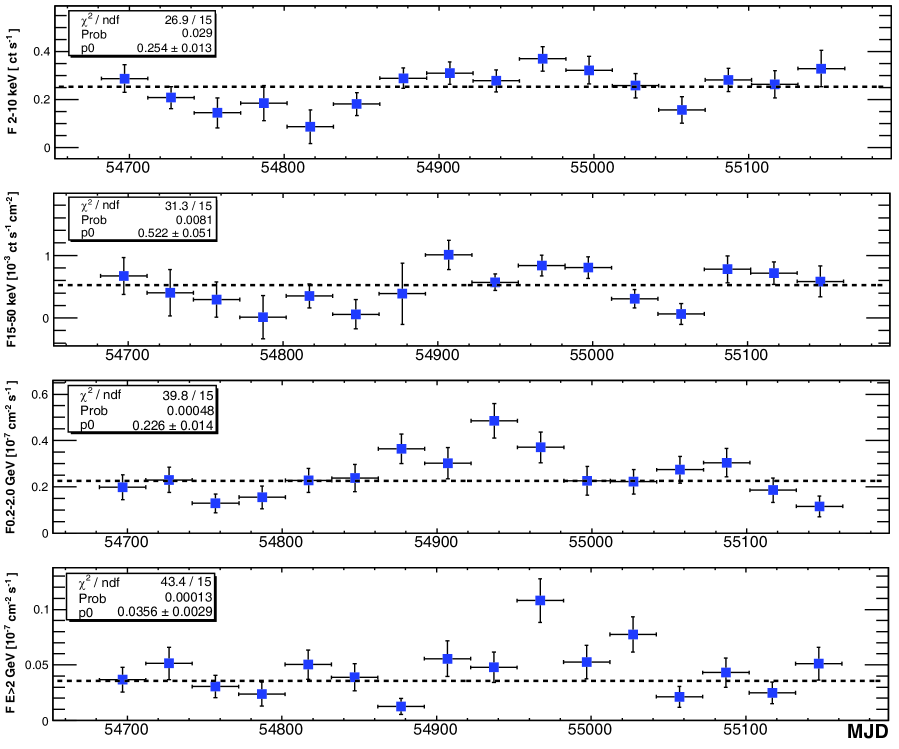
The Fermi-LAT capability for continuous source monitoring is complemented at X-ray frequencies by RXTE-ASM and Swift-BAT, the two all-sky instruments that can probe the X-ray activity of Mrk 501 on a 30-day timescale. Figure 2 shows the fluxes measured by ASM in the energy range keV, by BAT in the energy range keV, and by LAT in two different energy bands: GeV (low-energy band) and GeV (high-energy band)666The fluxes depicted in the Fermi-LAT light curves were computed fixing the photon index to 1.78 (average index during the first 480 days of Fermi operation) and fitting only the normalization factor of the power-law function.. The data from RXTE-ASM were obtained from the ASM web page777http://xte.mit.edu/ASM_lc.html. The data were filtered according to the prescription provided there, and the weighted average over all of the dwells888A dwell is a scan/rotation of the ASM Scanning Shadow Cameras lasting 90 seconds. was determined for the 30-day time intervals defined for the Fermi data. The data from Swift-BAT were gathered from the BAT web page999http://swift.gsfc.nasa.gov/docs/swift/results/transients/. We retrieved the daily averaged BAT values and made the weighted average over all the days from the 30-day time intervals defined for the Fermi data. The X-ray intensity from Mrk 501, averaged over the 16 months, is ct s-1 per Scanning Shadow Camera (SSC) in ASM, and ct s-1 cm-2 in BAT (close to the BAT 30-day detection limit). This X-ray activity is compatible with that recorded in recent years, but quite different from the activity of the source during 1997, when the ASM flux was above ct s-1 per SSC during most of the year, with a peak well above ct s-1 around June 1997.
As noted previously (§1), Mrk 501 is not in the 3rd EGRET catalog, although there was a marginally significant EGRET detection during the -ray outburst (with no clear X-ray counterpart) in 1996 (Kataoka et al., 1999). At that time, the source was detected at a level of at energies above GeV and at above GeV. The flux from the EGRET 1996 flare above GeV was ph cm-2 s-1, which is about five times higher than the average flux observed by Fermi from 2008 August 5 (MJD 54683) to 2009 November 27 (MJD 55162), namely ph cm-2 s-1 (also above photon energy GeV). The Fermi-LAT flux measured during the 120 days with the “enhanced” -ray activity (MJD 54862–54982) is ph cm-2 s-1 (above photon energy GeV), about a factor of three lower than that detected by EGRET in 1996.
In spite of the relatively low activity, the ASM and BAT fluxes show some flux variations and a positive correlation between the fluxes measured by these two instruments. The discrete correlation function for the ASM/BAT data points shown in Figure 2 is for a time lag of zero. On the other hand, the X-ray ASM/BAT fluxes are not significantly correlated with the -ray LAT fluxes. We found, for a time lag of zero, for the ASM/LAT ( GeV) and for the ASM/LAT ( GeV) flux data points shown in Figure 2. It is also interesting to note that the largest flux variations occur at the highest Fermi energies ( GeV), where the -ray flux increased by one order of magnitude during the 120-day interval MJD 54862–54892. This trend is consistent with the photon index hardening revealed by the spectral analysis reported above (see Figure 1).
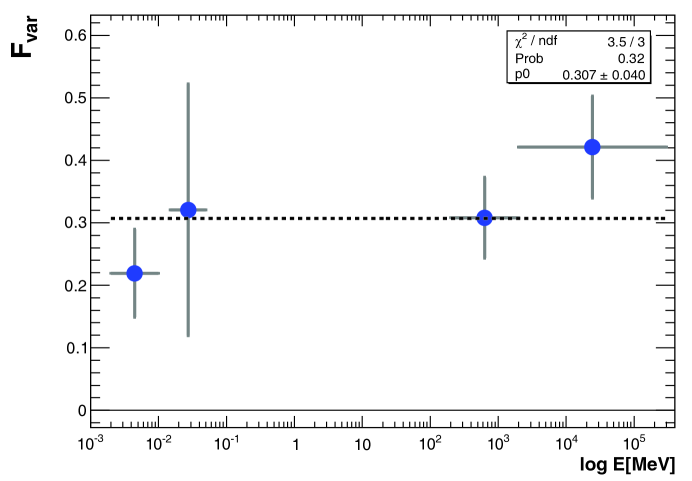
We followed the description given in Vaughan et al. (2003) to quantify the flux variability by means of the fractional variability parameter, , as a function of photon energy. In order to account for the individual flux measurement errors (), we used the “excess variance” as an estimator of the intrinsic source variance (Nandra et al., 1997; Edelson et al., 2002). This is the variance after subtracting the expected contribution from the measurement errors. For a given energy range, is calculated as
| (1) |
where is the mean photon flux, is the standard deviation of the flux points, and is the average mean square error, all determined for a given energy bin.
Figure 3 shows the values derived for the four different energy ranges and the time window covered by the light curves shown in Figure 2. The source is variable at all energies. The uncertainty in the variability quantification for the Swift-BAT energies is large due to the fact that Mrk 501 is a relatively weak X-ray source, and is therefore difficult to detect above keV in exposure times as short as 30 days. On the contrary, the variability at the RXTE-ASM and, especially, Fermi-LAT energies, is significant ( level). The amplitude variability in the two X-ray bands is compatible within errors, and the same holds for the variability in the two -ray bands. As shown in Figure 3, for the hypothesis of a constant over the four energy bands one obtains = 3.5 for 3 degrees of freedom (probability of 0.32), implying that the energy-dependent variability is not statistically significant. It is worth noticing that the limited sensitivity of ASM and (particularly) BAT instruments to detect Mrk 501 in 30-day time intervals, as well as the relatively stable X-ray emission of Mrk 501 during the analyzed observations, precludes any detailed X-ray/-ray variability and correlation analysis.
4 Spectral Analysis up to 400 GeV
The large effective area of the Fermi-LAT instrument permits photon energy reconstruction over many orders of magnitude. As a result, the spectrum of Mrk 501 could be resolved within the energy range GeV, as shown in Figure 4. This is the first time the spectrum of Mrk 501 has been studied with high accuracy over this energy range. The fluxes were computed using the analysis procedures described in §2. The black line in Figure 4 is the result of an unbinned likelihood fit with a single power-law function in the energy range GeV101010The unbinned likelihood fit was performed on photon energies above 0.3 GeV in order to reduce systematics. See §2 for further details., and the red contour is the uncertainty of the fit. The data are consistent with a pure power-law function with a photon index of . The black data points result from the analysis in differential energy ranges111111Because the analysis was carried out in small energy ranges, it was decided to fix the spectral index at (the value obtained from fitting the entire energy range) and fit only the normalization factor. We repeated the same procedure fixing the photon indices to 1.5 and 2.0 and found no significant change. Therefore, the results from the differential energy analysis are not sensitive to the photon index used in the analysis. (). The points are well within from the fit to the overall spectrum (black line), which confirms that the entire Fermi spectrum is consistent with a pure power-law function. Note, however, that, due to the low photon count, the error bars for the highest energy data points are rather large. The predicted (by the model for Mrk 501) number of photons detected by LAT in the energy bins GeV and GeV are only and , respectively. Therefore, even though the signal significance in the highest-energy bins are very high due to the very low background (the TS values for the two highest-energy ranges is 162 and 61, respectively), the large statistical uncertainties could hide a potential turnover in the spectrum of Mrk 501 around GeV photon energies. As we know from past observations, the VHE spectrum is significantly softer than the one observed by Fermi (e.g., Aharonian et al., 2001; Anderhub et al., 2009), and hence the spectrum of Mrk 501 must have a break around the highest Fermi-LAT energies.
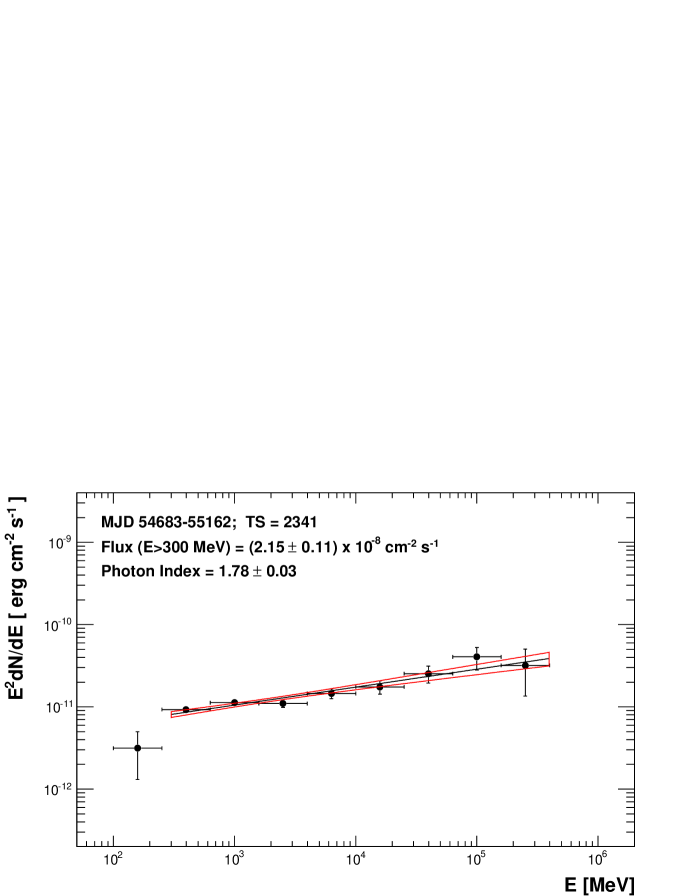
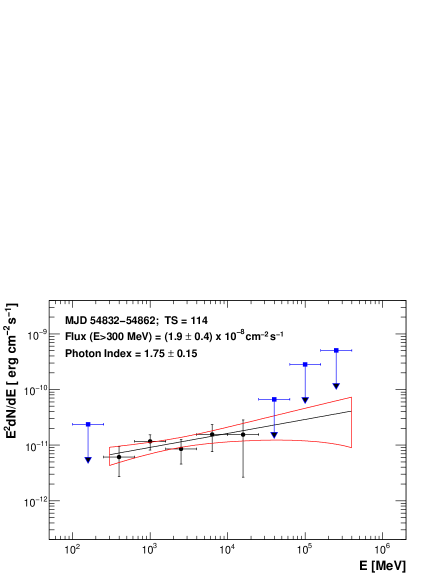
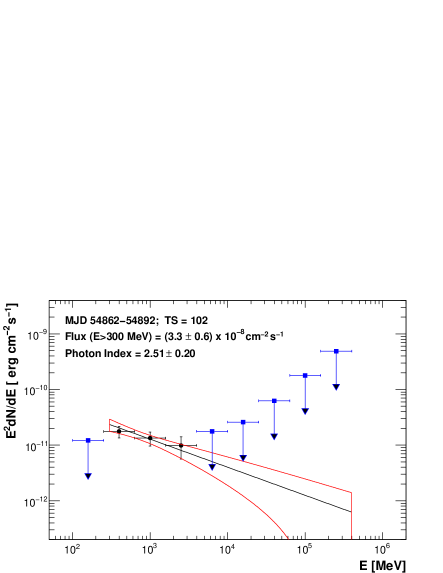
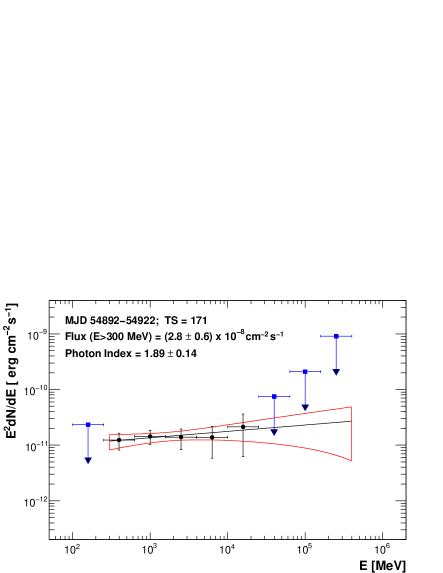
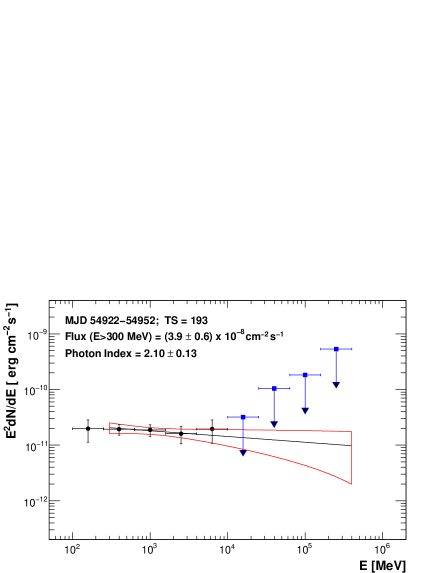
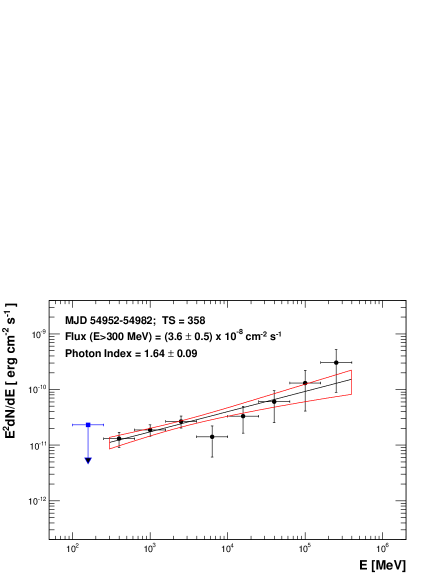
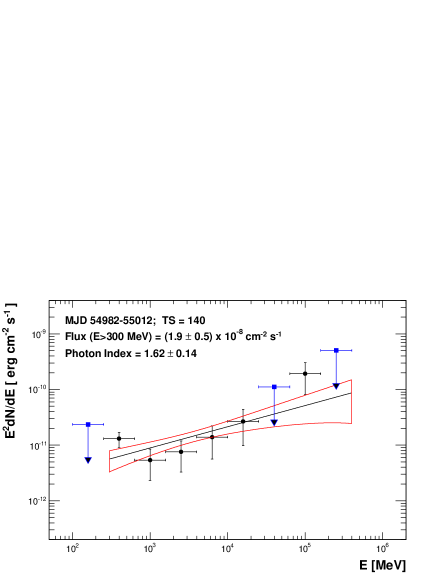
In §3 we reported remarkable spectral variability during the 120-day time interval MJD 54862–54982, when Mrk 501 was characterized by a photon flux (at GeV) twice as large as during the rest of the exposure. In order to understand better the behaviour of the source during that time, we produced SED plots (analogous to that of Figure 4) for each of the 30-day time intervals from the period with the enhanced flux level. These are shown in Figure 5, together with the SED plots from the 30-day time intervals before and after this 120-day epoch, which are representative of the average source behaviour during the other 360 days. The variability of the SED data points below a few GeV is rather mild (factor of two), but above a few GeV the spectra vary substantially (factor of ten). The -ray signal at the highest energies is suppressed during MJD 54862–54982, while it increases by a large factor during MJD 54952–54982, where the analysis model for Mrk 501 predicts 2.0 photons in the energy range GeV. It is worth stressing that for the SED from Figure 4, which corresponds to the total exposure of 480 days, the analysis model for Mrk 501 predicts only 3.2 photons in the highest energy bin. Hence the time interval MJD 54952–54982 holds almost all the signal detected by LAT in the energy range GeV during 16 months. The situation changes somewhat for the lower energy bin GeV, for which the analysis model for Mrk 501 predicts 2.4 photons for the time interval MJD 54952–54982, while it does predict 11.3 photons for the entire 16-month time interval. Fortunately, the 30-day time interval characterized by hard spectrum is covered by the 4.5-month campaign that we organized, and hence simultaneous multifrequency observations (radio to TeV) are available for this particular period, as discussed further below.
5 Broadband Spectral Energy Distribution of Mrk 501
As mentioned in §1, we organized a multifrequency campaign (from radio to TeV photon energies) to monitor Mrk 501 during a time period of 4.5 months. The observing campaign started on March 15, 2009 (MJD 54905) and finished on August 01, 2009 (MJD 55044). The observing goal for this campaign was to sample the broadband emission of Mrk 501 every 5 days, which was largely accomplished whenever the weather and/or technical limitations allowed. The underlying scientific goal has already been outlined in §1. A detailed analysis of the multifrequency variability and correlations, as well as the evolution of the overall spectral energy distribution with time, will be reported in a forthcoming paper. In this section of the manuscript, we describe the source coverage during the campaign and the data analysis for several of the participating instruments, and we report on the averaged SED resulting from the campaign. The modeling of these data and the physical implications are given in §6 and §7 below, respectively.
5.1 Details of the Campaign: Participating Instruments and Temporal Coverage
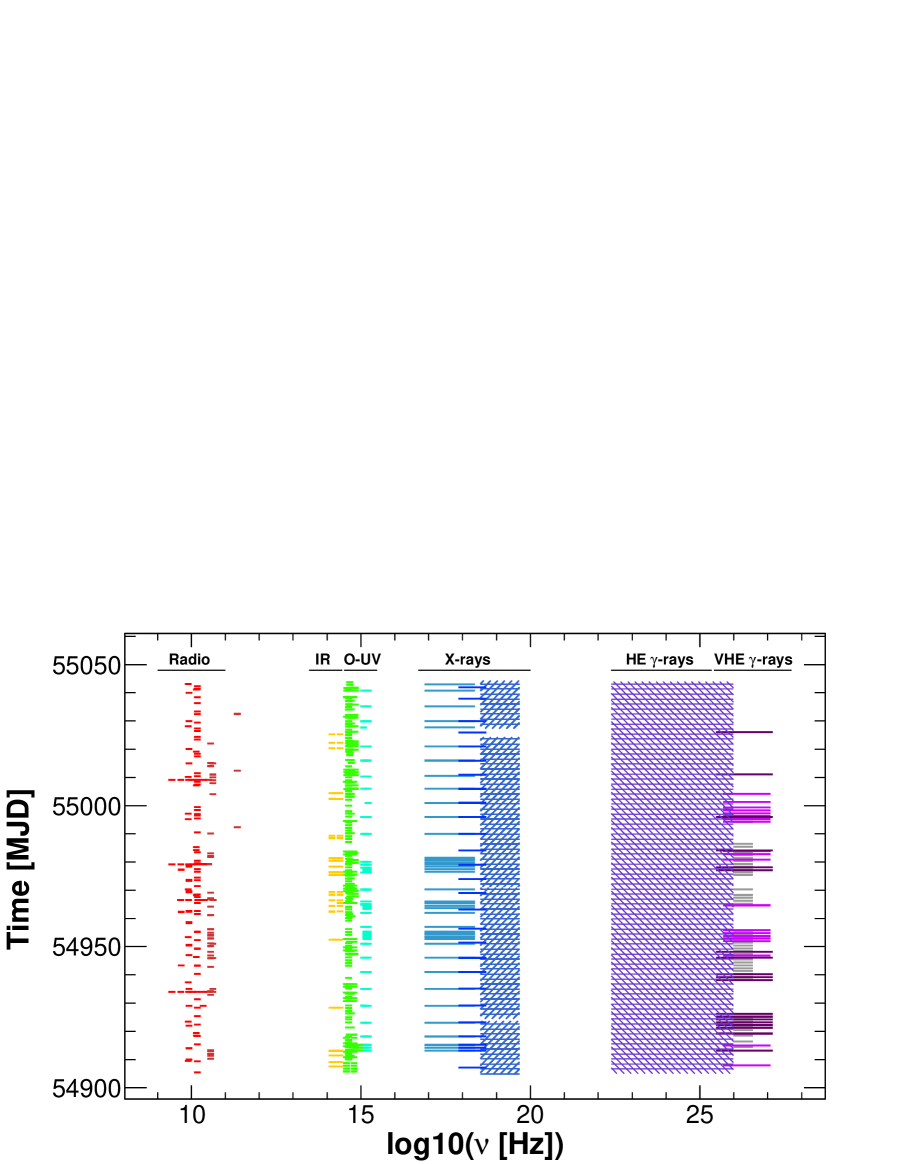
The list of all the instruments that participated in the campaign is given in Table 1, and the scheduled observations can be found online121212https://confluence.slac.stanford.edu/display/GLAMCOG/Campaign+on+Mrk501+(March+2009+to+July+2009). In some cases the planned observations could not be performed due to bad observing conditions, while in some other occasions the observations were performed but the data could not be properly analyzed due to technical problems or rapidly changing weather conditions. In order to quantify the actual time and energy coverage during the campaign on Mrk 501, Figure 6 shows the exposure time as a function of the energy range for the instruments/observations used to produce the SED shown in Figure 8. Apart from the unprecedented energy coverage (including, for the first time, the GeV energy range from Fermi-LAT), the source was sampled quite uniformly with the various instruments participating in the campaign and, consequently, it is reasonable to consider the SED constructed below as the actual average (typical) SED of Mrk 501 during the time interval covered by this multifrequency campaign. The largest non-uniformity in the sampling of the source comes from the Cherenkov Telescopes, which are the instruments most sensitive to weather conditions. Moreover, while there are many radio/optical instruments spread all over the globe, there are only three Cherenkov Telescope observatories in the northern hemisphere we could utilize (MAGIC, VERITAS, Whipple). Hence, the impact of observing conditions was more important to the coverage at the VHE -ray energies.
We note that Figure 6 shows the MAGIC, VERITAS and Whipple coverage at VHE -ray energies, but only the MAGIC and VERITAS observations were used to produce the spectra shown in Figure 8. The more extensive (120 hr), but less sensitive, Whipple data (shown as grey boxes in Figure 6) were primarily taken to determine the light curve (Pichel et al., 2009) and a re-optimization was required to derive the spectrum which will be reported elsewhere.
In the following paragraphs we briefly discuss the procedures used in the data analysis of the instruments participating in the campaign. The analysis of the Fermi-LAT data was described in §2 and the results obtained will be described in detail in §5.2.
5.1.1 Radio Instruments
Radio data were taken for this campaign from single-dish telescopes, one mm-interferometer, and one Very Long Baseline Interferometry (VLBI) array, at frequencies between GHz and GHz (see Table 1). The single-dish telescopes were the Effelsberg 100 m radio telescope, the 32 m Medicina radio telescope, the 14 m Metsähovi radio telescope, the 32 m Noto radio telescope, the Owens Valley Radio Observatory (OVRO) 40 m telescope, the 26 m University of Michigan Radio Astronomy Observatory (UMRAO) and the 600 meter ring radio telescope RATAN-600. The mm-interferometer is the Sub-millimeter Array (SMA). The NRAO Very Long Baseline Array (VLBA) was used for the VLBI observations. For the single-dish instruments and SMA, Mrk 501 is point-like and unresolved at all observing frequencies. Consequently, the single-dish measurements denote the total flux density of the source integrated over the whole source extension. Details of the observing strategy and data reduction can be found in Fuhrmann et al. (2008, F-GAMMA project); Angelakis et al. (2008, F-GAMMA project), Teräsranta et al. (1998, Metsähovi), Aller et al. (1985, UMRAO), Venturi et al. (2001, Medicina and Noto), Kovalev et al. (1999, RATAN-600) and Richards et al. (, in preparation, OVRO).
In the case of the VLBA, the data were obtained at various frequencies from GHz to GHz through various programs (BP143, BK150 and MOJAVE). The data were reduced following standard procedures for data reduction and calibration (see, for example, Lister et al., 2009, for a description of the MOJAVE program which provided the GHz data). Since the VLBA angular resolution is smaller than the radio source extension, measurements were performed for the most compact core region, as well as for the total radio structure at parsec scales. The VLBA core size was determined with two-dimensional circular or elliptical Gaussian fits to the measured visibilities. The FWHM size of the core was estimeted to be in the range 0.14–0.18 mas at the highest observing frqeuencies, 15–43 GHz. Both the total and the core radio flux densities from the VLBA data are depicted in Figure 8.
5.1.2 Optical and Near-IR Instruments
The coverage at optical frequencies was obtained through various telescopes around the globe, and this decreased the sensitivity to weather/technical difficulties and provided good overall coverage of the source, as depicted in Figure 6. Many of the observations were performed within the GASP-WEBT program (e.g., Villata et al., 2008, 2009); that is the case for the data collected by the telescopes at Abastumani, Lulin, Roque de los Muchachos (KVA), St. Petersburg, Talmassons, and Valle d’Aosta observatories ( band), and also for Campo Imperatore (near-infrared frequencies, bands). In addition, the telescopes GRT, ROVOR and MitSume provided data with various optical filters, while OAGH and WIRO provided data at near-infrared wavelengths. See Table 1 for further details.
All the instruments used the calibration stars reported in Villata et al. (1998), and the Galactic extinction was corrected with the coefficients given in Schlegel et al. (1998). On the other hand, the flux from the host galaxy, which in the band accounts for about two-thirds of the overall measured optical flux (Nilsson et al., 2007), was not subtracted. As can be seen from Figure 8, the host galaxy contribution shows up as an additional (narrow) bump in the SED with the peak located at infrared frequencies and the flux decreasing rapidly with increasing frequency. At frequencies above Hz, the blazar emission again dominates the radiative output of Mrk 501.
5.1.3 Swift-UVOT
The Swift-Ultra-Violet/Optical Telescope (UVOT; Roming et al., 2005) data used in this analysis include all the observations performed during the time interval MJD 54905 and 55044, which amounts to 41 single pointing observations that were requested to provide UV coverage during the Mrk 501 multifrequency campaign. The UVOT telescope cycled through each of six optical and ultraviolet passbands (V, B, U, UVW1, UVM2, UVW2). Photometry was computed using a arcsec source region around Mrk 501 using a custom UVOT pipeline that obtains similar photometric results to the public pipeline (Poole et al., 2008). The custom pipeline also allows for separate, observation-by-observation corrections for astrometric mis-alignments (Acciari et al., 2010c, in preparation). A visual inspection was also performed on each of the observations to ensure proper data quality selection and correction. The flux measurements obtained have been corrected for Galactic extinction mag (Schlegel et al., 1998) in each spectral band (Fitzpatrick, 1999).
5.1.4 Swift-XRT
All the Swift-X-ray Telescope (XRT; Burrows et al., 2005) Windowed Timing observations carried out from MJD 54905 to 55044 were used for the analysis: this amounts to a total of 41 observations performed within this dedicated multi-instrument effort to study Mrk 501. The XRT data set was first processed with the XRTDAS software package (v.2.5.0) developed at the ASI Science Data Center (ASDC) and distributed by HEASARC within the HEASoft package (v.6.7). Event files were calibrated and cleaned with standard filtering criteria with the xrtpipeline task using the latest calibration files available in the Swift CALDB. The individual XRT event files were then merged together using the XSELECT package and the average spectrum was extracted from the summed event file. Events for the spectral analysis were selected within a circle of 20-pixel ( arcsec) radius centered at the source position and enclosing about of the point-spread function (PSF) of the instrument. The background was extracted from a nearby circular region of 40-pixel radius. The source spectrum was binned to ensure a minimum of 20 counts per bin to utilize the minimization fitting technique. The ancillary response files were generated with the xrtmkarf task applying corrections for the PSF losses and CCD defects using the cumulative exposure map. The latest response matrices (v.011) available in the Swift CALDB were used.
The XRT average spectrum in the keV energy band was fitted using the XSPEC package. We adopted a log-parabolic model for the photon flux spectral density (Massaro et al., 2004a, b) of the form , with an absorption hydrogen-equivalent column density fixed to the Galactic value in the direction of the source, namely cm-2 (Kalberla et al., 2005). This model provided a good description of the observed spectrum, with the exception of the keV energy band where spectral fit residuals were present. These residuals are due to known XRT calibration uncertainties (SWIFT-XRT-CALDB-12)131313http://heasarc.gsfc.nasa.gov/docs/heasarc/caldb/swift/docs/xrt/SWIFT-XRT-CALDB-09_v12.pdf and hence we decided to exclude the keV energy band from the analysis. In addition, we had to apply a small energy offset ( eV) to the observed energy spectrum. The origin of this correction is likely to be CCD charge traps generated by radiation and high-energy proton damage (SWIFT-XRT-CALDB-12), which affects mostly the lowest energies (first one or two bins) in the spectrum. The resulting spectral fit gave the following parameters: ph cm-2 s-1 keV-1, , and . The XRT SED data shown in Figure 8 were corrected for the Galactic absorption and then binned into 10 energy intervals.
5.1.5 RXTE-PCA
The Rossi-X-ray Timing Explorer (RXTE; Bradt et al., 1993) satellite performed 29 pointing observations of Mrk 501 during the time interval MJD 54905 and 55044. These observations amount to a total exposure of 52 ks, which was requested through a dedicated Cycle 13 proposal to provide X-ray coverage for our campaign. We did not find a significant signal in the RXTE-HEXTE data and hence we only report on the data from RXTE-PCA, which is the main pointing instrument on board RXTE. The data analysis was performed using FTOOLS v6.5 and following the procedures and filtering criteria recommended by the RXTE Guest Observer Facility141414http://www.universe.nasa.gov/xrays/programs/rxte/pca/doc/bkg/bkg-2007-saa/ after September 2007. In particular, the observations were filtered following the conservative procedures for faint sources151515The average net count rate from Mrk 501 was about 7 ct/s/pcu (in the energy range keV) with flux variations typically much smaller than a factor of two.: Earth elevation angle greater than , pointing offset less than , time since the peak of the last SAA (South Atlantic Anomaly) passage greater than 30 minutes, and electron contamination less than . For further details on the analysis of faint sources with RXTE, see the online Cook Book161616http://heasarc.gsfc.nasa.gov/docs/xte/recipes/cook_book.html. In the data analysis, in order to increase the quality of the signal, only the first xenon layer of PCU2 was used. We used the package pcabackest to model the background and the package saextrct to produce spectra for the source and background files and the script171717The CALDB files are located at http://heasarc.gsfc.nasa.gov/FTP/caldb pcarsp to produce the response matrix.
The PCA average spectrum in the keV energy band was fitted using the XSPEC package with a single power-law function with a constant neutral hydrogen column density fixed at the Galactic value in the direction of the source, namely cm-2 (Kalberla et al., 2005). However, since the PCA bandpass starts at keV, the value used for does not significantly affect our results. The resulting spectral fit provided a good representation of the data for the following parameters: ph cm-2 s-1 keV-1, and . The PCA average spectrum obtained using 23 energy bins is shown in Figure 8.
5.1.6 Swift-BAT
The Swift-Burst Alert Telescope (BAT; Barthelmy et al., 2005) analysis results presented in this paper were derived with all the available data during the time interval MJD 54905 and 55044. The spectrum was extracted following the recipes presented in Ajello et al. (2008, 2009b). This spectrum is constructed by weighted averaging of the source spectra extracted from short exposures (e.g., s) and is representative of the averaged source emission over the time range spanned by the observations. These spectra are accurate to the mCrab level and the reader is referred to Ajello et al. (2009a) for more details. The Swift-BAT spectrum is consistent with a power-law function with normalization parameter ph cm-2 s-1 keV-1 and photon index .
5.1.7 MAGIC
MAGIC is a system of two 17 m-diameter IACTs for very high energy -ray astronomy located on the Canary Island of La Palma, at an altitude of 2200 m above sea level. At the time of the observation, MAGIC-II, the new second telescope of the current array system, was still in its commissioning phase so that Mrk 501 was observed in stand-alone mode by MAGIC-I, which is in scientific operation since 2004 (Albert et al., 2008). The MAGIC telescope monitored the VHE activity of Mrk 501 in the framework of the organized multifrequency campaign. The observations were performed in the so-called “wobble” mode (Daum, 1997). In order to have a low energy threshold, only observations at zenith angles less than were used in this analysis. Bad weather and a shut-down for a scheduled hardware system upgrade during the period MJD 54948–54960 (April 27 – May 13) significantly reduced the actual amount of observing time compared to what had initially been scheduled for this campaign. The data were analyzed following the prescription given in Albert et al. (2008) and Aliu et al. (2009). The data surviving the quality cuts amount to a total of 16.2 hours. The preliminary reconstructed photon fluxes for the individual observations gave an average activity of about the flux of the Crab Nebula, with small (typically much less than a factor of two) flux variations. The derived spectrum was unfolded to correct for the effects of the limited energy resolution of the detector and of possible bias (Albert et al., 2007b). The resulting spectrum was fitted satisfactorily with a single power-law function of the form , giving normalization parameter ph cm-2 s-1 TeV-1 and photon index .
5.1.8 VERITAS
VERITAS is a state-of-the-art TeV -ray observatory consisting of four 12 m-diameter IACTs. VERITAS is located at the basecamp of the F.L. Whipple Observatory in southern Arizona, USA, at an altitude of 1250 m above sea level, and the system has been fully operational since fall 2007 (Acciari et al., 2010a). VERITAS observed Mrk 501 as part of the long-term monitoring campaign between March and June of 2009. The observations were performed in “wobble” mode (Daum, 1997) at relatively low zenith angle (). These data were analyzed following the prescription reported in Acciari et al. (2008). After removal of data runs with poor observing conditions, a total of 9.7 hours of good quality data was obtained between MJD 54907 and MJD 55004. Due to the long-term nature of these observations, several factors had to be taken into account when analyzing the data. The initial portion of the campaign includes data taken under standard 4-telescope operating conditions. Two nights of data were taken with only two operational telescopes due to technical difficulties. For the latter portion of the campaign, data were taken over several nights with three operational telescopes because one of the telescopes was being relocated as part of an upgrade to the array (Perkins & Maier et al., 2009). The effective collection areas for the array in these three configurations were calculated using Monte Carlo simulations of extensive air showers passed through the analysis chain with detector configurations corresponding to the respective data-taking conditions.
An initial analysis of the VHE activity showed an increase in the flux by a factor of about five during MJD 54953–54956. Because of the large difference in the VHE flux, we decided to analyze this 3-day data set (corresponding to a “flaring” state of Mrk 501) separately from the rest of the collected data (“non-flaring”). The “flaring” epoch consists of h of data taken during MJD 54953–54956. The “non-flaring” epoch consists of h of data taken during the remaining portion of the campaign. The spectra from these two data sets were each fitted with a single power-law function of the form . The resulting fit parameter values are ph cm-2 s-1 TeV-1 with for the “flaring” state, and ph cm-2 s-1 TeV-1 with photon index for the “non-flaring” state.
Note. — The energy range shown in column two is the actual energy range covered during the Mrk 501 observations, and not the instrument’s nominal energy range, which might only be achievable for bright sources and excellent observing conditions.
Note. — The Whipple spectra were not included in Figure 8. See text for further comments.
5.2 Fermi-LAT Spectra During the Campaign
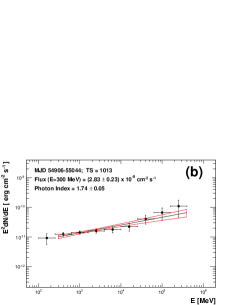
The Mrk 501 spectrum measured by Fermi-LAT, integrated during the time interval of the multifrequency campaign, is shown in the panel (b) of Figure 7. The spectrum can be described by a power-law function with photon index . The flux data points resulting from the analysis in differential energy ranges are within of the power-law fit result; this is an independent indication that a single power-law function is a good representation of the spectrum during the multifrequency campaign. On the other hand, the shape of the spectrum depicted by the differential energy flux data points suggests the possibility of a concave spectrum. As it was discussed in §3 and §4 (see Figures 1 and 5), Mrk 501 showed substantial spectral variability during the time period covered by the multifrequency campaign, with some 30-day time intervals characterized by relatively soft spectra (photon index for the 30-day intervals MJD 54892–54922 and MJD 54922–54952) and others by relatively hard spectra (photon index for the 30-day intervals MJD 54952–54982, MJD 54982–55012 and MJD 55012–55042). The panel (b of Figure 7 presents the average spectrum over those time intervals, and hence it would not be surprising to see two slopes (instead of one) in the spectrum. In order to evaluate this possibility, a broken power-law fit was applied, yielding indices of and below and above a break energy of GeV, respectively. The likelihood ratio of the broken power law and the power law is . Given that the broken power law has two additional degrees of freedom, this indicates that the broken power law is not statistically preferred over the single power law function.
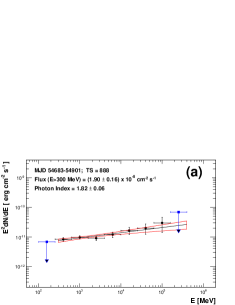
For comparison purposes we also computed the spectra for time intervals before and after the multifrequency campaign (MJD 54683–54901 and MJD 55044–55162)181818Technical problems prevented the scientific operation of the Fermi-LAT instrument during the interval MJD 54901–54905.. These two spectra, shown in the panel (a) and (ac of Figure 7, can both be described satisfactorily by single power-law functions with photon indices and . Note that the two spectra are perfectly compatible with each other, which is consistent with the relatively small flux/spectral variability shown in Figures 1 and 2 for those time periods.

5.3 The Average Broadband SED During the Campaign
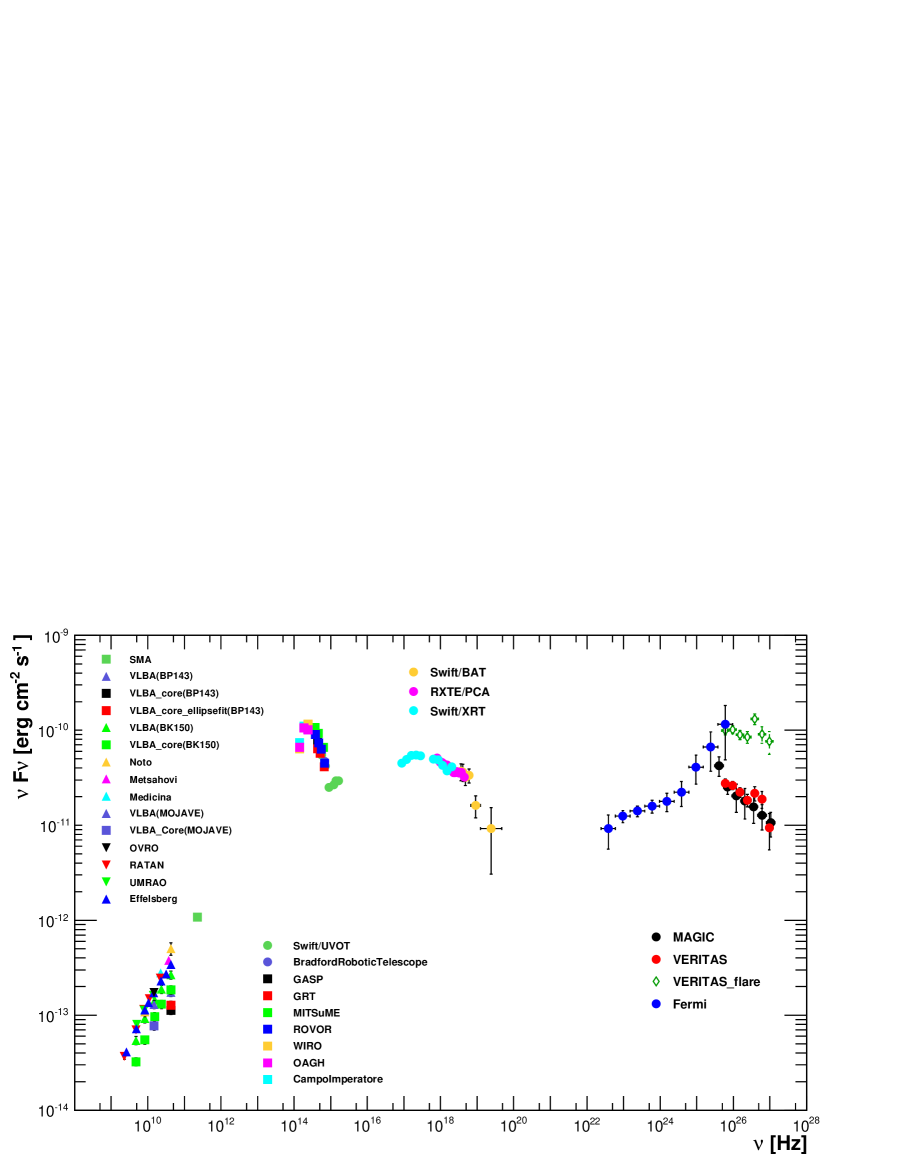
The average broadband SED of Mrk 501 resulting from our 4.5-month-long multifrequency campaign is shown in Figure 8. The TeV data from MAGIC and VERITAS have been corrected for the absorption in the EBL using the particular EBL model by Franceschini et al. (2008). The corrections given by the other low-EBL-level models (Kneiske et al., 2004; Gilmore et al., 2009; Finke et al., 2010) are very similar for the low redshift of Mrk 501 (). The attenuation factor at a photon energy of TeV (the highest energy detected from Mrk 501 during this campaign) is in the range , and smaller at lower energies.
During the campaign, as already noted above, the source did not show large flux variations like those recorded by EGRET in 1996, or those measured by X-ray and TeV instruments in 1997. Nevertheless, significant flux and spectral variations at -ray energies occurred in the time interval MJD 54905–55044. The largest flux variation during the campaign was observed at TeV energies during the time interval MJD 54952.9–54955.9, when VERITAS measured a flux about five times higher than the average one during the campaign. Because of the remarkable difference with respect to the rest of the analyzed exposure, these observations were excluded from the data set used to compute the average VERITAS spectrum for the campaign; the three-day “flaring-state” spectrum (2.4 hours of observation) is presented separately in Figure 8. Such a remarkable flux enhancement was not observed in the other energy ranges and hence Figure 8 shows only the averaged spectra for the other instruments191919The MAGIC telescope did not operate during the time interval MJD 54948–54965 due to a drive system upgrade..
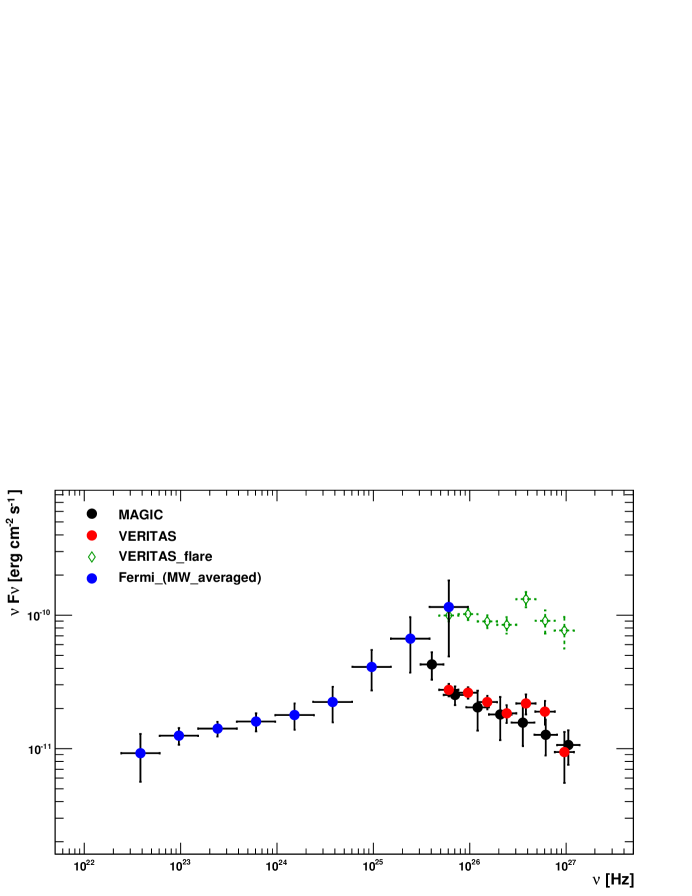
The top panel in Figure 9 shows a zoom of the high-energy bump depicted in Figure 8. The last two energy bins from \Fermi( and GeV) are systematically above (1-2) the measured/extrapolated spectrum from MAGIC and VERITAS. Even though this mismatch is not statistically significant, we believe that the spectral variability observed during the 4.5 month long campaign (see §4 and §5.2) could be the origin of such a difference. Because Fermi-LAT operates in a survey mode, Mrk 501 is constantly monitored at GeV energies202020During every three hours of \Fermioperation, Mrk 501 is in the LAT field of view for about 0.5 hour., while this is not the case for the other instruments which typically sampled the source during 1 hour every 5 days approximately. Moreover, because of bad weather or moonlight conditions, the monitoring at the TeV energies with Cherenkov telescopes was even less regular than that at lower frequencies. Therefore, Fermi-LAT may have measured high activity that was missed by the other instruments. Indeed, the 2.4-hour high-flux spectrum from VERITAS depicted in Figure 8 (which was obtained during the 3-day interval MJD 54952.9–54955.9) demonstrates that, during the multifrequency campaign, there were time periods with substantially (factor of five) higher TeV activity. It is possible that the highest-energy LAT observations (50 GeV) include high TeV flux states which occurred while the IACTs were not observing.
If the flaring activity occurred only at the highest photon energies, then the computed Fermi-LAT flux (0.3 GeV) would not change very much and the effect might only be visible in the measured power-law photon index. This seems to be the case in the presented data set. As was shown in Figure 5, the 30-day intervals MJD 54922–54952 and MJD 54952–54982 have photon fluxes above GeV of ph cm-2 s-1 and ph cm-2s-1, while their photon indices are and , respectively. Therefore, the spectral information (together with the enhanced photon flux) indicates the presence of flaring activity at the highest -ray energies during the second 30-day time period. Besides the factor VHE flux enhancement recorded by VERITAS and Whipple at the beginning of the time interval MJD 54952–54982, MAGIC and Whipple also recorded a factor VHE flux enhancement at the end of this 30-day time interval (see preliminary fluxes reported in Paneque, 2009; Pichel et al., 2009). This flux enhancement was measured for the time interval MJD 54975–54977, but there were no VHE measurements during the period MJD 54970.5–54975.0. Thus, the average Fermi-LAT spectrum could have been affected by elevated VHE activity during the 30-day time interval MJD 54952–54982, which was only partly covered by the IACTs participating in the campaign.
For illustrative purposes, in the bottom panel of Figure 9 we show separately the Fermi-LAT spectra for the 30-day time interval MJD 54952–54982 (high photon flux and hard spectrum), and for the rest of the campaign. It is interesting to note that the Fermi-LAT spectrum without the 30-day time interval MJD 54952–54982 (blue data points in the bottom panel of Figure 9) agrees perfectly with the VHE spectrum measured by IACTs. We also want to point out that the power-law fit to the Fermi-LAT spectrum without the 30-day interval MJD 54952–54982 gave a photon flux above GeV of ph cm-2 s-1 with a photon index of , which is statistically compatible with the results for the power-law fit to the Fermi-LAT data from the entire campaign (see panel (b) in Figure 7). As discussed above, the flaring activity occurred mostly at the highest energies, where the (relatively) low photon count has little impact on the overall power-law fit performed above GeV.
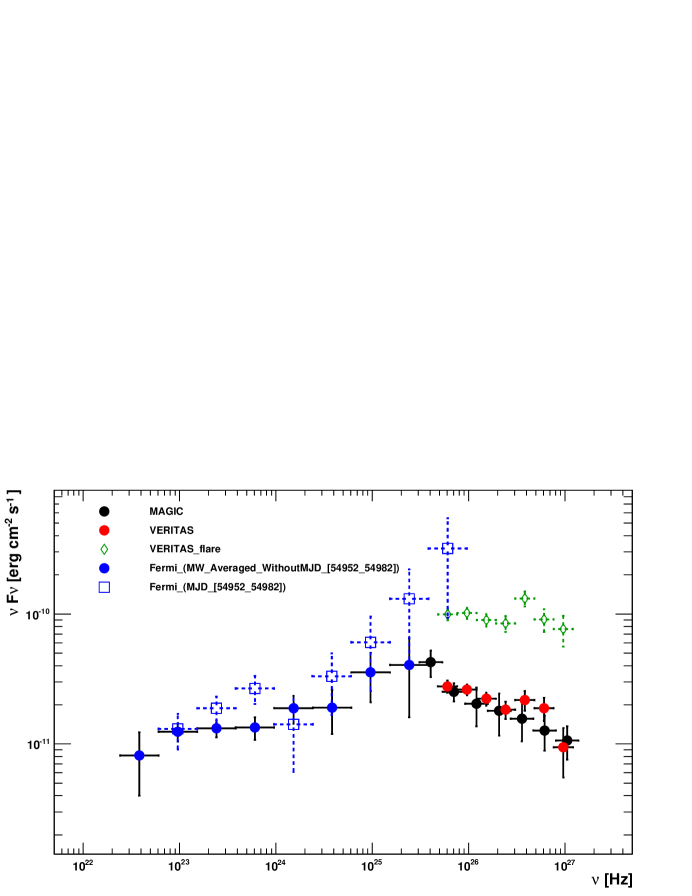
This is the most complete quasi-simultaneous SED ever collected for Mrk 501, or for any other TeV-emitting BL Lac (see also Abdo et al., 2010d, in preparation). At the highest energies, the combination of Fermi and MAGIC/VERITAS data allows us to measure, for the first time, the high-energy bump without any spectral gap. The low-energy spectral component is also very well characterized with Swift-UVOT, Swift-XRT and RXTE-PCA data, covering the peak of the synchrotron continuum. The only (large) region of the SED with no available data corresponds to the photon energy range keV MeV, where the sensitivity of current instruments is not good enough to detect Mrk 501. It is worth stressing that the excellent agreement in the overlapping energies among the various instruments (which had somewhat different time coverage) indicates that the collected data are representative of the truly average SED during the multi-instrument campaign.
6 Modeling the Spectral Energy Distribution of Mrk 501
The simultaneous broadband data set resulting from the multifrequency campaign reported above offers an unprecedented opportunity to model the emission of an archetypal TeV blazar in a more robust way than in the past. It is widely believed that the radio-to--ray emission of the BL Lac class of AGN is produced predominantly via the synchrotron and synchrotron self-Compton (SSC) processes, and hence the homogeneous one-zone approximation of the SSC scenario is the simplest model to consider. Here we therefore adopt the ‘standard’ one-zone SSC model, which has had moderate success in accounting for the spectral and temporal properties of the TeV-emitting BL Lacs analyzed so far (e.g., Finke et al., 2008; Ghisellini et al., 2009a, and references therein). We also note that one-zone SSC analyses have been widely applied before to the particular case of Mrk 501 (e.g., Bednarek & Protheroe, 1999; Katarzyński et al., 2001; Tavecchio et al., 2001; Kino et al., 2002; Albert et al., 2007a). However, it is important to stress that the modeling results from the previous works related almost exclusively to the high-activity state of Mrk 501. In the more recent work by Anderhub et al. (2009) the source was studied also during its low-activity state, yet the simultaneous observations used in the modeling covered only the X-ray and TeV photon energies. In this paper we study Mrk 501 during a relatively low activity state, and the modeling is applied to a more complete broadband SED extending from radio to TeV energies, including the previously unavailable GeV data from Fermi. This constitutes a substantial difference with respect to previous works. The resulting constraints on the physical parameters of the source, together with several limitations of the applied scenario, are discussed further down in the next sections.
We want to note that modeling of the average blazar SED based on a scenario assuming steady-state homogenous emission zone could be an over-simplification of the problem. The blazar emission may be produced in an inhomogeneous region, involving stratification of the emitting plasma both along and accross a relativistic outflow. In such a case, the observed radiative output of a blazar could be due to a complex superposition of different emission zones characterized by very different parameters and emission properties. Some first attempts to approach this problem in a more quantitative way have been already discussed in the literature (e.g. Ghisellini et al., 2005; Katarzyński et al., 2008; Graff et al., 2008; Giannios et al., 2009). The main drawback of the proposed models, however, is the increased number of free parameters (over the simplest homogeneous one-zone scenario), what reduces considerably the predictive power of the modeling. That is particularly problematic if a “limited” (in a time and energy coverage) dataset is considered in the modeling. Only a truly simultaneous multifrequency dataset covering a large fraction of the available electromagnetic spectrum and a wide range of timescales — like the one collected during this and future campaigns which will be further exploited in forthcoming publications — will enable to test such more sophisticated and possibly more realistic blazar emission models in a time-deoendent manner.
6.1 SSC Modeling
Let us assume that the emitting region is a homogeneous and roughly spherically symmetric moving blob, with radius and comoving volume . For this, we evaluate the comoving synchrotron and synchrotron self-Compton emissivities, , assuming isotropic distributions of ultrarelativistic electrons and synchrotron photons in the rest frame of the emitting region. Thus, we use the exact synchrotron and inverse-Compton kernels (the latter one valid in both Thomson and Klein-Nishina regimes), as given in Crusius & Schlickeiser (1986) and Blumenthal & Gould (1970), respectively. The intrinsic monochromatic synchrotron and SSC luminosities are then , while the observed monochromatic flux densities (measured in erg cm-2 s-1) can be found as
| (2) |
where is the jet Doppler factor, is the source redshift, and Mpc is the luminosity distance to Mrk 501. In order to evaluate the comoving emissivities , the electron energy distribution has to be specified. For this, we assume a general power-law form between the minimum and maximum electron energies, and , allowing for multiple spectral breaks in between, as well as for an exponential cut-off above . In fact, the broadband data set for Mrk 501 requires two different electron break energies, and hence we take the electron energy distribution in a form
| (3) |
with the normalization expressed in terms of the equipartition parameter (the ratio of the comoving electron and magnetic field energy densities), namely
| (4) |
The measured SED is hardly compatible with a simpler form of the electron distribution with only one break and an exponential cutoff. However, some smoothly curved spectral shape might perhaps be an alternative representation of the electron spectrum (e.g., Stawarz & Petrosian, 2008; Tramacere et al., 2009).
The model adopted is thus characterized by four main free parameters (, , , and ), plus seven additional ones related to the electron energy distribution (, , , , , , and ). These seven additional parameters are determined by the spectral shape of the non-thermal emission continuum probed by the observations, predominantly by the spectral shape of the synchrotron bump (rather than the inverse-Compton bump), and depend only slightly on the particular choice of the magnetic field and the Doppler factor within the allowed range212121For example, for a given critical (break) synchrotron frequency in the observed SED, the corresponding electron break Lorentz factor scales as .. There is a substantial degeneracy regarding the four main free parameters: the average emission spectrum of Mrk 501 may be fitted by different combinations of , , , and with little variation in the shape of the electron energy distribution. Note that, for example, , but at the same time . We can attempt to reduce this degeneracy by assuming that the observed main variability timescale is related to the size of the emission region and its Doppler factor according to the formula
| (5) |
The multifrequency data collected during the 4.5-month campaign (see §5) allows us to study the variability of Mrk 501 on timescales from months to a few days. We found that, during this time period, the multifrequency activity varied typically on a timescale of days, with the exception of a few particular epochs when the source became very active in VHE -rays, and flux variations with timescales of a day or shorter were found at TeV energies. Nevertheless, it is important to stress that several authors concluded in the past that the dominant emission site of Mrk 501 is characterized by variability timescales longer than one day (see Kataoka et al., 2001, for a comprehensive study of the Mrk 501 variability in X-rays), and that the power in the intraday flickering of this source is small, in agreement with the results of our campaign. Nevertheless, one should keep in mind that this object is known for showing sporadic but extreme changes in its activity that can give flux variations on timescales as short as a few minutes (Albert et al., 2007a). In this work we aim to model the average/typical behaviour of Mrk 501 (corresponding to the 4.5-month campaign) rather than specific/short periods with outstanding activity, and hence we constrained the minimum (typical) variability timescale in the model to the range days.
Even with fixed as discussed above, the reconstructed SED of Mrk 501 may be fitted by different combinations of , , , and . Such a degeneracy between the main model parameters is an inevitable feature of the SSC modeling of blazars (e.g., Kataoka et al., 1999), and it is therefore necessary to impose additional constraints on the physical parameters of the dominant emission zone. Here we argue that such constraints follow from the requirement for the electron energy distribution to be in agreement with the one resulting from the simplest prescription of the energy evolution of the radiating electrons within the emission region, as discussed below.
The idea of separating the sites for the particle acceleration and emission processes is commonly invoked in modeling different astrophysical sources of high-energy radiation, and blazar jets in particular. Such a procedure is not always justified, because interactions of ultrarelativistic particles with the magnetic field (leading to particle diffusion and convection in momentum space) are generally accompanied by particle radiative losses (and vice versa). On the other hand, if the characteristic timescale for energy gains is much shorter than the timescales for radiative cooling () or escape () from the system, the particle acceleration processes may be indeed approximated as being ‘instantaneous’, and may be modeled by a single injection term in the simplified version of the kinetic equation
| (6) |
describing a very particular scenario for the energy evolution of the radiating ultrarelativistic electrons.
It is widely believed that the above equation is a good approximation for the energy evolution of particles undergoing diffusive (‘first-order Fermi’) shock acceleration, and cooling radiatively in the downstream region of the shock. In such a case, the term specifies the energy spectrum and the injection rate of the electrons freshly accelerated at the shock front and not affected by radiative losses, while the escape term corresponds to the energy-independent dynamical timescale for the advection of the radiating particles from the downstream region of a given size , namely . The steady-state electron energy distribution is then very roughly below the critical energy for which , and above this energy. Note that in the case of a power-law injection and a homogeneous emission region with dominant radiative losses of the synchrotron type, , the injected electron spectrum is expected to steepen by above the critical ‘cooling break’ energy. This provides us with the additional constraint on the free model parameters for Mrk 501: namely, we require that the position of the second break in the electron energy distribution needed to fit the reconstructed SED, , should correspond to the location of the cooling break for a given chosen set of the model free parameters.
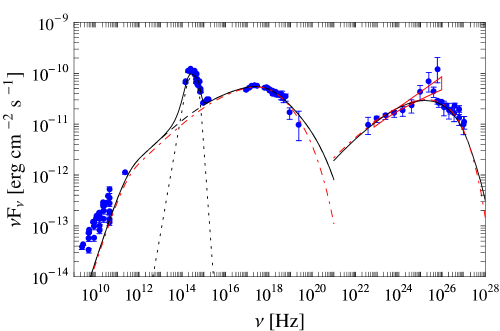
Figure 10 (black curves) shows the resulting SSC model fit (summarized in Table 2) to the averaged broadband emission spectrum of Mrk 501, which was obtained for the following parameters: G, cm, , , , , , , , , and . The overall good agreement of the model with the data is further discussed in §6.2. Here, we note that, for these model parameters, synchrotron self-absorption effects are important only below GHz, where we do not have observations222222The turnover frequency related to the synchrotron self-absorption may be evaluated using the formulae given in Ghisellini & Svensson (1991) and the parameter values from our SSC model fit as MHz, which in the observer frame reads GHz.. We also emphasize that with all the aforementioned constraints and for a given spectral shape of the synchrotron continuum (including all the data points aimed to be fitted by the model, as discussed below), and thus for a fixed spectral shape of the electron energy distribution (modulo critical electron Lorentz factors scaling as ), the allowed range for the free parameters of the model is relatively narrow. Namely, for the variability timescale between and days, the main model parameters may change within the ranges cm, , and G. The parameter depends predominantly on the minimum Lorentz factor of the radiating electrons. Hence, it is determined uniquely as with the sub-mm flux included in the fitted dataset. Only with a different prescription for the spectral shape of the electron energy distribution could the main free parameters of the model be significantly different from those given above.
Despite the absence of any fast variability during this multifrequency campaign (apart from the already discussed isolated 3-day-long flare), Mrk 501 is known for the extremely rapid flux changes at the highest observed photon energies (e.g. Albert et al., 2007a). Hence, it is interesting to check whether any shorter than few-day-long variability timescales can be accommodated in the framework of the simplest SSC model applied here for the collected dataset. In order to do that, we decreased the minimum variability time scale by one order of magnitude (from 4 days to 0.4 days), and tried to model the data. A satisfactory fit could be obtained with those modified parameters, but only when we relaxed the requirement for the electron energy distribution to be in agreement with the one following from the steady-state solution to Equation 6, and in particular the resulting constraint for the second break in the electron spectrum to be equal the cooling break. This “alternative” model fit is shown in Figure 10 (red curves) together with the “best” model fit discussed above. The resulting model parameters for the “alternative” fit are G, cm, , , , , , , , , and . This particular parameter set — which should be considered as an illustrative one, only — would be therefore consistent with a minimum variability timescale of days, but at the price of much larger departures from the energy equipartition (). The other source parameters, on the other hand, would change only slightly (see Table 2). Because of the mismatch (by factor 3) between the location of the cooling break and the second break in the electron distribution, we consider this “alternative” fit less consistent with the hypothesis of steady-state homogeneous one-zone SSC scenario, which is the framework we chose to model the broad-band SED of Mrk 501 emerging from the campaign.
6.2 Notes on the Spectral Data Points
The low-frequency radio observations performed with single-dish instruments have a relatively large contamination from non-blazar emission due to the underlying extended jet component, and hence they only provide upper limits for the radio flux density of the blazar emission zone. On the other hand, the flux measurements by the interferometric instruments (such as VLBA), especially the ones corresponding to the core, provide us with the radio flux density from a region that is not much larger than the blazar emission region.
The radio flux densities from interferometric observations (from the VLBA core) are expected to be close upper limits to the radio continuum of the blazar emission component. The estimated size of the partially-resolved VLBA core of Mrk 501 at 15 GHz and 43 GHz is 0.14–0.18 mas 2.9–3.7 cm (with the appropriate conversion scale pc/mas). The VLBA size estimation is the FWHM of a Gaussian representing the brightness distribution of the blob, which could be approximated as 0.9 times the radius of a corresponding spherical blob (Marscher, 1983). That implies that the size of the VLBA core is only a factor 2–3 larger than the emission region in our SSC model fit ( cm). Therefore, it is reasonable to assume that the radio flux density from the VLBA core is indeed dominated by the radio flux density of the blazar emission. Forthcoming multi-band correlation studies (in particular VLBA and SMA radio with the -rays from Fermi-LAT) will shed light on this particular subject. Interestingly, the magnetic field claimed for the partially-resolved radio core of Mrk 501 (which has a size of mas) and its sub-mas jet, namely mG (Giroletti et al., 2004, 2008), is in very good agreement with the value emerging from our model fits (15 mG), assuring self-consistency of the approach adopted.
In addition to this, in the modeling we also aimed at matching the sub-millimeter flux of Mrk 501, given at the observed frequency of GHz, assuming that it represents the low-frequency tail of the optically-thin synchrotron blazar component. One should emphasize in this context that it is not clear if the blazar emission zone is in general located deep within the millimeter photosphere, or not. However, the broadband variability of luminous blazars of the FSRQ type indicates that there is a significant overlap of the blazar zone with a region where the jet becomes optically thin at millimeter wavelengths (as discussed by Sikora et al., 2008, for the particular case of the blazar 3C 454.3). We have assumed that the same holds for BL Lac objects.
The IR/optical flux measurements in the range Hz represent the starlight of the host galaxy and hence they should be excluded when fitting the non-thermal emission of Mrk 501. We modelled these data points with the template spectrum of an elliptical galaxy instead (including only the dominant stellar component due to the evolved red giants, as discussed in Silva et al., 1998), obtaining a very good match (see the dotted line in Figure 10) for the bolometric starlight luminosity erg s-1. Such a luminosity is in fact expected for the elliptical host of a BL Lac object. The model spectrum of the galaxy falls off very rapidly above Hz, while the three UV data points (above Hz) indicate a prominent, flat power-law UV excess over the starlight emission. Therefore, it is reasonable to assume that the observed UV fluxes correspond to the synchrotron (blazar-type) emission of Mrk 501 and, consequently, we used them in our model fit. However, many elliptical galaxies do reveal in their spectra the so-called ‘UV upturn’, or ‘UV excess’, whose origin is not well known, but which is presumably related to the starlight continuum (most likely due to young stars from the residual star-forming activity within the central region of a galaxy) rather than to non-thermal (jet-related) emission processes (see, e.g., Code & Welch, 1979; Atlee et al., 2009). Hence, it is possible that the UV data points provided here include some additional contamination from the stellar emission, and as such might be considered as upper limits for the synchrotron radiation of the Mrk 501 jet.
The observed X-ray spectrum of Mrk 501 agrees very well with the SSC model fit, except for a small but statistically significant discrepancy between the model curve and the first two data points provided by Swift-XRT, which correspond to the energy range keV. As pointed out in §5.1, the Swift-XRT data had to be corrected for a residual energy offset which affects the lowest energies. The correction for this effect could introduce some systematic differences with respect to the actual fluxes detected at those energies. These low-energy X-ray data points might be also influenced by intrinsic absorption of the X-ray photons within the gaseous environment of Mrk 501 nucleus, as suggested by the earlier studies with the ASCA satellite (see Kataoka et al., 1999). As a result, the small discrepancy between the data and the model curve within the range keV can be ignored in the modelling.
The agreement between the applied SSC model and the -ray data is also very good. In particular, the model returns the -ray photon index in the energy range 0.3-30 GeV, which can be compared with the one resulting from the power-law fit to the Fermi-LAT data above 0.3 GeV, namely . However, the last two energy bins from Fermi ( and GeV) are systematically above () the model curves, as well as above the averaged spectrum reported by MAGIC and VERITAS. A possible reason for mismatch between the average Fermi-LAT spectrum and the one from MAGIC/VERITAS was discussed in §5.3.
7 Discussion
In this section we discuss some of the implications of the model results presented above. After a brief analysis of the global parameters of the source resulting from the SSC fits (§7.1), the discussion focuses on two topics. Firstly (§7.2), we show that the characteristics of the electron energy distribution emerging from our modeling can be used to constrain the physical processes responsible for the particle acceleration in Mrk 501, processes which may also be at work in other BL Lac type objects. Secondly (§7.3), we examine the broadband variability of Mrk 501 in the framework of the model.
7.1 Main Characteristics of the Blazar Emission Zone in Mrk 501
The values for the emission region size cm and the jet Doppler factor emerging from our SSC model fit give a minimum (typical) variability timescale of days, which is consistent with the variability observed during the campaign and with previous studies of the X-ray activity of Mrk 501 (Kataoka et al., 2001). At this point, it is necessary to determine whether an emission region characterized by these values of and is optically thin to internal two-photon pair creation for the highest TeV energies observed during the campaign. We now affirm pair transparency due to insufficient density of soft target photons.
Since Mrk 501 is a cosmologically local object, pair conversion in the EBL is not expected to prevent its multi-TeV photons from reaching the Earth, although the impact of this process is not negligible, as mentioned in §5. Therefore, dealing with a nearby source allows us to focus mostly on the intrinsic absorption processes, rather than on the cosmological, EBL-related, attenuation of the -ray emission. Moreover, because of the absence (or weakness) of accretion-disk-related circumnuclear photon fields in BL Lac objects like Mrk 501, we only need to consider photon-photon pair production involving photon fields internal to the jet emission site. The analysis is therefore simpler than in the case of FSRQs, where the attenuation of high-energy -ray fluxes is dominated by interactions with photon fields external to the jet — such as those provided by the broad line regions or tori — for which the exact spatial distribution is still under debate.
Pair-creation optical depths can be estimated as follows. Using the -function approximation for the photon-photon annihilation cross-section (Zdziarski & Lightman, 1985), , the corresponding optical depth for a -ray photon with observed energy interacting with a jet-originating soft photon with observed energy
| (7) |
may be found as
| (8) |
where is the differential comoving number density of soft photons. Noting that , where is the intrinsic monochromatic luminosity at photon energy , we obtain
| (9) |
where is the observed monochromatic flux energy density as measured at the observed photon energy . Thus, for TeV -rays and the model parameters discussed (implying the observed eV flux of Mrk 501 roughly erg s-1 cm-2), one has . Therefore, the values of and from our SSC model fit do not need to be adjusted to take into account the influence of spectral modifications due to pair attenuation. Note that such opacity effects, studied extensively in the context of -ray bursts, generally yield a broken power law for the spectral form, with the position and magnitude of the break fixed by the pair-production kinematics (e.g., Baring, 2006, and references therein). The broad-band continuum of Mrk 501, and in particular its relatively flat spectrum VHE -ray segment, is inconsistent with such expected break. This deduction is in agreement with the above derived transparency of the emitting region for high energy -ray photons.
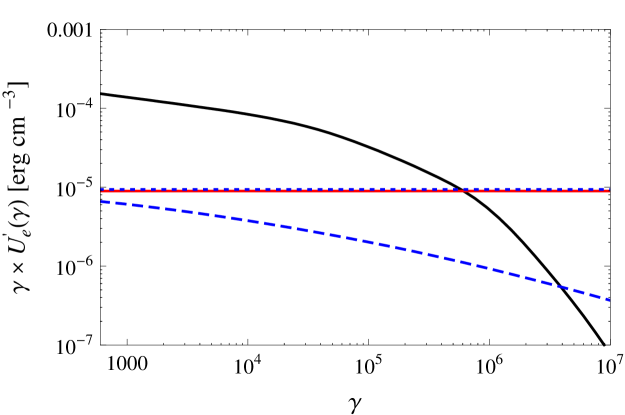
Next we evaluated the ‘monoenergetic’ comoving energy density of ultrarelativistic electrons for a given electron Lorentz factor,
| (10) |
and this is shown in Figure 11 (solid black line). The total electron energy density is then erg cm-3. As shown, most of the energy is stored in the lowest energy particles (). For comparison, the comoving energy density of the magnetic field and that of the synchrotron photons are plotted in the figure as well (horizontal solid red line and dotted blue line, respectively). These two quantities are approximately equal, namely erg cm-3 and
| (11) |
In Figure 11 we also plot the comoving energy density of synchrotron photons which are inverse-Compton upscattered in the Thomson regime for a given electron Lorentz factor ,
| (12) |
(dashed blue line), where . Because of the well-known suppression of the inverse-Compton scattering rate in the Klein-Nishina regime, the scattering in the Thomson regime dominates the inverse-Compton energy losses232323The inverse-Compton cross-section goes as for , and roughly as for (e.g., Coppi & Blandford, 1990).. Hence, one may conclude that even though the total energy density of the synchrotron photons in the jet rest frame is comparable to the comoving energy density of the magnetic field (), the dominant radiative cooling for all the electrons is due to synchrotron emission, since for any .
The timescale for synchrotron cooling may be evaluated as
| (13) |
Hence, equals the dynamical timescale of the emitting region, , for electron Lorentz factor , i.e., close to the second electron break energy . Also the difference between the spectral indices below and above the break energy determined by our modeling, namely , is very close to the ‘classical’ synchrotron cooling break expected for a uniform emission region, as discussed in §6.1. This agreement, which justifies at some level the assumed homogeneity of the emission zone, was in fact the additional constraint imposed on the model to break the degeneracy between the main free parameters. Note that in such a case the first break in the electron energy distribution around electron energy is related to the nature of the underlying particle acceleration process. We come back to this issue in §7.2,
Another interesting result from our model fit comes from the evaluation of the mean energy of the electrons responsible for the observed non-thermal emission of Mrk 501. In particular, the mean electron Lorentz factor is
| (14) |
This value, which is determined predominantly by the minimum electron energy and by the position of the first break in the electron energy distribution, is comparable to the proton-to-electron mass ratio . In other words, the mean energy of ultrarelativistic electrons within the blazar emission zone of Mrk 501 is comparable to the energy of non-relativistic/mildly-relativistic (cold) protons. This topic will be discussed further in §7.2 as well.
The analysis presented allows us also to access the global energetics of the Mrk 501 jet. In particular, with the given energy densities and , we evaluate the total kinetic powers of the jet stored in ultrarelativistic electrons and magnetic field as
| (15) |
and
| (16) |
respectively. In the above expressions, we have assumed that the emission region analyzed occupies the whole cross-sectional area of the outflow, and that the jet propagates at sufficiently small viewing angle that the bulk Lorentz factor of the jet equals the jet Doppler factor emerging from our modeling, . These assumptions are justified in the framework of the one-zone homogeneous SSC scenario. Moreover, assuming one electron-proton pair per electron-positron pair within the emission region (see Celotti & Ghisellini, 2008), or equivalently where the total comoving number density of the jet leptons is
| (17) |
we obtain the comoving energy density of the jet protons , and hence the proton kinetic flux erg s-1. This is comparable to the kinetic power carried out by the leptons for mean proton Lorentz factor (see eq. 15). It means that, within the dominant emission zone of Mrk 501 (at least during non-flaring activity), ultrarelativistic electrons and mildly-relativistic protons, if comparable in number, are in approximate energy equipartition, and their energy dominates that of the jet magnetic field by two orders of magnitude. It is important to compare this result with the case of powerful blazars of the FSRQ type, for which the relatively low mean energy of the radiating electrons, , assures dynamical domination of cold protons even for a smaller proton content (see the discussion in Sikora et al., 2009, and references therein).
Assuming for simplicity, we find that the implied total jet power constitutes only a small fraction of the Eddington luminosity for the Mrk 501 black hole mass (Barth et al., 2002). In particular, our model implies in Mrk 501. In this context, detailed investigation of the emission-line radiative output from the Mrk 501 nucleus by Barth et al. (2002) allowed for an estimate of the bolometric, accretion-related luminosity as erg s-1, or . Such a relatively low luminosity is not surprising for BL Lacs, which are believed to accrete at low, sub-Eddington rates (e.g., Ghisellini et al., 2009b). For low-accretion-rate AGN (i.e., those for which ) the expected radiative efficiency of the accretion disk is (Narayan & Yi, 1994; Blandford & Begelman, 1999). Therefore, the jet power estimated here for Mrk 501 is comfortably smaller than the available power of the accreting matter .
Finally, we note that the total emitted radiative power is
| (18) |
where is given in Equation 11 and the comoving energy density of -ray photons, , was evaluated in an analogous way as . This implies that the jet/blazar radiative efficiency was at the level of a few percent () during the period covered by the multifrequency campaign. Such a relatively low radiative efficiency is a common characteristic of blazar jets in general, typically claimed to be at the level of (see Celotti & Ghisellini, 2008; Sikora et al., 2009). On the other hand, the isotropic synchrotron and SSC luminosities of Mrk 501 corresponding to the observed average flux levels are erg s-1 and erg s-1, respectively.
7.2 Electron Energy Distribution
The results of the SSC modeling presented in the previous sections indicate that the energy spectrum of freshly accelerated electrons within the blazar emission zone of Mrk 501 is of the form between electron energy GeV and GeV, steepening to above GeV, such that the mean electron energy is GeV. At this point, a natural question arises: is this electron distribution consistent with the particle spectrum expected for a diffusive shock acceleration process? Note in this context that the formation of a strong shock in the innermost parts of Mrk 501 might be expected around the location of the large bend (change in the position angle by ) observed in the outflow within the first few parsecs (projected) from the core (Edwards & Piner, 2002; Piner et al., 2009). This distance scale could possibly be reconciled with the expected distance of the blazar emission zone from the center for the model parameters discussed, pc, for jet opening angle .
In order to address this question, let us first discuss the minimum electron energy implied by the modeling, GeV. In principle, electrons with lower energies may be present within the emission zone, although their energy distribution has to be very flat (possibly even inverted), in order not to overproduce the synchrotron radio photons and to account for the measured Fermi-LAT -ray continuum. Therefore, the constrained minimum electron energy marks the injection threshold for the main acceleration mechanism, meaning that only electrons with energies larger than are picked up by this process to form the higher-energy (broken) power-law tail. Interestingly, the energy dissipation mechanisms operating at the shock fronts do introduce a particular characteristic (injection) energy scale, below which the particles are not freely able to cross the shock front. This energy scale depends on the shock microphysics, in particular on the thickness of the shock front. The shock thickness, in turn, is determined by the operating inertial length, or the diffusive mean free path of the radiating particles, or both. Such a scale depends critically on the constituents of the shocked plasma. For pure pair plasmas, only the electron thermal scale enters, and this sets . In contrast, if there are approximately equal numbers of electrons and protons, the shock thickness can be relatively large. Diffusive shock acceleration can then operate on electrons only above a relatively high energy, establishing . Here, represents some efficiency of the equilibration in the shock layer between shocked thermal protons and their electron counterparts, perhaps resulting from electrostatic potentials induced by charge separation of species of different masses (Baring & Summerlin, 2007). Our multifrequency model fits suggest that , providing an important blazar shock diagnostic.
At even lower electron energies, other energization processes must play a dominant role (e.g., Hoshino et al., 1992), resulting in formation of very flat electron spectra (see the related discussion in Sikora et al., 2009). Which of these energy dissipation mechanisms are the most relevant, as well as how flat the particle spectra could be, are subjects of ongoing debates. Different models and numerical simulations presented in the literature indicate a wide possible range for the lowest-energy particle spectral indices (below ), from down to , depending on the particular shock conditions and parameters (Amato & Arons, 2006; Sironi & Spitkovsky, 2009).
All in all, we argue that the relatively high minimum energy of the radiating electrons implied by the SSC modeling of the Mrk 501 broadband spectrum and the overall character of the electron energy evolution in this source are consistent with a proton-mediated shock scenario. In addition, the fact that the mean energy of the ultrarelativistic electrons is of the order of the proton rest energy, , can be reconciled with such a model. Moreover, the constrained power-law slope of the electrons with energies , namely , seems to suggest a dominant role for diffusive shock acceleration above the injection energy , as this value of the spectral index is often claimed in the literature for particles undergoing first-order Fermi acceleration at relativistic shock (Bednarz & Ostrowski, 1998; Kirk et al., 2000; Achterberg et al., 2001). The caveat here is that this result for the ‘universal’ particle spectral index holds only for particular conditions (namely, for ultrarelativistic shock velocities with highly turbulent conditions downstream of the shock: see the discussion in Ostrowski & Bednarz, 2002), whereas in general a variety of particle spectra may result from the relativistic first-order Fermi mechanism, depending on the local magnetic field and turbulence parameters at the shock front, and the speed of the upstream flow (Kirk & Heavens, 1989; Niemiec & Ostrowski, 2004; Lemoine et al., 2006; Sironi & Spitkovsky, 2009; Baring, 2010). Nevertheless, the evidence for ultrarelativistic electrons with spectral index in the jet of Mrk 501 may be considered as an indication that the plasma conditions within the blazar emission zone allow for efficient diffusive shock acceleration (at least in this source), as described by the simplest asymptotic test-particle models, though only in a relatively narrow electron energy range.
If the relativistic shock acceleration plays a dominant role in the blazar Mrk 501 (as argued above), the observations and the model results impose important constraints on this mechanism, many aspects of which are still not well understood. Firstly, this process must be very efficient in the sense that all the electrons pre-accelerated/preheated to the energy GeV are picked up by the acceleration process so that a single electron component is formed above the injection threshold and there is no Maxwellian-like population of particles around outnumbering the higher energy ones from the power-law tail242424Note that due to low accretion rates and thus low luminosities of the accretion disks in BL Lacs, the number of non-relativistic/mildly-relativistic electrons (Lorentz factors ) cannot be constrained by analyzing ‘bulk-Compton’ spectral features in the observed SED of Mrk 501, in contrast to the situation in FSRQs (see Sikora & Madejski, 2000).. The second constraint is due to the presence of the spectral break around electron energies GeV. As discussed in the previous section, this break cannot be simply a result of cooling or internal pair-attenuation effects, and hence must be accounted for by the acceleration mechanism. The discussion regarding the origin of this break — which may reflect variations in the global field orientation or turbulence levels sampled by particles of different energy — is beyond the scope of this paper. However, the presence of high-energy breaks in the electron energy distribution (intrinsic to the particle spectrum rather than forming due to cooling or absorption effects) seems to be a common property of relativistic jet sources observed by Fermi-LAT, such as the FSRQ objects 3C 454.3 and AO 0235+164 (Abdo et al., 2009b, 2010a).
7.3 Variability
In §3–§4, we reported on the -ray flux and spectral variability of Mrk 501 as measured by the Fermi-LAT instrument during the first 16 months of operation. In this section, we discuss whether the observed spectral evolution can be accounted for by our simple one-zone SSC model.
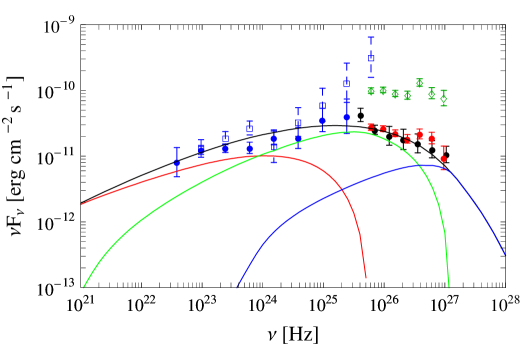
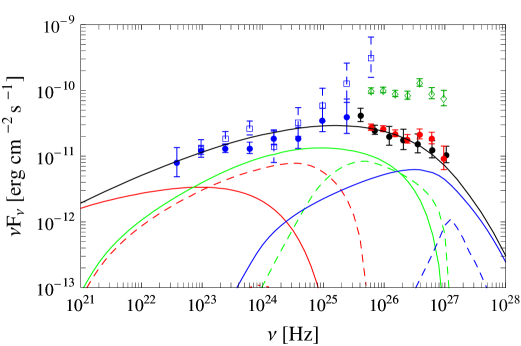
Figure 12 (top panel) presents in more detail the GeV–TeV -ray spectrum of Mrk 501, together with the decomposition of the SSC model continuum. Here the contributions of different segments of the electron energy distribution are indicated by different colors. As shown, the low-energy electrons, , which emit synchrotron photons up to Hz, dominate the production of -rays up to a few GeV (red line). The contribution of higher-energy electrons with Lorentz factors is pronounced within the observed synchrotron range Hz, and at -ray energies from a few GeV up to TeV (green line). Finally, the highest energy tail of the electron energy distribution, , responsible for the observed hard-X-ray synchrotron continuum ( keV) in the fast cooling regime, generates the bulk of -rays with observed energies TeV (blue line). Interestingly, even though any sharp breaks in the underlying electron energy distribution are ‘smeared out’ into a smoothly curved spectral continuum due to the nature of the synchrotron self-Compton emission, the average data set does support the presence of distinct low-energy and high-energy segments in the electron spectrum.
It therefore seems reasonable to argue that the spectral variability of Mrk 501 observed by Fermi-LAT may be explained by postulating that the low-energy segment of the electron energy distribution () is characterized by only small flux variations, while the high-energy electron tail () varies more substantially. In such a scenario, some correlation might be expected between the fluxes in the UV-to-soft-X-ray photon energies from the synchrotron bump and the GeV–TeV fluxes from the inverse-Compton bump. This expectation is not inconsistent with the fact that we do not see any obvious relation between the ASM/BAT fluxes and the LAT ( GeV) fluxes (see Figure 2), because the electrons producing X-ray synchrotron photons above keV contribute to the SSC emission mostly at the highest photon energies in the TeV range (see Figure 12). This issue will be studied in detail (on timescales of 1 month down to 5 days) in a forthcoming publication using the data from this multifrequency campaign.
The X-ray/TeV connection has been established in the past for many BL Lacs (and for Mrk 501 in particular). However, the exact character of the correlation between the X-ray and TeV fluxes is known to vary from object to object, and from epoch to epoch in a given source, as widely discussed in, e.g., Krawczynski et al. (2004); Błażejowski et al. (2005); Gliozzi et al. (2006); Fossati et al. (2008). Note that the data analyzed in those papers were obtained mostly during periods of high activity. Consequently, the conclusions presented were somewhat biased towards flaring activity, and hence they might not apply to the typical (average) behaviour of the source, which is the main focus of this paper. Moreover, the data set from our campaign includes UV fluxes, soft-X-ray fluxes (down to keV; Swift), and -ray fluxes spanning a very wide photon energy range ( GeV TeV; Fermi-LAT combined with MAGIC and VERITAS). This unique data set allows us to evaluate the multifrequency variability and correlations for Mrk 501 over an unprecedented range of photon energies.
Considering only the data set presented in this paper, we note that by steepening the high-energy electron continuum above the intrinsic break energy (and only slightly adjusting the other model parameters), one can effectively remove photons above GeV in the SSC component, leaving a relatively steep spectrum below GeV, similar to the one observed by Fermi-LAT during the time interval MJD 54862–54892 (see §4). Such a change should be accompanied by a decrease in the UV-to-soft-X-ray synchrotron fluxes by a factor of a few, but the data available during that time interval are not sufficient to detect this effect252525The 4.5-month multifrequency campaign started 13 days after the end of the 30-day time interval MJD 54862–54892. Therefore, for this epoch, the only additional multifrequency data are from RXTE-ASM and Swift-BAT, which have only moderate ability to detect Mrk 501 on short timescales.. This statement is further justified by the bottom panel in Figure 12, where the contributions of the different segments of electrons Comptonizing the different segments of the synchrotron bump to the average -ray emission of Mrk 501 are shown. Note that the lowest-energy electron population () inverse-Compton upscattering only synchrotron photons emitted by the same population ( Hz; solid red line) may account for the bulk of the observed steep-spectrum -ray emission.
Another important conclusion from this figure is that Comptonization of the highest-energy synchrotron photons ( Hz) by electrons with arbitrary energies produces only a negligible contribution to the average -ray flux of Mrk 501 due to Klein-Nishina suppression. Thus, the model presented here explains in a natural way the fact that the X-ray and TeV fluxes of TeV-emitting BL Lacs are rarely correlated according to the simple scaling which would be expected from the class of SSC models in which the highest-energy electrons upscatter (in the Thomson regime) their own synchrotron photons to the TeV band (see, e.g., Gliozzi et al., 2006; Fossati et al., 2008). In addition, it opens a possibility for accommodating short-timescale variability ( d) at the highest synchrotron and inverse-Compton frequencies (hard X-rays and TeV photon energies, respectively). The reason for this is that, in the model considered here, these high-energy tails of the two spectral components are produced by the highest-energy electrons which are deep in the strong cooling regime (i.e., for which ), and thus the corresponding flux changes may occur on timescales shorter than (see in this context, e.g., Chiaberge & Ghisellini, 1999; Kataoka et al., 2000).
A more in-depth analysis of the multifrequency data set (including correlation studies of the variability in different frequency ranges) will be presented in a forthcoming paper. The epoch of enhanced -ray activity of Mrk 501 (MJD 54952–54982; see §4) may be more difficult to explain in the framework of the one-zone SSC model, because a relatively flat Fermi-LAT spectrum above GeV, together with an increased TeV flux as measured by the VERITAS and Whipple 10 m telescopes around this time, may not be easy to reproduce with a set of model parameters similar to that discussed in previous sections. This is mostly due to Klein-Nishina effects, which tend to steepen the high-energy tail of the SSC component, thus precluding the formation of a flat power law extending beyond the observed TeV energies. Hence, detailed modeling and data analysis will be needed to determine whether the enhanced VHE -ray activity period can be accommodated within a one-zone SSC model, or whether it will require a multi-zone approach.
| Parameter | Main SSC fit considered | Exemplary SSC fit |
|---|---|---|
| Magnetic field | G | G |
| Emission region size | cm | cm |
| Jet Doppler and bulk Lorentz factors | ||
| Equipartition parameter | ||
| Minimum electron energy | ||
| Intrinsic electron break energy | ||
| Cooling electron break energy | ||
| Maximum electron energy | ||
| Low-energy electron index | ||
| High-energy electron index | ||
| Electron index above the cooling break | ||
| Mean electron energy | ||
| Main variability timescale | day | day |
| Comoving electron energy density | erg cm-3 | erg cm-3 |
| Comoving magnetic field energy density | erg cm-3 | erg cm-3 |
| Comoving energy density of synchrotron photons | erg cm-3 | erg cm-3 |
| Comoving electron number density | cm-3 | cm-3 |
| Luminosity of the host galaxy | erg s-1 | erg s-1 |
| Jet power carried by electrons | erg s-1 | erg s-1 |
| Jet power carried by magnetic field | erg s-1 | erg s-1 |
| Jet power carried by protonsa | erg s-1 | erg s-1 |
| Total jet kinetic power | erg s-1 | erg s-1 |
| Total emitted power | erg s-1 | erg s-1 |
| Isotropic synchrotron luminosity | erg s-1 | erg s-1 |
| Isotropic SSC luminosity | erg s-1 | erg s-1 |
Note. — a Assuming one electron-proton pair per electron-positron pair, and mean proton Lorentz factor .
8 Conclusions
We have presented a study of the -ray activity of Mrk 501 as measured by the LAT instrument on board the Fermi satellite during its first 16 months of operation, from 2008 August 5 (MJD 54683) to 2009 November 27 (MJD 55162). Because of the large leap in capabilities of LAT with respect to its predecessor, EGRET, this is the most extensive study to date of the -ray activity of this object at GeV-TeV photon energies. The Fermi-LAT spectrum (fitted with a single power-law function) was evaluated for 30-day time intervals. The average photon flux above GeV was found to be ph cm-2 s-1, and the average photon index . We observed only relatively mild (factor less than 2) -ray flux variations, but we detected remarkable spectral variability. In particular, during the four consecutive 30-day intervals of the “enhanced -ray flux” (MJD 54862–54982), the photon index changed from (for the first interval) down to (for the fourth one). During the whole period of 16 months, the hardest spectral index within the LAT energy range was , and the softest one was . Interestingly, this outstanding (and quite unexpected) variation in the slope of the GeV continuum did not correlate with the observed flux variations at energies above 0.3 GeV.
We compared the -ray activity measured by LAT in two different energy ranges ( GeV and GeV) with the X-ray activity recorded by the all-sky instruments RXTE-ASM ( keV) and Swift-BAT ( keV). We found no significant difference in the amplitude of the variability between X-rays and -rays, and no clear relation between the X-ray and -ray flux changes. We note, however, that the limited sensitivity of the ASM and (particularly) the BAT instruments to detect Mrk 501 in a 30-day time interval, together with the relatively stable X-ray emission of Mrk 501 during the observations, precludes any detailed X-ray/-ray variability or correlation analysis.
In this paper we also presented the first results from a 4.5-month multifrequency campaign on Mrk 501, which lasted from 2009 March 15 (MJD 54905) to 2009 August 1 (MJD 55044). During this period, the source was systematically observed with different instruments covering an extremely broad segment of the electromagnetic spectrum, from radio frequencies up to TeV photon energies. In this manuscript, we have focused on the average SED emerging from the campaign. Further studies on the multifrequency variability and correlations will be covered in a forthcoming publication.
We have modeled the average broadband spectrum of Mrk 501 (from radio to TeV) in the framework of the standard one-zone synchrotron self-Compton model, obtaining a satisfactory fit to the experimental data. We found that the dominant emission region in this source can be characterized by a size of , where cm is the gravitational radius of the black hole () hosted by Mrk 501. The intrinsic (i.e., not affected by cooling or absorption effects) energy distribution of the radiating electrons required to fit the data was found to be of a broken power-law form in the energy range GeV TeV, with spectral indices 2.2 and 2.7 below and above the break energy of GeV, respectively. In addition, the model parameters imply that all the electrons cool predominantly via synchrotron emission, forming a cooling break at TeV. We argue that the particular form of the electron energy distribution emerging from our modeling is consistent with the scenario in which the bulk of the energy dissipation within the dominant emission zone of Mrk 501 is related to relativistic, proton-mediated shock waves. The low-energy segment of the electron energy distribution () formed thereby, which dominates the production of -rays observed below a few GeV, seems to be characterized by low and relatively slow variability. On the other hand, the high-energy electron tail (), responsible for the bulk of the -rays detected above a few GeV, may be characterized by more significant variability.
Finally, we found that ultrarelativistic electrons and mildly-relativistic protons within the blazar zone of Mrk 501, if comparable in number, are in approximate energy equipartition, with their energy dominating the energy in the jet magnetic field by about two orders of magnitude. The model fit implies also that the total jet power, erg s-1, constitutes only a small fraction of the Eddington luminosity, , but is an order of magnitude larger than the bolometric, accretion-related luminosity of the central engine, . Finally, we estimated the radiative efficiency of the Mrk 501 jet to be at the level of a few percent, , where is the total emitted power of the blazar. The results from this study could perhaps be extended to all HSP BL Lacs.
9 Acknowledgments
References
- Abdo et al. (2009a) Abdo, A. A., et al. 2009a, ApJ, 700, 597
- Abdo et al. (2009b) Abdo, A. A., et al. 2009b, ApJ, 699, 817
- Abdo et al. (2010a) Abdo, A. A., et al. 2010a, ApJ, 710, 1271
- Abdo et al. (2010b) Abdo, A. A., et al. 2010b, ApJS, 188, 405
- Abdo et al. (2010c) Abdo, A. A., et al. 2010c, ApJ, 716, 30
- Abdo et al. (2010d) Abdo, A. A., et al. 2010d, ApJ, in preparation
- Acciari et al. (2008) Acciari, V. A., et al. 2008, ApJ, 679, 1427
- Acciari et al. (2010a) Acciari, V. A., et al. 2010a, ApJ, 714, 163A
- Acciari et al. (2010b) Acciari, V. A., et al. 2010b, in preparation
- Acciari et al. (2010c) Acciari, V. A., et al. 2010c, in preparation
- Achterberg et al. (2001) Achterberg, A., Gallant, Y. A., Kirk, J. G., & Guthmann, A. W. 2001, MNRAS, 328, 393
- Aharonian et al. (1999a) Aharonian, F. A., et al. 1999a, A&A, 342, 69
- Aharonian et al. (1999b) Aharonian, F. A., et al. 1999b, A&A, 349, 11
- Aharonian et al. (1999c) Aharonian, F. A., et al. 1999c, A&A, 349, 29
- Aharonian et al. (2001) Aharonian, F. A., et al. 2001, ApJ, 546, 898
- Ajello et al. (2008) Ajello, M., et al. 2008, ApJ, 673, 96
- Ajello et al. (2009a) Ajello, M., et al. 2009, ApJ, 690, 367
- Ajello et al. (2009b) Ajello, M., et al. 2009, ApJ, 699, 603
- Albert et al. (2007a) Albert, J., et al. 2007a, ApJ, 669, 862
- Albert et al. (2007b) Albert, J., et al. 2007b, Nucl. Instr. Meth., A583, 494
- Albert et al. (2008) Albert, J., et al. 2008, ApJ, 674, 1037
- Aliu et al. (2009) Aliu, E., et al. 2009, Astropart. Phys. 30, 293
- Aller et al. (1985) Aller, H. D., Aller, M. F., Latimer, G. E., & Hodge, P. E. 1985, ApJS, 59, 513
- Amato & Arons (2006) Amato, E., & Arons, J. 2006, ApJ, 653, 325
- Anderhub et al. (2009) Anderhub, H., et al. 2009, ApJ, 705, 1624
- Angelakis et al. (2008) Angelakis, E., Fuhrmann, L., Marchili, N., Krichbaum, T. P., & Zensus, J. A. 2008, Memorie della Societa Astronomica Italiana, 79, 1042
- Atlee et al. (2009) Atlee, D. W., Assef, R. J., & Kochanek, C. S. 2009, ApJ, 694, 1539
- Atwood et al. (2009) Atwood, W. B., et al. 2009, ApJ, 697, 1071
- Baring (2006) Baring, M. G. 2006, ApJ, 650, 1004
- Baring (2010) Baring, M. G. 2010, Adv. Space Res., in press (arXiv:1002.3848)
- Baring & Summerlin (2007) Baring, M. G., & Summerlin, E. J. 2007, Ap&SS, 307, 165
- Barth et al. (2002) Barth, A. J., Ho, L. C., & Sargent, W. L. W. 2002, ApJ, 566, L13
- Barthelmy et al. (2005) Barthelmy, S. D., et al. 2005, Space Science Reviews, 120, 143
- Bednarz & Ostrowski (1998) Bednarz, J., & Ostrowski, M. 1998, PRL, 80, 3911
- Bednarek & Protheroe (1999) Bednarek, W., & Protheroe, R. J. 1999, MNRAS, 310, 577
- Blandford & Begelman (1999) Blandford, R. D., & Begelman, M. C. 1999, MNRAS, 303, L1
- Błażejowski et al. (2005) Błażejowski, M., et al. 2005, ApJ, 630, 130
- Blumenthal & Gould (1970) Blumenthal, G. R., & Gould, R. J. 1970, Reviews of Modern Physics, 42, 237
- Bradbury et al. (1997) Bradbury, S. M., et al. 1997, A&A, 320, L5
- Bradt et al. (1993) Bradt, H. V., Rothschild, R. E., & Swank, J. H. 1993, A&AS, 97, 355
- Burrows et al. (2005) Burrows, D. N., et al. 2005, Space Science Reviews, 120, 165
- Catanese et al. (1997) Catanese, M., et al. 1997, ApJ, 487, L143
- Celotti & Ghisellini (2008) Celotti, A., & Ghisellini, G. 2008, MNRAS, 385, 283
- Chiaberge & Ghisellini (1999) Chiaberge, M., & Ghisellini, G. 1999, MNRAS, 306, 551
- Code & Welch (1979) Code, A. D., & Welch, G. A. 1979, ApJ, 228, 95
- Coppi & Blandford (1990) Coppi, P. S., & Blandford, R. D. 1990, MNRAS, 245, 453
- Crusius & Schlickeiser (1986) Crusius, A., & Schlickeiser, R. 1986, A&A, 164, L16
- Daum (1997) Daum, A., et al. 1997, Astropart. Phys., 8, 1
- Djannati-Ataï et al. (1999) Djannati-Ataï, A., et al. 1999, A&A, 350, 17
- Edelson & Krolik (1988) Edelson, R. A., & Krolik, J. H. 1988, ApJ, 333, 646
- Edelson et al. (2002) Edelson, R., et al. 2002, ApJ, 568, 610
- Edwards & Piner (2002) Edwards, P. G., & Piner, B. G. 2002, ApJ, 579, L67
- Finke et al. (2008) Finke, J. D., Dermer, C. D., Böttcher, M. 2008, ApJ, 686, 181
- Finke et al. (2010) Finke, J. D., Razzaque, S., & Dermer, C. D. 2010, ApJ, 712, 238
- Fitzpatrick (1999) Fitzpatrick, E. L. 1999, PASP, 111, 63
- Fossati et al. (2008) Fossati, G., et al. 2008, ApJ, 677, 906
- Franceschini et al. (2008) Franceschini, A., et al. 2008, A&A, 487, 837
- Fuhrmann et al. (2008) Fuhrmann, L., et al. 2008, A&A, 490, 1019
- Gehrels et al. (2004) Gehrels, N., et al. 2004, ApJ, 611, 1005
- Ghisellini et al. (2002) Ghisellini, G. et al. 2002, A&A, 386, 833
- Ghisellini & Svensson (1991) Ghisellini, G., & Svensson, R. 1991, MNRAS, 252, 313
- Ghisellini et al. (2005) Ghisellini, G., Tavecchio, F., & Chiaberge, M. 2005, A&A, 432, 401
- Ghisellini et al. (2009a) Ghisellini, G., Tavecchio, F., Bodo, G., & Celotti, A. 2009a, MNRAS, 393, L16
- Ghisellini et al. (2009b) Ghisellini, G., Maraschi, L., & Tavecchio, F. 2009b, MNRAS, 396, L105
- Giannios et al. (2009) Giannios, D., Uzdensky, D. A., & Begelman, M. C. 2009, MNRAS, 395, L29
- Gilmore et al. (2009) Gilmore, R. C., Madau, P.,Primack, J. R., Somerville, R. S., & Haardt, F. 2009, MNRAS, 399, 1694
- Giroletti et al. (2004) Giroletti, M., et al. 2004, ApJ, 600, 127
- Giroletti et al. (2008) Giroletti, M., et al. 2008, A&A, 488, 905
- Gliozzi et al. (2006) Gliozzi, M., et al. 2006, ApJ, 646, 61
- Graff et al. (2008) Graff, P. B., Georganopoulos, M., Perlman, E. S., & Kazanas, D. 2008, ApJ, 689, 68
- Hartman et al. (1999) Hartman, R. C., et al. 1999, ApJS, 123, 79
- Hoshino et al. (1992) Hoshino, M., Arons, J., Gallant, Y. A., & Langdon, A. B. 1992, ApJ, 390, 454
- Kalberla et al. (2005) Kalberla, P. M. W., et al. 2005, A&A, 440, 775
- Kataoka et al. (1999) Kataoka, J., et al. 1999, ApJ, 514, 138
- Kataoka et al. (2000) Kataoka, J., et al. 2000, ApJ, 528, 243
- Kataoka et al. (2001) Kataoka, J., et al. 2001, ApJ, 560, 659
- Katarzyński et al. (2001) Katarzyński, K., Sol, H., & Kus, A. 2001, A&A, 367, 809
- Katarzyński et al. (2008) Katarzyński, K., Lenain, J.-P., Zech, A., Boisson, C., & Sol, H. 2008, MNRAS, 390, 371
- Kino et al. (2002) Kino, M., Takahara, F., & Kusunose, M. 2002, ApJ, 564, 97
- Kirk & Heavens (1989) Kirk, J. G. & Heavens, A. F. 1989, MNRAS, 239, 995
- Kirk et al. (2000) Kirk, J. G., Guthmann, A. W., Gallant, Y. A., & Achterberg, A. 2000, ApJ, 542, 235
- Kneiske et al. (2004) Kneiske, T. M., Bretz, T.,Mannheim, K., & Hartmann, D. H. 2004, A&A, 413, 807
- Kovalev et al. (1999) Kovalev, Y. Y., Nizhelsky, N. A., Kovalev, Y. A., Berlin, A. B., Zhekanis, G. V., Mingaliev, M. G., & Bogdantsov, A. V. 1999, A&AS, 139, 545
- Krawczynski et al. (2000) Krawczynski, H. et al. 2000, A&A, 353, 97
- Krawczynski et al. (2004) Krawczynski, H., et al. 2004, ApJ, 601, 151
- Lemoine et al. (2006) Lemoine, M., Pelletier, G., & Revenu, B. 2006, ApJ, 645, L129
- Lister et al. (2009) Lister, M. L., et al. 2009, AJ, 137, 3718
- Marscher (1983) Marscher, A. P. 1983, ApJ, 264, 296
- Massaro et al. (2004a) Massaro, E., Perri, M., Giommi, P., & Nesci, R. 2004, A&A 413, 489
- Massaro et al. (2004b) Massaro, E., Perri, M., Giommi, P., Nesci, R., & Verrecchia, F. 2004, A&A 422, 103
- Mattox et al. (1996) Mattox, J. R., et al. 1996, ApJ, 461, 396
- Nandra et al. (1997) Nandra, K., et al. 1997, ApJ, 476, 70
- Narayan & Yi (1994) Narayan, R., & Yi, I. 1994, ApJ, 428, L13
- Nilsson et al. (2007) Nilsson, K., et al. 2007, A&A, 475, 199
- Niemiec & Ostrowski (2004) Niemiec, J., & Ostrowski, M. 2004, ApJ, 610, 851
- Ostrowski & Bednarz (2002) Ostrowski, M., & Bednarz, J. 2002, A&A, 394, 1141
- Paneque (2009) Paneque, D., Accretion and Ejection in AGNs: a global view, Como, Italy, 2009
- Perkins & Maier et al. (2009) Perkins, J. S., & Maier, G., et al. 2009, 2009 Fermi Symposium, eConf Proceedings C091122, arXiv:0912.3841v1
- Pichel et al. (2009) Pichel, A. (for the VERITAS Collaboration 2009), Proceedings of the 31st ICRC, Łódz̀, Poland
- Pian et al. (1998) Pian, E., et al. 1998, ApJ, 492, L17
- Piner et al. (2009) Piner, B. G., Pant, N., Edwards, P. G., & Wiik, K. 2009, ApJ, 690, L31
- Piron (2000) Piron, F. 2000, American Institute of Physics Conference Series, 515, 113
- Poole et al. (2008) Poole, T. S., et al. 2008, MNRAS, 383, 627
- Quinn et al. (1996) Quinn, J., et al. 1996, ApJ, 456, L83
- (105) J. Richards et al., in preparation
- Roming et al. (2005) Roming, P. W. A., et al. 2005, Space Science Reviews, 120, 95
- (107) Ros, E., et al., in preparation
- Sambruna et al. (2000) Sambruna, R., et al. 2000, ApJ, 538, 127
- Samuelson et al. (1998) Samuelson, F. W., et al. 1998, ApJ, 501, L17
- Schlegel et al. (1998) Schlegel, D. J., Finkbeiner, D. P., & Davis, M. 1998, ApJ, 500, 525
- Sikora & Madejski (2000) Sikora, M., & Madejski, G. 2000, ApJ, 534, 109
- Sikora et al. (2008) Sikora, M., Moderski, R., & Madejski, G. M. 2008, ApJ, 675, 71
- Sikora et al. (2009) Sikora, M., Stawarz, Ł., Moderski, R., Nalewajko, K., & Madejski, G. M. 2009, ApJ, 704, 38
- Silva et al. (1998) Silva, L., Granato, G. L., Bressan, A., & Danese, L. 1998, ApJ, 509, 103
- Sironi & Spitkovsky (2009) Sironi, L., & Spitkovsky, A. 2009, ApJ, 698, 1523
- Stawarz & Petrosian (2008) Stawarz, Ł., & Petrosian, V. 2008, ApJ, 681, 1725
- Strong et al. (2004) Strong, A. W., Moskalenko, I., & Reimer, O. 2004, ApJ, 613, 962
- Tavecchio et al. (2001) Tavecchio, F., et al. 2001, ApJ, 554, 725
- Teräsranta et al. (1998) Teräsranta, H., et al. 1998, A&AS, 132, 305
- Tramacere et al. (2009) Tramacere, A., Giommi, P., Perri, M., Verrecchia, F., & Tosti, G. 2009, A&A, 501, 879
- Vaughan et al. (2003) Vaughan, S., et al. 2003, MNRAS, 345, 1271
- Venturi et al. (2001) Venturi, T., et al. 2001, A&A, 379, 755
- Villata et al. (1998) Villata, M., Raiteri, C. M., Lanteri, L., Sobrito, G., & Cavallone, M. 1998, A&AS, 130, 305
- Villata & Raiteri (1999) Villata, M., & Raiteri, C. M. 1999, A&A, 347, 30
- Villata et al. (2008) Villata, M., et al. 2008, A&A, 481, L79
- Villata et al. (2009) Villata, M., et al. 2009, A&A, 504, L9
- Wagner (2008) Wagner, R. M. 2008, MNRAS, 385, 119
- Zdziarski & Lightman (1985) Zdziarski, A. A., & Lightman, A. P. 1985, ApJ, 294, L79