An Expanding Neutral Hydrogen Supershell Evacuated by
Multiple Supernovae in M101
Abstract
Several neutral hydrogen (HI) cavities have been detected in the Milky Way and other nearby star forming galaxies. It has been suggested that at least a fraction of them may be expanding supershells driven by the combined mechanical feedback from multiple supernovae occurring in an OB association. Yet most extragalactic HI holes have neither a demonstrated expansion velocity, nor an identified OB association inside them. In this work, we report on the discovery of an unbroken expanding HI supershell in the nearby spiral galaxy M101, with an UV emitting OB association inside it. We measure its size (500 pc) and expansion velocity (20 km/s) by identifying both its approaching and receding components in the position-velocity space, using 21 cm emission spectroscopy. This provides us with an ideal system to test the theory of supershells driven by the mechanical feedback from multiple supernovae. The UV emission of the cluster inside the supershell is compared with simulated spectral energy distribution of synthetic clusters of the appropriate age ( Myr). The observed UV flux is found to be consistent with an association of the appropriate mass () and age required by the energy budget of the supershell. Properties of this supershell and another previously reported in the same galaxy are used to infer its neutral hydrogen scale height and mean neutral hydrogen density in the disk. The presence of another UV emitting stellar association in over-dense swept up gas is discussed in the context of propagating star formation.
Subject headings:
supernovae: general — Galaxies: individual (M101) — ISM: Bubbles — Radio lines: ISM1. Introduction
OB associations and other young stellar clusters containing a few to thousands of massive stars of spectral class O and B; harbor the majority of massive stars in spiral galaxies. Stars of spectral class O are short-lived, and end their lives as supernovae within a few millions of years. These associations last for few tens of millions of years because all their massive stars exhaust their nuclear fuel within this time. Energetic radiation from OB associations ionize the interstellar medium (ISM) in galaxies and produce localized HII regions as well as diffuse ionized gas. Supernovae of various types explode from the massive stars that form in these associations which in turn pressurize and churn the ISM (Oey et al., 2002). Expanding neutral hydrogen structures, called supershells were identified in the Milky Way by Heiles (1979). Supershells form and evolve due to the continuous mechanical energy injection by stellar winds and SNe in massive parent OB associations (McCray & Kafatos, 1987). The outer shocks of the superbubbles sweep up the ambient ISM into a thin cool shell.
In this work we report yet another striking case of an expanding HI supershell in M101 which we argue is driven by multiple supernovae from a young stellar association. We use the observed properties of the HI supershell to determine its dynamical age and energy requirement. Here we demonstrate that this HI cavity has measured expansion velocity and at the same time is fully contained, i.e. it has not yet broken out of the disk of its host galaxy. We also detect a UV emitting stellar association inside the HI hole. We model its spectral energy distribution, test and confirm the hypothesis of (McCray & Kafatos, 1987) that some supershells are driven by the combined action of multiple supernovae occurring in a stellar association inside it.
These supershells may also play a role in the process of star formation and favor propagating star formation, as pointed out by McCray & Kafatos (1987); Palous et al. (1994). Hopkins et al. (2008), point out that the neutral and molecular gas replenishment in the walls of the supershells may provide the trigger for collapse and further star formation. In NGC 300, Blair & Long (1997) reported several cavities, much larger than galactic supernova remnants (SNRs). Payne et al. (2004) suggest that these may represent the above mentioned supershells.
Cavities have been found in neutral hydrogen (HI) surface density maps of several nearby galaxies (Tenorio-Tagle & Bodenheimer, 1988, for a classical review and inventory of HI holes, see, Bagetakos et al., 2010, for a recent review and survey of HI holes, see); including M101 (Kamphuis et al., 1991). However, the presence of a cavity alone is insufficient evidence for the existence of a supershell. It may simply be a low density region between higher density ones, created by turbulent distribution of gas. This pitfall is illustrated by the case of Holmberg II. In that galaxy Puche et al. (1992) used underdensities in HI column density map to create a catalog of HI cavities and postulated that they have been evacuated by multiple SNe. However Rhode et al. (1999) rule out a multiple supernova origin for most of these holes since they were unable to find any young cluster or even trace of recent star formation activity which would have led to the SNe responsible for these HI-holes. Stewart et al. (2000) have since then re-examined the Rhode et al. (1999) results and concluded that the energy available from massive stars inside HI shells indicates that energy deposited into the ISM from supernovae and stellar winds is sufficient to account for the HI morphology. Silich et al. (2006) have found that the observed properties of the most prominent kpc-scale structure in IC 1613 and the level of the detected star formation activity are inconsistent with the hypothesis that they are formed by energy injection from multiple supernovae.
The lack of direct determination of the source of energy driving these bubbles in many cases have led to numerous suggestions regarding their origin. Loeb & Perna (1998) have suggested that a fraction of HI supershells might be driven by Gamma Ray Bursts (GRBs). Wada et al. (2000) have discussed the possibility of forming cavities from the nonlinear growth of thermal and gravitational instabilities in the ISM. Tenorio-Tagle (1981) and Heiles (1984) have suggested that the impact of small companion galaxies or high velocity clouds with the disk of a larger galaxy may form these cavities. Elmegreen & Chiang (1982) have proposed that radiation pressure from field stars may provide a driving mechanism for supershells. Oey (1996) has provided a comprehensive comparison of the supernova driven supershell model and the observed properties of the LMC shells. Outstanding issues in the field are listed by Oey (2007).
The first unambiguous case of an extragalactic expanding HI shell associated with a hole in the HI surface density was reported by Kamphuis et al. (1991) in observations of M101 using the Westerbork Synthesis Radio telescope. Weisz et al. (2009) have investigated the creation of a supergiant HI shell in a dwarf irregular galaxy IC 2574 and its role in triggering star formation around it. Star formation studies in most nearby galaxies indicate that sites of recent star formation are correlated with sites of higher HI surface densities(Kennicutt, 1998), leading to several recipes for star formation. The feedback processes described above should however clear out the gas and lead to young stellar associations in regions of low gas density surrounded by higher density swept up shells. Therefore we began searching for cavities in the HI surface density, occupied by young clusters.
2. Data Description
In this work we have used 21 cm line data to identify and measure kinematic properties of our putative supershell. We have further used UV data to identify the young stellar association responsible for driving it. We discuss below, the detailed nature of the data; especially the sensitivities, spatial and spectral resolutions of the two relevant surveys.
2.1. The HI Nearby Galaxy Survey
The HI Nearby Galaxy Survey (THINGS) undertaken at the NRAO Very Large Array (VLA) to study the HI emission from nearby galaxies (Walter et al., 2008) provides high angular resolution () maps of HI emission and high spectral resolution (km/s) data. The survey has acquired radio interferometric observations for the target galaxies and presents the data in the form of image cubes generated from the interferometric data after background continuum subtraction. The three axes in these cubes represent the Right Ascension (RA), Declination (Dec) and recession velocity. For each triad of these coordinates, the cube gives the HI line flux density, in excess of the best estimate for the continuum. Information about the position and velocity of neutral hydrogen gas can be extracted from this data cube.
Demanding that the diameter of the supershell be more than the projected beam size, we can only detect supershells with radii more than , where is the beam size in units of 10” and is the distance to the host galaxy in Mpc. The two velocity components can be resolved only if the velocity is greater than the spectral resolution. This is of course limited by the sensitivity to HI in the beam, which is about atoms/cm2 for the data being used.
2.2. GALEX Nearby Galaxies Survey
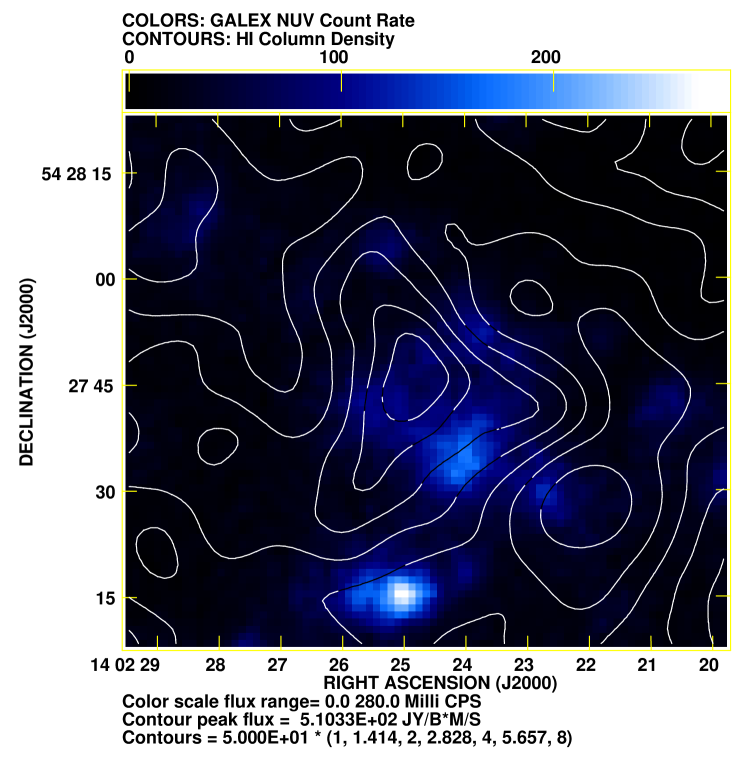
Data on M101 from Far and Near Ultraviolet observations are available from GALEX Nearby Galaxies Survey, conducted with the Galaxy Evolution Explorer (GALEX) (Martin et al., 2005). The ultraviolet emission provides us with a simple tool for identifying young stellar associations, which are expected to host a sizable fraction of the core collapse SNe, which supply the energy budget for the expanding supershells. We use information about both the HI distribution and the young stellar populations, to search for neutral hydrogen supershells powered by multiple supernovae.
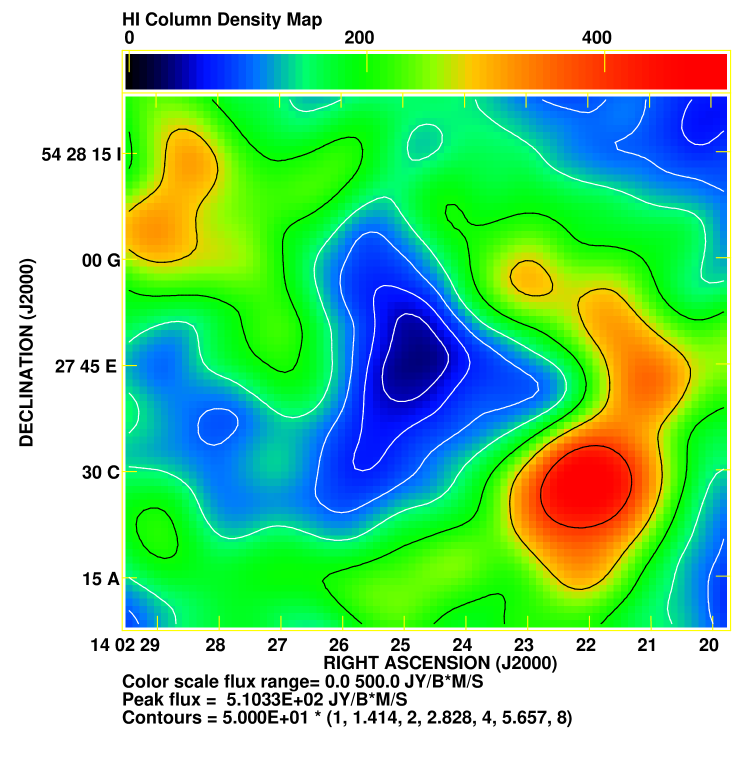
The GALEX data is provided as FITS files where each pixel gives the counts per second (cps), in the relevant band, for each RA-Dec pair. Comparing the HI surface density maps with those for near ultraviolet (NUV) emission for M101, reveals multiple regions with high UV emission but low HI surface density, surrounded by regions of higher HI density. These include the HI superbubble reported by Kamphuis et al.(1991). Another association hosting SN 1970G, is detected in the ultraviolet and found to be located on the high column density HI ring surrounding an underdensity. We have also found a separate cavity in the HI surface density, hosting a young stellar association of NUV magnitude , surrounded almost completely by higher HI surface density regions (Fig. 1). This region, which shall be discussed further in this work, is located approximately at 14h 02m 25s +54d 27’ 45”.
3. Evidence for expansion
Most extragalactic HI cavities have no demonstrated expansion velocities (see exceptions in Introduction) Demonstration of expansion velocities is essential for the identification of HI cavities associated with supershells. Even where expansion is claimed, the measured velocity is sometimes close to the typical rms velocity. In absence of clear detections for both forward and backward velocities, claims for expansion are ambiguous. For example Weisz et al. (2009) infer a velocity from a break in the P-V diagram, which they claim to be an indirect measure of expansion, yet consistent with presently stalled expansion. Because of sensitivity limitations, the velocity profile of the HI gas in an underdense region becomes difficult to measure. Puche et al. (1992) point out that because of the low brightness contrast between the shells and the face of their HI-holes, they find it very difficult to look for expansion in position velocity (P-V) diagrams and to demonstrate both incoming and receding components. The high sensitivity of the THINGS survey, used in our study, overcomes this limitation.
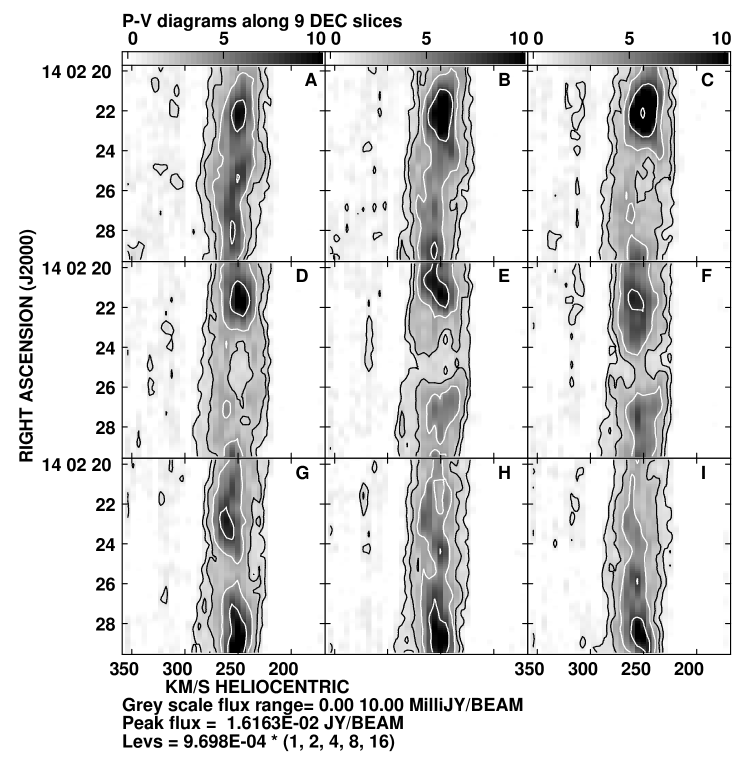
To study the dynamics of the HI gas, we extract the relevant region (entire area covered in Fig. 1) out of the THINGS data cube and transform it, using the Astronomical Image Processing System (AIPS http://www.aips.nrao.edu/), to obtain velocity information on the sky plane. We slice the resulting data sub-cube along nine equally spaced Dec values over the entire region of interest (whole of Fig. 1). The HI line intensity is then plotted in the P-V diagrams for these slices (Fig. 2) The P-V diagrams have a spatial resolution of 10” and a velocity resolution of 5 km/s. The HI distribution in the starting and ending slices (Fig. 2) are continuous over the RA and velocity, indicating that most of the gas is at the local rest frame velocity dictated by the galaxy rotation curve. The Dec slices cutting across the HI underdensity however indicate a clear transition to a two-component HI emission. The true nature of the HI-hole can however only be studied from its detailed velocity map. The data slice along Dec slice D clearly shows that the HI under-dense region is characterized by reduced emission from the rest frame velocity of the HI disk. This provides an unambiguous detection of an expanding HI supershell surrounding a UV emitting stellar association. The difference in velocity of the two components in the position velocity diagram (Fig. 2 panel D) is around 40 km/s. Interpreting this as twice the expansion velocity of the supershell, we get km/s. The diameter of the cavity, which lacks HI emission at the rest frame velocity of the disk, is around , corresponding to pc at the distance of 6.85 Mpc to M101 reported by Saha et al. (2006). We also note the bilateral symmetry in the emission from the two detected components and suggest that the supershell must have started out at or near the mid-plane of the HI disk of the host galaxy.
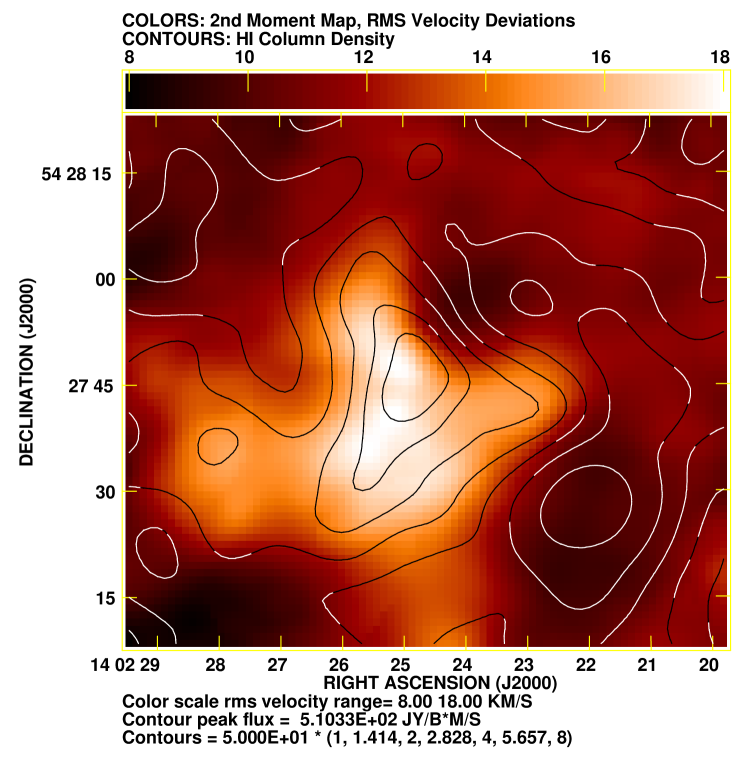
We also overlay the HI column density contours on a map of rms deviations of velocities from the mean, obtained by taking the second moment of the velocity distribution of the emission at each pixel (Fig. 3). The square of the rms velocities trace the line of sight kinetic energy per unit mass of the HI gas. Hence the high rms velocity of up to 18.1 km/s in the HI-hole region is evidence for recent energy injection into the ISM. For comparison, the neighborhood of the HI-hole, reveals an average rms velocity of 10.5 km/s with a standard deviation of 1.4 km/s. We construct a continuum subtracted HI spectra (Fig. 4), integrated over a box (2.6beamsize on each side) inside the HI-hole. It clearly shows that there are two components of HI emission with easily differentiated velocities. We interpret the two components, as demonstrated in Fig. 2 and Fig. 4, as the approaching and receding hemispheres of an expanding HI supershell around an evacuated bubble. Note that the sensitivity of the THINGS survey allows us to detect the gas even in the lowest density region with high significance.
4. Implications for Host Galaxy
HI observations of face-on galaxies map their neutral hydrogen surface densities. However HI scale heights have been directly measured mostly for edge on systems. Scale height measurements for face-on galaxies are rare. Here we propose to put constrains on the HI scale height of M101 based on the properties of the described supershell and the one reported by Kamphuis et al. (1991). Bruhweiler et al. (1980) have discussed the sizes of galactic HI shells as a function of the neutral hydrogen scale height.
4.1. Supershells in M101
Kamphuis et al. (1991) have argued on the basis of the size of the hole found by them and the velocity width of its HI profile that it has already reached a state where parts of it are accelerating away from the disk and into the halo. At the quoted diameter of 1.5 kpc, if the supershell has burst out of the galactic HI disk, the HI scale height is likely to be less than pc. On the other hand both the approaching and receding components of the HI profile for the hole reported in our work (Fig. 2 panel D) are continuous in position and velocity (unlike Fig. 3 in Kamphuis et al. (1991)) and appears not to have burst out of the HI disk. Therefore the scale height is likely to be more than pc.
4.2. Scale Height of M101
McCray & Kafatos (1987) explain that the pressure driven phase of a supershell terminates when becomes comparable to the HI scale height. Thereafter, if the velocity of the shell at one scale height is greater than the typical RMS velocity of the HI, portions of the shell traveling perpendicular to the disc accelerate into the halo, fragment due to Rayleigh-Taylor instabilities and discharge the internal pressure into the galactic corona. The portion moving along the disc, enters the pressure-less snowplow phase and continues to evolve slowly (). Hence, the radii of the largest observed HI-holes in face-on disk galaxies are expected to be slightly larger than the HI scale height.
Observations of these two (Kamphuis et al. (1991) and this work) supershells constrain the HI scale height of M101 to be between 500 pc and 750 pc. The average line integrated flux, from the region covered in Fig. 1, is 0.18 Jy/beam km/s. We use the conversion from Rohlfs & Wilson (2000) to get an average HI column density of atoms/cm2. Even the least dense area in Fig. 1 has which is well above the detection threshold. Using a scale height of 600 pc consistent with the above constraints we infer the initial gas density by dividing the column density by twice the scale height to get in units of atoms cm-3. We have used this value while estimating the energy budget of the supershell later in this work.
5. Inversion of McCray & Kafatos Model
Massive stars in a young stellar association end their lives as core collapse supernovae. In an OB association this may result in the formation of an expanding neutral hydrogen supershell driven by the mechanical feedback from the combined action of multiple supernovae. McCray & Kafatos (1987) demonstrate that the rate of SNe from a cluster of typical IMF, varies only slightly over the first 50 Myr and can be thought of as a continuous energy injection over such a timescale, powering the expansion of the supershell. This provides a particularly simple framework, which we adopt, for understanding the evolution of a supershell, pressure-driven by feedback from multiple supernova. The radius () and velocity () of an expanding supershell, given by them, are
| (1) |
and
| (2) |
Where, is the number of massive () stars in the association responsible for creating the supershell. is the energy produced by each supernova explosion. is the assumed uniform atomic density prior to the formation of the supershell and is the age of the supershell in units of years. For an alternate formulation of the problem, which directly relates the evolution to the supershell to the mechanical luminosity of the driving cluster, see Appendix.
The (McCray & Kafatos, 1987) model is invertible in principle, because the and the are directly observable from the HI data. In this work, we therefore re-frame the equations as
| (3) |
and
| (4) |
to express the variables, which characterize the supershell, purely in terms of the observable quantities. These equations will allow us to estimate the age and mass of an association which will suffice to reproduce the observed size and expansion velocity of any given supershell. If there is no young stellar association interior to an observed expanding neutral hydrogen structure or an association smaller than what is demanded by these set of equations, then the (McCray & Kafatos, 1987) model can be ruled out. If on the other hand, one finds such a sufficiently luminous association, the model can then explain the origin of such a supershell.
6. Age and energy budget of the M101 supershell
Weisz et al. (2009) have used the model of Chevalier (1974), to compute the energy required to evacuate the HI mass inside the supershell that they study in IC 2574. Chevalier’s model deposits the total energy at the start of the simulation and he notes that this soon relaxes to an approximation of the Sedov solution. This was intended for simulating a single SNR. However this is not a suitable description of the energy input from multiple SNe as stars of different initial masses, explode at different points in time. In addition note that the power law index of time evolution (3/5 in Eq.1), due to continuous energy injection, is different from the Sedov-like solution (used by Weisz et al. (2009)) and is similar to the wind solution of Weaver et al. (1977).
The appropriate evolution of the supershell can be obtained by the self consistent solution of Eqs (1) and (2). The observed size and expansion velocity of the supershell will be satisfied in this manner for
| (5) |
and
| (6) |
Assuming and (as already demonstrated), we need the driving cluster to be massive enough to harbor supernova yielding massive stars. Assuming the total mass of stars required to be formed to produce each core collapse supernova as 196 following McKee & Williams (1997), we need a cluster of initial mass which has been driving this supershell into the ISM for the last Myr. Only of the energy from the already exploded supernovae (at ), needs to be in the kinetic energy of the supershell, assuming . This is close to the estimate from McCray & Kafatos (1987). According to Starburst99 (Leitherer et al., 1999) the number of ionizing photons with wavelength below 912Å, drops to times the initial rate, by the time a typical association reaches 15 Myr. Hence, given the estimated age of the supershell it is no surprise that it is made up of neutral hydrogen.
7. UV diagnostic for mass of the cluster
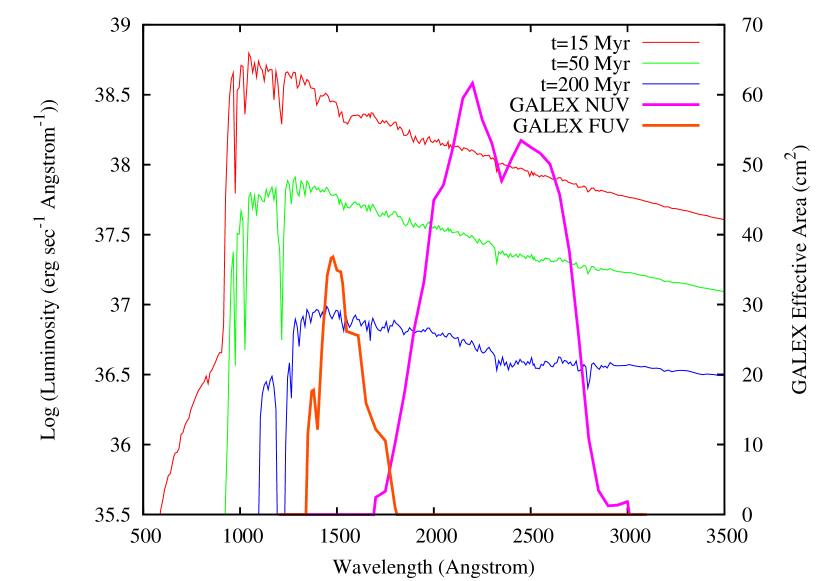
Most supershells in the Milky Way suffer from large extinctions (Tenorio-Tagle & Bodenheimer, 1988). Even for many extragalactic holes, young stellar populations have not been detected inside (Rhode et al., 1999). Using Starburst99 with the parameters as described in Leitherer et al. (1999) we simulate the spectral energy distribution (SED) of an instantaneous starburst (Salpeter IMF with between ) of solar metallicity () aged 15, 50 and 200 Myr, over a range of wavelengths from to (see Fig. 5). The effective collecting area of the GALEX NUV and FUV are plotted on the same graph for comparison. At the effective wavelength of the GALEX NUV band the luminosity of the 15 Myr (chosen to match the dynamical age of the supershell) starburst is given as ergs sec-1 . It is to be noted, that as an association ages, over the time range represented in the figure, the flux in both GALEX bands falls by more than one order of magnitude. This motivates the use of GALEX images in locating young stellar association in nearby galaxies, which may be the source of multiple supernovae driving supershells as suggested by McCray & Kafatos (1987).
In this work, we measure the NUV emission of the cluster interior to the HI cavity using archival GALEX observation. We find the NUV magnitude, uncorrected for extinction, to be . Using only the galactic extinction of from Schlegel et al. (1998), and scaling it to the NUV band using the relationship from Cardelli et al. (1989), we get , for a typical Milky Way ratio of total to selective absorption of . At the adopted distance to M101, this gives an NUV luminosity of ergs sec-1 Å-1. Comparing the simulated SED from Starburst99 (as above) and the observed GALEX flux, we infer the mass of the putative young stellar association responsible for evacuating the observed supershell. Assuming that the age of association is same as the dynamic age of the supershell as determined in this work, the association had an original mass of . This is consistent with the minimum mass requirement of that was derived from the energy requirement in the McCray & Kafatos (1987) model. The inferred mass of this cluster is consistent with masses of the most massive of young stellar clusters (or super star clusters) seen in the local universe (Whitmore, 2003). Thus we find that the McCray & Kafatos (1987) model provides a simple and sufficient explanation of the observed supershell in M101.
8. Instabilities of the Expanding Supershell
Apart from the NUV emission from stars inside the bubble, we also note the even stronger NUV emission from the high density swept up ring to the south of the cavity (Fig. 6) at around 14h 02m 25s +54d 27’ 15”. We suggest that this is evidence for induced star formation at the edges of expanding supershells driven by multiple supernovae from an OB association. Elmegreen (1989, 1994) has investigated the gravitational collapse of decelerating shocked layers in OB associations and proposed a condition for propagating star formation due to large expanding shells. Vishniac (1994) has presented hydrodynamical stability analysis for cold gas bounded by shocks.
Ehlerova et al. (1997) performed a linear analysis of the Elmegreen-Vishniac instability and derived an instability time () which marks the onset of gravitational instability of a self gravitating expanding supershell. Re-casting their expression in the notation of McCray & Kafatos (1987),
| (7) |
where is the sound speed in the shell in units of 1 km/s and is the mean molecular weight in units of 1.3 amu. Using , and unity for the rest of the dimensionless quantities, we get Myr. Comparing this with the estimated age of the supershell (Eq 5), we find that the supershell is not yet prone to gravitational instabilities leading to star formation. Since there is star formation at the boundary of the region discussed before, this then may be due to the expanding supershell encountering an existing dense cloud triggering star formation (Elmegreen (1998) and references therein). Such a scenario can also provide a natural explanation for the deviation from spherical symmetry in the HI-hole.
9. Discussions
We have reported the discovery of an expanding HI supershell in M101, which hosts a young stellar association in its cavity. The supershell may have been created by the combined effect of multiple supernovae. This allowed us to use the McCray & Kafatos model to estimate the age and mechanical luminosity required from the cluster that harbored the massive stars responsible for these explosions. By comparing the observed GALEX NUV emission of the cluster found inside the HI-hole, with the synthetic SED of the required age obtained using Starburst99, we demonstrate that the cluster is heavy enough to host enough massive stars which explode as supernovae and provide energy to drive the supershell. We have discussed the implications of the measured properties of the supershell in the host galaxy to estimate the galaxy’s HI scale height and the mean neutral hydrogen density in the disk. We also note the presence of young stellar associations near the edge of the observed supershell and discussed the role of instabilities in propagating star formation.
Further studies, e.g. high resolution imaging or integral field optical spectroscopy of the cluster in the HI-hole, may determine the metallicity enrichment of the gas and through the use of spectral fitting of stellar populations, allow the determination of true age and initial mass of the cluster. Spatially resolved integral field spectroscopy also has the potential to reveal the role of multiple stellar populations, if any, within the cavity. We have shown that the observed UV fluxes of the cluster are consistent with the standard model of supershell formation. An independent determination of the age of the cluster will prove the applicability of the model in this case. Sensitive X-ray observations may reveal emission from possible hot coronal gas inside the supershell (Silich et al., 2001, 2005). However, Chu et al. (1995) suggest that an intermittent process such as hidden supernova remnants may be responsible for the X-ray-bright super bubbles and hence, not all superbubbles are X-ray bright.
In case of triggered star formation, Stewart et al. (2000) have emphasized the importance of establishing that stars are formed in chains of progressing age. We predict that spectroscopy will reveal the populations noted near the edge of the supershell, to be younger than the cluster seen inside the supershell. A detailed study of this supershell with the upcoming ALMA may render CO line maps which will trace the cold molecular gas at the sites of triggered star formation. Bagetakos et al. (2010) have now produced a catalog of more than 1000 HI holes in 20 nearby galaxies from the THINGS sample. A lot of these galaxies have deep GALEX observations, which we have demonstrated as a simple tool for identifying possible young stellar associations supplying the energy requirement. This could form the basis of a much larger study to determine the fraction of HI holes that can be explained by the McCray & Kafatos (1987) model.

References
- Bagetakos et al. (2010) Bagetakos, I., Brinks, E., Walter, F., de Blok, W. J. G., Usero, A., Leroy, A. K., Rich, J. W., & Kennicutt, Jr, R. C. 2010, ArXiv e-prints
- Bisnovatyi-Kogan & Silich (1995) Bisnovatyi-Kogan, G. S., & Silich, S. A. 1995, Reviews of Modern Physics, 67, 661
- Blair & Long (1997) Blair, W. P., & Long, K. S. 1997, ApJS, 108, 261
- Bruhweiler et al. (1980) Bruhweiler, F. C., Gull, T. R., Kafatos, M., & Sofia, S. 1980, ApJ, 238, L27
- Cardelli et al. (1989) Cardelli, J. A., Clayton, G. C., & Mathis, J. S. 1989, ApJ, 345, 245
- Chevalier (1974) Chevalier, R. A. 1974, ApJ, 188, 501
- Chu et al. (1995) Chu, Y., Chang, H., Su, Y., & Mac Low, M. 1995, ApJ, 450, 157
- Ehlerova et al. (1997) Ehlerova, S., Palous, J., Theis, C., & Hensler, G. 1997, A&A, 328, 121
- Elmegreen (1989) Elmegreen, B. G. 1989, ApJ, 340, 786
- Elmegreen (1994) —. 1994, ApJ, 427, 384
- Elmegreen (1998) Elmegreen, B. G. 1998, in Astronomical Society of the Pacific Conference Series, Vol. 148, Origins, ed. C. E. Woodward, J. M. Shull, & H. A. Thronson Jr., 150
- Elmegreen & Chiang (1982) Elmegreen, B. G., & Chiang, W. 1982, ApJ, 253, 666
- Heiles (1979) Heiles, C. 1979, ApJ, 229, 533
- Heiles (1984) —. 1984, ApJS, 55, 585
- Hopkins et al. (2008) Hopkins, A. M., McClure-Griffiths, N. M., & Gaensler, B. M. 2008, ApJ, 682, L13
- Kamphuis et al. (1991) Kamphuis, J., Sancisi, R., & van der Hulst, T. 1991, A&A, 244, L29
- Kennicutt (1998) Kennicutt, Jr., R. C. 1998, ARA&A, 36, 189
- Leitherer et al. (1999) Leitherer, C., et al. 1999, ApJS, 123, 3
- Loeb & Perna (1998) Loeb, A., & Perna, R. 1998, ApJ, 503, L35
- Mac Low & McCray (1988) Mac Low, M., & McCray, R. 1988, ApJ, 324, 776
- Martin et al. (2005) Martin, D. C., et al. 2005, ApJ, 619, L1
- McCray & Kafatos (1987) McCray, R., & Kafatos, M. 1987, ApJ, 317, 190
- McKee & Williams (1997) McKee, C. F., & Williams, J. P. 1997, ApJ, 476, 144
- Oey (1996) Oey, M. S. 1996, ApJ, 467, 666
- Oey (2007) Oey, M. S. 2007, in IAU Symposium, Vol. 237, IAU Symposium, ed. B. G. Elmegreen & J. Palous, 106–113
- Oey et al. (2002) Oey, M. S., Groves, B., Staveley-Smith, L., & Smith, R. C. 2002, AJ, 123, 255
- Palous et al. (1994) Palous, J., Tenorio-Tagle, G., & Franco, J. 1994, MNRAS, 270, 75
- Payne et al. (2004) Payne, J. L., Filipović, M. D., Pannuti, T. G., Jones, P. A., Duric, N., White, G. L., & Carpano, S. 2004, A&A, 425, 443
- Puche et al. (1992) Puche, D., Westpfahl, D., Brinks, E., & Roy, J. 1992, AJ, 103, 1841
- Rhode et al. (1999) Rhode, K. L., Salzer, J. J., Westpfahl, D. J., & Radice, L. A. 1999, AJ, 118, 323
- Rohlfs & Wilson (2000) Rohlfs, K., & Wilson, T. L. 2000, Tools of radio astronomy, ed. Rohlfs, K. & Wilson, T. L.
- Saha et al. (2006) Saha, A., Thim, F., Tammann, G. A., Reindl, B., & Sandage, A. 2006, ApJS, 165, 108
- Schlegel et al. (1998) Schlegel, D. J., Finkbeiner, D. P., & Davis, M. 1998, ApJ, 500, 525
- Silich et al. (2006) Silich, S., Lozinskaya, T., Moiseev, A., Podorvanuk, N., Rosado, M., Borissova, J., & Valdez-Gutierrez, M. 2006, A&A, 448, 123
- Silich et al. (2005) Silich, S., Tenorio-Tagle, G., & Añorve-Zeferino, G. A. 2005, ApJ, 635, 1116
- Silich et al. (2001) Silich, S. A., Tenorio-Tagle, G., Terlevich, R., Terlevich, E., & Netzer, H. 2001, MNRAS, 324, 191
- Stewart et al. (2000) Stewart, S. G., et al. 2000, ApJ, 529, 201
- Tenorio-Tagle (1981) Tenorio-Tagle, G. 1981, A&A, 94, 338
- Tenorio-Tagle & Bodenheimer (1988) Tenorio-Tagle, G., & Bodenheimer, P. 1988, ARA&A, 26, 145
- Vishniac (1994) Vishniac, E. T. 1994, ApJ, 428, 186
- Wada et al. (2000) Wada, K., Spaans, M., & Kim, S. 2000, ApJ, 540, 797
- Walter et al. (2008) Walter, F., Brinks, E., de Blok, W. J. G., Bigiel, F., Kennicutt, R. C., Thornley, M. D., & Leroy, A. 2008, AJ, 136, 2563
- Weaver et al. (1977) Weaver, R., McCray, R., Castor, J., Shapiro, P., & Moore, R. 1977, ApJ, 218, 377
- Weisz et al. (2009) Weisz, D. R., Skillman, E. D., Cannon, J. M., Walter, F., Brinks, E., Ott, J., & Dolphin, A. E. 2009, ApJ, 691, L59
- Whitmore (2003) Whitmore, B. C. 2003, in A Decade of Hubble Space Telescope Science, ed. M. Livio, K. Noll, & M. Stiavelli, 153–178
Appendix A Supershell Dynamics: Alternate Formulation
In this work we have used the early formulation of the supershell dynamics as given by McCray & Kafatos (1987). This formulation depends directly on terms like which relate the dynamics to the total number of supernova yielding stars in the associations. However in a later work, Mac Low & McCray (1988); Bisnovatyi-Kogan & Silich (1995) have directly linked the evolution of the supershell with the combined mechanical luminosity of the stellar winds and supernovae from the association. Mac Low & McCray (1988) give the radius and velocity evolution of the supershell as
| (A1) |
and
| (A2) |
where the new term is the mechanical luminosity of the cluster in units of . The dynamics is identical to the McCray & Kafatos (1987) model and hence can be inverted to give,
| (A3) |
and
| (A4) |
which provide the required input parameters as a function of the observed properties of the supershell. The expression for the age is identical to that derived earlier in this work. Substituting the values for , and , the required mechanical luminosity for the cluster is .
This mechanical luminosity may now be compared directly with those obtained from population synthesis models. For the fiducial Starburst99 (Leitherer et al., 1999) simulation described earlier in this work, the mean mechanical luminosity in the first 15 Myr from stellar winds and supernovae is given as . Comparing this with the energy budget, requires a massive young stellar cluster. But, this is lower than the mass required in the earlier analysis and hence the observed UV flux is consistent with a cluster massive enough to drive the supershell.