A coupled quantum dot laser amplifier: Raman transitions between spin singlet and triplet states
A holy grail of photonics research is the realization of a laser that uses a single quantum emitter as the gain medium [1]. Such a device would exhibit a plethora of new features, including lasing without a well-defined threshold [2, 3] and output intensity fluctuations that remain below the shot-noise limit [2, 4, 5]. While single-atom lasers have been demonstrated [6, 7, 8], compact devices capable of continuous-wave operation require monolithic structures involving a solid-state quantum emitter. Here, we report the observation of steady-state laser amplification in Raman transitions between the lowest-energy entangled spin states of a quantum-dot molecule. Absorption and resonance fluorescence experiments demonstrate that the singlet and triplet states have electric-dipole coupling to a common optically excited state. Fast spin relaxation ensures population inversion on the triplet transition when the singlet transition is driven resonantly. By embedding the quantum-dot molecule in a cavity of modest quality factor, a solid-state single-emitter laser could be realized.
To act as a gain medium for laser amplification, a quantum emitter needs to feature at least three coupled energy levels, so that population inversion can be achieved on one transition by pumping another [9]. A suitable level scheme is provided by a pair of vertically stacked self-assembled InGaAs quantum dots (QDs) [10, 11, 12], separated by a thin GaAs tunnel barrier and embedded in a GaAs Schottky diode (Fig. 1a). When both QDs contain a single electron – a charging regime denoted as (1,1) – the lowest energy levels correspond to spin singlet (S) or triplet (T-, T0, T+) states (Fig. 1b). Electron tunneling between the two dots gives rise to an exchange splitting between the (1,1)S and (1,1)T states (bottom panel in Fig. 1c), which allows us to selectively address them optically [13]. The size of the exchange splitting depends on the tunneling rate and can be tuned by varying the gate voltage [14].
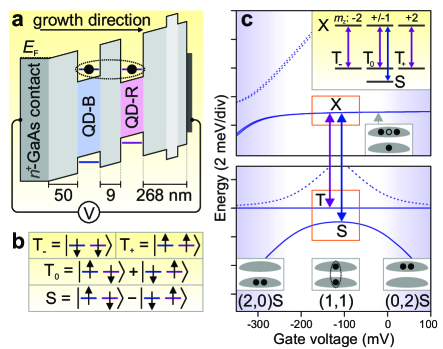
The lowest-energy optical excitation corresponds to adding an electron-hole pair in the top dot (QD-R), which has a redshifted transition energy compared to the bottom dot (QD-B). The resulting fourfold degenerate excited states X (top panel in Fig. 1c) are labeled by the z-component of the total angular momentum (); this consists of a contribution from the heavy hole in QD-R () plus the unpaired electron in QD-B (). From the associated optical selection rules (inset to Fig. 1c), it follows that states S and T0 share two common optically excited states with . At zero magnetic field, the selection rules are modified by the hyperfine interaction with the nuclear spins, which strongly mixes the three degenerate triplet states [15]. Likewise, the four degenerate optically excited states are mixed by both hyperfine interaction and indirect electron-hole exchange [14]. As a consequence, population in any X or T level is efficiently distributed among the entire X or T manifold, so that the full system can be represented by three levels (S, T and X) in a simple lambda configuration, as illustrated in Fig. 4b. In this Letter, we use this lambda system to achieve single-pass laser amplification of .
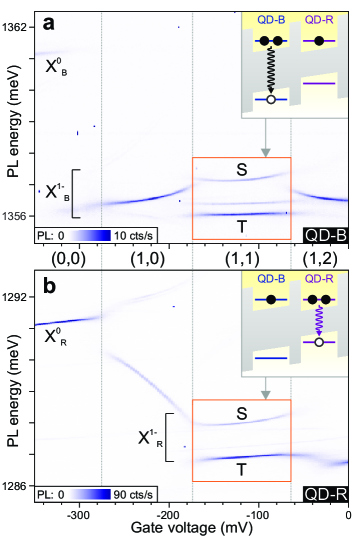
We first perform micro-photoluminescence (PL), in order to select a coupled quantum dot (CQD) pair that exhibits the (1,1) charging regime. As the gate voltage is increased, the number of electrons in the CQD increases one by one. Therefore, the PL spectra in Fig. 2 show typical plateaus [16], separated by dotted vertical lines indicating a change in the ground state charge. Each plateau corresponds to emission from the neutral exciton or negatively charged trion located in a particular dot. The detailed shape of the plateau for a given QD depends on the number of electrons in its partner dot, due to both tunnel coupling [10, 11, 12] and charge sensing [18, 19]. From these characteristic PL patterns we identify the CQD charging sequence as (0,0)(1,0)(1,1)(1,2). This sequence is confirmed using numerical simulations (see supplementary figure S1). In the (1,1) regime, we find an exchange splitting between the S and T states of .
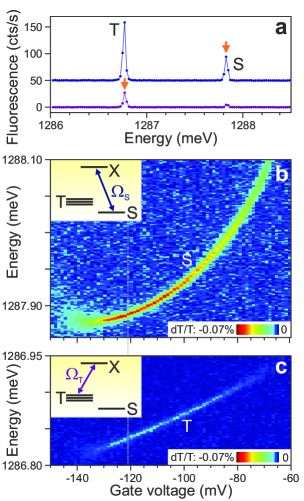
To establish the optical connection between the S and T states, we employ resonance fluorescence measurements [20, 21]. When resonantly driving the S transition in QD-R (orange arrow in the upper trace of Fig. 3a), fluorescence is detected not only at the same energy (Rayleigh scattering), but also at an energy corresponding to the T transition (Raman scattering). Conversely, when driving the T transition in QD-R (orange arrow in the lower trace), additional weaker emission is observed at the S transition. These measurements demonstrate that the (1,1)S and T states indeed share common optically excited states X in which a negative trion is located in QD-R. Moreover, the fact that the T peak in the upper trace is times stronger than the S peak implies that the fourfold degenerate states X are strongly mixed; without mixing, driving the S transition would only excite the subspace, resulting in an equal number of photons emitted on the T and S transitions (see the inset to Fig. 1c). Together, these observations provide experimental justification for treating the system of one S, three T and four X states as a simple lambda system, as illustrated in Fig. 4b.
It is important to notice that driving the T transition results in much less fluorescence than driving the S transition, although both traces in Fig. 3a were taken with identical laser power. Taking into account the imperfect cancelation of the excitation laser, we find an S:T fluorescence ratio of . This surprising asymmetry is also seen in differential transmission (dT) measurements. On the S-X transition (Fig. 3b), scattering of incoming resonant laser photons leads to a maximum dT contrast of . The dT contrast of the T-X transition (Fig. 3c) is only , i.e. times lower. This difference points towards the presence of spin relaxation from T to S. When the laser is tuned to the S resonance, relaxation counteracts optical shelving [17] in the T states and thus maintains the photon scattering rate (and therefore the dT or resonance fluorescence signal). In contrast, a laser on the T resonance will quickly drive the system to the S state, where it will remain shelved for a long time, since relaxation from S back to T is impeded by the S-T energy difference. Thus, the overall photon scattering rate in this case will be strongly reduced. Using a steady-state solution of the rate equations describing the S, T & X populations (supplementary Fig. S2), we can estimate the relaxation rate . The measured S:T scattering ratio of (obtained from the difference in dT contrast between Figs. 3b and 3c or from the difference in fluorescence intensity between the two traces in Fig. 3a) gives , where corresponds to the total spontaneous emission rate from X.
Although the mechanism behind this fast spin relaxation is not understood at present, it is most likely related to the very large exchange splitting between S and T states in our device. (Recent experiments using CQDs with S-T splitting around [13] did not exhibit a similar fast relaxation.) From the perspective of using S and T0 states to encode a qubit, the spin relaxation may point to a fundamental limitation. However, we can also use it to our advantage, since it enables population inversion and laser amplification, as we will now demonstrate.
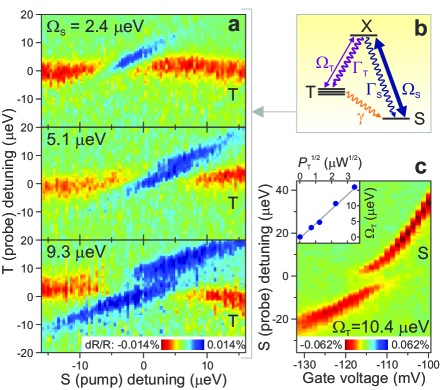
To generate population inversion, we use a strong pump laser that is stepped across the S-X resonance. To detect the inversion, we measure the differential reflection (dR) of a weak probe laser scanned across the T-X resonance (see the Methods section). When the pump is off-resonance and has modest intensity (left and right sides of the top panel in Fig. 4a), the probe maps out the unperturbed T-X transition. As the pump gets closer to the S resonance (middle of the panel), the sign of the dR signal measured by the probe laser reverses, as indicated by the blue color. This signifies that the probe laser actually gains intensity by interacting with the single CQD pair, corresponding to single-pass laser amplification. As the pump power is increased (middle and bottom panel in Fig. 4a), the amplification becomes stronger and extends further from the resonance. Remarkably, for a pump Rabi frequency eV (lowest panel), we observe amplification from the Autler-Townes doublet of dressed S X states [22].
The laser amplification is directly enabled by the fast relaxation: when the CQD decays from X to T by emitting a photon, spin relaxation quickly depopulates the T states, and the pump field excites the system back to X. The net result is that for sufficiently strong relaxation rate and pump rate (as compared to ), population inversion occurs on the T-X transition. In this case, the probe laser intensity is increased by interaction with the CQD system. As a control experiment, we tune the pump laser to the T transition and probe the S transition (Fig. 4c). In this case, a standard (absorptive) Autler-Townes splitting is observed, without any laser gain even for very high pump powers. This confirms that population inversion on the S-X transition is prevented by the slow relaxation rate from S to T at low temperatures.
In summary, we have demonstrated laser amplification in Raman transitions between singlet and triplet states of a single CQD molecule. By coupling this new type of solid-state quantum emitter to a micro-cavity, it should be possible to observe laser oscillation. The photon statistics of such a laser are expected to differ from ordinary lasers. From the measured single-pass gain in probe laser intensity, we estimate that a cavity quality factor of should enable laser oscillation. Employing established techniques such as solid-immersion lenses [23] could increase the gain and thereby reduce the required -factor by an order of magnitude, making a practical implementation feasible.
Methods
Device fabrication
The device heterostructure was grown by molecular-beam-epitaxy on a (100) semi-insulating GaAs substrate. It contains two layers of self-assembled InGaAs QDs, separated by a GaAs tunnel barrier and embedded in a GaAs Schottky diode. QDs in the top layer tend to nucleate directly above QDs in the bottom layer due to the strain field produced by the latter [24], resulting in vertically stacked CQD pairs with density . During growth, the partially-covered-island technique [25] was used to reduce the nominal thickness of the bottom dots to , and that of the top dots to ; the resulting blueshift of the bottom dots (QD-B) with respect to the top dots (QD-R) allowed the lowest electronic energy levels of QD-B and QD-R to be brought into resonance. After growth, AuGe ohmic contacts were made to the Si-doped -GaAs back contact ( below the bottom QD layer), and a semi-transparent gate ( of Ti plus of Au) was evaporated on top of the device. The voltage applied between top gate and back contact enabled control over the CQD charging state, allowing both QDs of a pair to be filled with a single electron. A thick Al0.3Ga0.7As blocking barrier was incorporated below the top surface to reduce the current through the device.
Optical measurements
The device was mounted on a 3-axis piezoelectric nanopositioning unit in a liquid-helium bath cryostat operating at . An aspheric lens with a numerical aperture of 0.55 focused the excitation light to a near-diffraction limited spot on the sample, enabling optical addressing of an individual CQD stack. For PL measurements, the CQD was excited with a non-resonant diode laser; for resonance fluorescence, a narrow-band external cavity diode laser was tuned through a CQD resonance. In both cases, the resulting CQD emission was collected through the same focusing lens, coupled into a fiber and sent to a monochromator equipped with a blaze-grating, which dispersed the light onto a N2 cooled silicon charge-coupled device detector. To separate the CQD emission from the reflected excitation laser, both were passed through a polarizer before reaching the spectrometer, which suppressed the linearly polarized excitation laser by a factor of .
To measure differential transmission (dT) [26], the intensity of a resonant laser was detected using a Si photodiode mounted directly underneath the device. To improve the signal-to-noise ratio of these measurements, a square wave with an amplitude of at a frequency of was added to the DC gate voltage. This modulation shifted the CQD in and out of resonance with the laser via the DC Stark effect, allowing a lock-in amplifier to detect the resulting modulation amplitude of the laser light transmitted through the device.
For the two-laser differential reflection (dR) measurements, a combination of all these techniques was used. The strong pump laser and the weak probe laser had orthogonal linear polarizations; this allowed the reflected pump laser to be extinguished using a polarizer, before coupling the reflected light into a fiber and sending it to a room-temperature Si-photodiode, where it was measured using the same lock-in technique as described above.
References
- [1] Mu, Y. & Savage, C.M. One-atom lasers. Phys. Rev. A 46, 5944-5954 (1992).
- [2] Rice, P.R. & Carmichael, H.J. Photon statistics of a cavity-QED laser: A comment on the laser-phase-transition analogy. Phys. Rev. A 50, 4318-4329 (1994).
- [3] Bj rk, G., Karlsson, A. & Yamamoto, Y. Definition of a laser threshold. Phys. Rev. A 50, 1675-1680 (1994).
- [4] Jin, R. et al. Photon-number correlations near the threshold of microcavity lasers in the weak-coupling regime. Phys. Rev. A 49, 4038-4042 (1994).
- [5] Briegel, H.-J., Meyer, G.M. & Englert, B.-G. Dynamic noise reduction in multilevel lasers: Nonlinear theory and the pump-operator approach. Phys. Rev. A 53, 1143 1159 (1996).
- [6] An, K., Childs, J.J., Dasari, R.R. & Feld, M.S. Microlaser: A laser with one atom in an optical resonator. Phys. Rev. Lett. 73, 3375-3378 (1994).
- [7] McKeever, J., Boca, A., Boozer, A.D., Buck, J.R. & Kimble, H.J. Experimental realization of a one-atom laser in the regime of strong coupling. Nature 425, 268-271 (2003).
- [8] Dubin, F. et al. Quantum to classical transition in a single-ion laser. Nature Phys. 6, 350-353 (2010).
- [9] Siegman, A.E. Lasers (University Science Books, Mill Valley, 1986).
- [10] Krenner, H.J. et al. Direct observation of controlled coupling in an individual quantum dot molecule. Phys. Rev. Lett. 94, 057402 (2005).
- [11] Ortner, G. et al. Control of vertically coupled InGaAs/GaAs quantum dots with electric fields. Phys. Rev. Lett. 94, 157401 (2005).
- [12] Stinaff, E.A. et al. Optical signature of coupled quantum dots. Science 311, 636-639 (2006).
- [13] Kim, E.D. et al., Ultrafast optical control of entanglement between two quantum dot spins. arXiv:1007.3733 (2010).
- [14] Doty, M.F. et al. Optical spectra of doubly charged quantum dot molecules in electric and magnetic fields. Phys. Rev. B 78, 115316 (2008).
- [15] Hanson, R., Kouwenhoven, L.P., Petta, J.R., Tarucha, S. & Vandersypen, L.M.K. Spins in few-electron quantum dots. Rev. Mod. Phys. 79, 1217-1265 (2007).
- [16] Warburton, R.J. et al. Optical emission from a charge-tunable quantum ring. Nature 405, 926 (2000).
- [17] Atature, M. et al. Quantum-dot spin-state preparation with near-unity fidelity. Science 312, 551-553 (2006).
- [18] Fält, S. et al. Strong electron-hole exchange in coherently coupled quantum dots. Phys. Rev. Lett. 100, 106401 (2008).
- [19] Robledo, L. et al. Conditional dynamics of interacting quantum dots. Science 320, 772-775 (2008).
- [20] Vamivakas, A.N., Zhao, Y., Lu, C.Y. & Atatüre, M. Spin-resolved quantum-dot resonance fluorescence. Nature Phys. 5, 198-202 (2009).
- [21] Fernandez, G., Volz, T., Desbuquois, R., Badolato, A. & Imamoglu, A. Optically tunable spontaneous raman fluorescence from a single self-assembled InGaAs quantum dot. Phys. Rev. Lett. 103, 087406 (2009).
- [22] Xu, X. et al. Coherent optical spectroscopy of a strongly driven quantum dot. Science 317, 929-932 (2007).
- [23] Vamivakas, N. et al. Strong extinction of a far-field laser beam by a single quantum dot. Nano Lett. 7 2892-2896 (2007).
- [24] Xie, Q., Madhukar, A., Chen, P. & Kobayashi, N.P. Vertically self-organized InAs quantum box islands on GaAs(100). Phys. Rev. Lett. 75, 2542 2545 (1995).
- [25] Garcia, J.M., Mankad, T., Holtz, P.O., Wellman, P.J. & Petroff., P.M. Electronic states tuning of InAs self-assembled quantum dots. Appl. Phys. Lett. 72, 3172-3174 (1998).
- [26] Alén, Bickel, F., Karrai, K., Warburton, R.J. & Petroff, P.M. Stark-shift modulation absorption spectroscopy of single quantum dots. Appl. Phys. Lett. 83, 2235-2237 (2003).
Acknowledgements We thank V. Golovach for helpful discussions, and C. Latta for help with the numerical simulations.