Global p-mode oscillations throughout the complete solar cycle 23 and the beginning of cycle 24
Abstract
The parameters of the p-mode oscillations vary with solar activity. Such temporal variations provide insights for the study of the structural and dynamical changes occurring in the Sun’s interior throughout the solar cycle. We present here a complete picture of the temporal variations of the global p-mode parameters (excitation, damping, frequency, peak asymmetry, and rotational splitting) over the entire solar cycle 23 and the beginning of cycle 24 as observed by the space-based, Sun-as-a-star helioseismic GOLF and VIRGO instruments onboard SoHO.
1 Introduction
The solar p-mode parameters have been demonstrated to vary with time and to be closely correlated with the solar activity proxies (Chaplin et al. [1]; Salabert et al. [2, 3]; Komm et al. [4]). These temporal variations provide insights to infer the interior of the Sun and its structural and dynamical changes throughout the solar cycle. However, clear differences between p-mode frequencies and solar activity during the unusually minimum of cycle 23 have been reported (Broomhall et al. [5]; Salabert et al. [6]). The origin of the p-mode variability is thus far from being properly understood and a better comprehension of its relationship with solar (and stellar, García et al. [7]) activity cycles will help us in our understanding of the dynamo processes.
2 Observations and analysis
We analyzed observations collected by the space-based, Sun-as-a-star instruments Global Oscillations at Low Frequency (GOLF, Gabriel et al. [8]) and Variability of Solar Irradiance and Gravity Oscillations (VIRGO, Fröhlich et al. [9]) onboard the Solar and Heliospheric Observatory (SoHO) spacecraft. GOLF measures the Doppler velocity in the D1 and D2 sodium lines (García et al. [10]). VIRGO is composed of three Sun photometers (SPM) at 402 nm (blue), 500 nm (green), and 862 nm (red). A total of 5202 and 5154 days of GOLF and VIRGO observations respectively covering more than 14 years between 1996 and 2010 were analyzed, with respective duty cycles of 95.4% and 95.2%. These datasets were split into contiguous 365-day subseries, with a four-time overlap. The power spectrum of each subseries was fitted to extract the mode parameters (Salabert et al. [11]) using a standard likelihood maximization function. Subseries with duty cycles less than 90% (basically around the SoHO vacation, 1998–1999) were removed. Each mode component was parameterized using an asymmetric Lorentzian profile, including the and 5 modes when visible. The temporal variations of the mode parameters were defined as the difference between reference values (taken as the average over 1996–1997) and the parameters of the corresponding modes observed at different dates. Their weighted averages over the central part of the 5-minute oscillation power (2200 – 3400 Hz) were then calculated. Mean values of daily measurements of the 10.7-cm radio flux were used as a proxy of the solar surface activity. Linear regressions were performed between the temporal variations of the mode parameters and the radio flux using independent points only. The color code in the following figures corresponds to the VIRGO blue, green, and red channels respectively.
| \br | |||
|---|---|---|---|
| \mr | |||
| \br |
| \brInstrument | Correlation | |
|---|---|---|
| \mrGOLF blue period | ||
| GOLF red period | ||
| VIRGO blue | ||
| VIRGO green | ||
| VIRGO red | ||
| \br |
3 Results
3.1 Mode excitation and damping
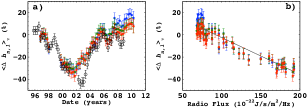
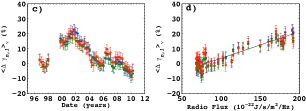
The temporal variations of the mode excitation and damping parameters from VIRGO were averaged over the , 1 and 2 modes. The changes in mode amplitudes and linewidths are shown on Fig. 1. Note that due to absolute calibration problems and the changes of the observing wings, the GOLF amplitudes and linewidths are not exploitable for the moment. A proper calibration is currently underway. In order to compare with VIRGO, we performed, as described in Sec. 2, a preliminary analysis of the Global Oscillation Network Group (GONG, Harvey et al. [12]) data (gong.nso.edu/data/). Similar fluctuations from the year 2006 in mode amplitudes (open circles on Fig. 1) and linewidths are observed as in VIRGO. The changes from maximum-to-minimum of the solar cycle are given in Table 1 and are consistent with previous work (e.g., Jiménez-Reyes et al. [13]; Salabert and Jiménez-Reyes [14]).


3.2 Frequencies of individual low-degree modes
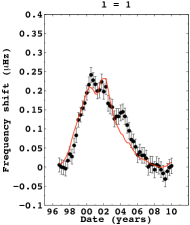
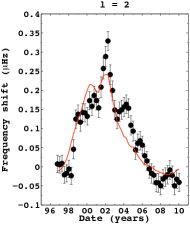
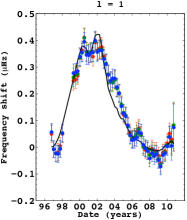
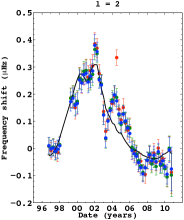
Different temporal variations of the Sun-as-a-star p-mode frequencies are observed between individual angular degrees , 1, and 2 (Salabert et al. [6]) and are consistent between the observations from GOLF and the 3 VIRGO/SPMs (Fig. 2). They might be interpreted as different geometrical responses to the spatial distribution of the solar magnetic field beneath the surface of the Sun. Moreover, the peculiar behavior of the individual modes around the long and deep activity minimum of cycle 23 is of particular interest.
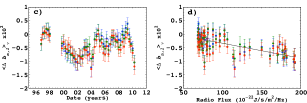
3.3 Peak asymmetry
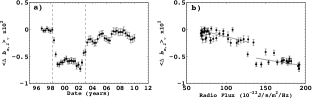
The peak asymmetry of the pairs = 0-2 and = 1-3 modes shows significant temporal variations with solar activity (Fig. 3 and Table 2). Similar changes are obtained between velocity (GOLF) and intensity (VIRGO) measurements, while Jiménez-Reyes et al. [15] found opposite variations. No significant correlation between asymmetry and signal-to-noise ratio is observed.
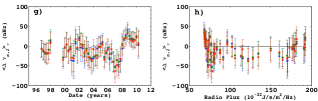
3.4 Rotational splittings
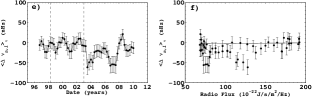
No correlation is observed between the temporal variations of the mean and 2 rotational splittings and the 11-year solar cycle (Fig. 3). However, some similar fluctuations between GOLF and VIRGO are present. Note also that the GOLF splittings show a jump between the red-wing period and the second blue-wing period starting end of 2002.
4 Conclusions
We analyzed more than 14 years of radial velocity and intensity helioseismic Sun-as-a-star data collected by the space-based GOLF and VIRGO instruments respectively to study the temporal variations of the low-degree p-mode parameters (excitation, damping, frequency, peak asymmetry, and rotational splitting) with solar activity. The observed changes in excitation and damping parameters confirm previous results. The frequency shifts present differences between individual modes, for instance showing different minima for cycle 23. The peak asymmetry shows significant and similar variations between radial velocity and intensity measurements. The rotational splittings do not show correlations with the 11-year solar magnetic cycle.
The GOLF and VIRGO instruments onboard SoHO are a cooperative effort of many individuals, to whom we are indebted. SoHO is a project of international collaboration between ESA and NASA. The 10.7-cm radio flux was obtained from the National Geophysical Data Center. DS acknowledges the support of the grant PNAyA2007-62650 from the Spanish National Research Plan. This work has been supported by the CNES/GOLF grant at the SAp CEA-Saclay.
References
References
- [1] Chaplin W J, Elsworth Y, Miller, B A, Verner G A and New R 2007 ApJ 659 1749
- [2] Salabert D, Fossat E, Gelly B, Kholikov S, Grec G, Lazrek M and Schmider F X 2004 A&A 413 1135
- [3] Salabert D, Jiménez-Reyes S J and Tomczyk S 2003 A&A 408 729
- [4] Komm R W, Howe R and Hill F 2000 ApJ 531 1094
- [5] Broomhall A-M, Chaplin W J, Elsworth Y, Fletcher S T and New R 2009 ApJ 700 L162
- [6] Salabert D, García R A, Pallé P L and Jiménez-Reyes S J 2009 A&A 504 L1
- [7] García R A, Mathur S, Salabert D, Ballot J, Régulo C, Metcalfe T and Baglin A 2010 Science 329 1032
- [8] Gabriel A H et al. 1995 Solar Physics 162 61
- [9] Fröhlich C et al. 1995 Solar Physics 162 101
- [10] García R A et al. 2005 A&A 442 385
- [11] Salabert D, Chaplin W J, Elsworth Y, New R and Verner G A 2007 A&A 463 1181
- [12] Harvey J W et al. 1996 Science 272 1284
- [13] Jiménez-Reyes S J, Chaplin W J, Elsworth Y and García R A 2004 ApJ 604 969
- [14] Salabert D and Jiménez-Reyes S J 2006 ApJ 650 451
- [15] Jiménez-Reyes S J, García R A, Jiménez A and Chaplin W J 2003 ApJ 595 446