Spitzer Imaging of Herschel-ATLAS Gravitationally Lensed Submillimeter Sources
Abstract
We present physical properties of two submillimeter selected gravitationally lensed sources, identified in the Herschel Astrophysical Terahertz Large Area Survey. These submillimeter galaxies (SMGs) have flux densities 100 mJy at 500m, but are not visible in existing optical imaging. We fit light profiles to each component of the lensing systems in Spitzer IRAC 3.6 and 4.5m data and successfully disentangle the foreground lens from the background source in each case, providing important constraints on the spectral energy distributions (SEDs) of the background SMG at rest-frame optical-near-infrared wavelengths. The SED fits show that these two SMGs have high dust obscuration with 5 and star formation rates of yr-1. They have low gas fractions and low dynamical masses compared to 850m selected galaxies.
Subject headings:
galaxies: individual (SDP.81: H-ATLAS J090311.6+003906, SDP.130: H-ATLAS J091305.0-005343) — galaxies: starburst — gravitational lensing: strong1. Introduction
Gravitational lensing is an invaluable astrophysical tool. It can be exploited to study galaxies beyond instrumental blank field sensitivities and to constrain the total mass of galaxy systems, without regard for its dark or luminous nature (see review by Treu 2010). The magnification of distant galaxies through gravitational lensing enables the detailed study of sources that would otherwise be undetectable. In the submillimeter regime this includes members of the population of intrinsically faint galaxies that comprise a significant fraction of the cosmic far-infrared background.
The Herschel353535Herschel is an ESA space observatory with science instruments provided by European-led Principal Investigator consortia and with important participation from NASA. (Pilbratt et al. 2010) Astrophysical Large Area Survey (H-ATLAS; Eales et al. 2010) is the largest open-time key project currently being undertaken by Herschel and aims to survey 550 deg2 and detect galaxies. A new methodology for selecting gravitational lenses using wide-area submillimeter (sub-mm) surveys (Blain 1996, Perrotta et al. 2002; Negrello et al. 2007) has been tested for the first time during Herschel’s science demonstration phase (SDP; Negrello et al. 2010, N10 hereafter). Candidates are selected using a flux cut of 100 mJy at 500m, a limit based on the steep number counts slope in the sub-mm (Negrello et al. 2007). Above this flux limit only gravitationally lensed objects and easily identifiable ‘contaminants’ remain e.g. blazars and local spiral galaxies. Initial results show that this selection method has 100% efficiency and should deliver a sample of hundreds of new gravitational lenses in planned wide area Herschel surveys, probing galaxies with intrinsic fluxes below the Herschel confusion limit.
Five lens candidates in the SDP H-ATLAS data (Pascale et al. 2010; Rigby et al. 2010; N10) were confirmed with spectroscopic redshifts obtained via the detection of carbon monoxide (CO) emission lines (Lupu et al. 2010; Frayer et al. 2011) of the background galaxies and optical spectra (Negrello et al. 2010) of the lens galaxies. In this Letter we study two of these gravitational lenses, H-ATLAS J090311.6+003906 (SDP.81) and H-ATLAS J091305.0-005343 (SDP.130), which are submillimeter galaxy (SMG) at redshifts of and being lensed by ellipticals at and , respectively. Submillimeter Array (SMA) imaging reveals the sub-mm morphology, consistent with a lensing event, with multiple peaks distributed around the position of the foreground elliptical galaxy (N10). While no lensed background images were detectable in optical imaging, the spectral energy distribution (SED) models suggest that flux from the background sources should be detectable above 10Jy at near-IR wavelengths, from 2 to 5 m (N10). At these wavelengths, the emission from the foreground lenses, at , and the background SMGs becomes comparable.
In this Letter we present Spitzer/IRAC imaging, light profile models, photometry and physical characteristics for SDP.81 and SDP.130 derived from SED fitting. In the next section, we present a summary of the Spitzer data, while in Section 3 we discuss modeling of the light profile of the foreground lenses. We perform SED modeling of background SMGs and present results related to the properties of these two sources in Section 4. Throughout the Letter we assume flat CDM cosmology with = and km sMpc-1.
2. Spitzer IR and Keck Optical Imaging data
The IR imaging data are part of Spitzer program 548 (PI: A. Cooray), released for analysis on 2010 July 30. For this program, Infrared Array Camera (IRAC; Fazio et al. 2004) images of SDP.81 and SDP.130 were taken at 3.6m (Channel 1) and 4.5m (Channel 2). Both lensing systems were imaged with a 36-position dither pattern and an exposure time of 30 s for each frame to achieve an effective total exposure time of 1080 s. The rms depth reached is 0.3 and 0.4 Jy in Channels 1 and 2, respectively.
Corrected basic calibrated data pre-processed by the Spitzer Science Center (SSC), using the standard pipeline version S18.18.0, were spatially aligned, resampled, and combined into a mosaic image using version 18.3.1 of the SSC’s MOPEX software suite (Makovoz Marleau 2005). The IRAC mosaics have a resampled pixel size of 0.6′′ and angular resolution of 2 to 2.5′′. For the work presented here, we also use the IRAC point spread function (PSF; version 2010 April) file as provided by the SSC 363636http://ssc.spitzer.caltech.edu/irac/calibrationfiles/psfprf/.
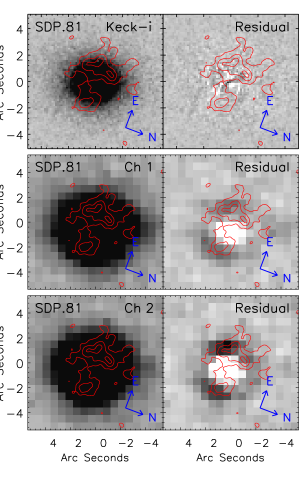
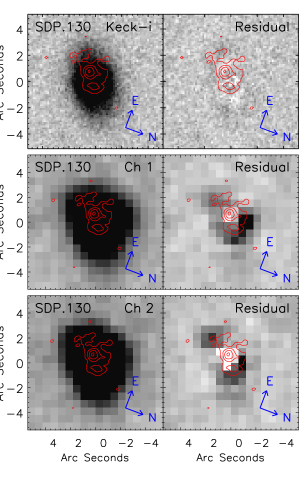
We also make use of optical images of SDP.81 and SDP.130 that were acquired on 2010 March 10 using the dual-arm Low Resolution Imaging Spectrometer (LRIS; Oke et al. 1995, McCarthy et al. 1998) on the Keck I telescope and reported in N10 (see Figures 1 and 2). Each target received simultaneous 3110 s integrations with the g-filter and 360 integrations with the i-filter using the blue and red arms of LRIS, respectively. A 20′′ dither pattern was employed to generate on-sky flat-field frames. We performed photometric calibration using 1 s g- and i-band observations of bright stars in each field. The data were reduced using IDL routines and combined and analyzed using standard IRAF tasks; the seeing FWHM of the final science exposures is 0.8′′.
3. Modeling the lenses
To construct models of the light profiles for each lensing system we use GALFIT (Peng et al. 2002), which allows multiple profiles per object and performs a simultaneous nonlinear minimization. Prior to fitting profiles to SDP.81 and SDP.130 in the IRAC data, de Vaucouleurs profile (de Vaucouleurs 1948) models are constructed for the Keck i-band imaging, to take advantage of the comparatively higher resolution of these images, and the presence of only one component per system i.e. the lens galaxy.
To look for any potentially lensed structure in the IRAC data, the Keck models are used to fit the IRAC Channels 1 and 2 data, keeping the effective radius and ellipticity fixed, and using the appropriate IRAC PSF 36. On subtraction of the results, and in comparison to the model subtracted Keck data and SMA contours, the IRAC band residuals strongly suggest that a more complex structure, associated with the background SMG, is present for both SDP.81 and SDP.130 (see Figures 1 and 2).
We verify that these residuals are significant, and not an artifact of imperfections in the IRAC PSF, by comparing them with residuals derived for three (non-lensing) elliptical-like galaxies in the same field, after fitting them with single Sérsic profiles. For both the lensing systems and the comparison ellipticals aperture flux ratios were determined for the residual image and the corresponding un-subtracted data. To consider only positive structure, pixel values below the local background were replaced with the median local sky value. The SMG residuals were found to have flux ratios greater than those for the random elliptical galaxies.
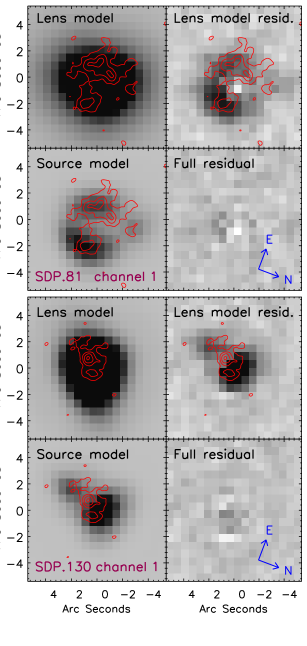
In order to more precisely disentangle the lens and background components we represent the flux from the lensed SMGs with Sérsic profiles. Peaks were identified in the IRAC single profile fit residual images, by fitting Gaussian profiles. We add three profiles for SDP.81 and two for SDP130, which all correspond to significant sub-mm contour peaks in the SMA data, within 0.8′′. N10 modeled the Keck i band with a Sérsic profile plus an exponential disk, as this combination gave a marginally improved over single profile models, and found that the exponential component significantly contributes to the total profile for SDP.130. Therefore, a Sérsic plus exponential disk profile is adopted for the SDP.130 lens and a single Sérsic profile for the SDP.81 lens. To produce the final models for the lens and background galaxies, we refit the profile representing the lens galaxy and the additional Sérsic profiles simultaneously for each system with GALFIT. These final model fits for the background component of SDP.81 show a partial “Einstein ring”-like morphological structure for the lensed source (Figure. 3). For SDP.130, the lensed component is more compact and in close proximity to the lens profile. The resulting best fit profiles for the background galaxies agree well with the SMA contours, and the combined models subtract cleanly, suggesting successful lens/source decoupling.
| Parameters | SDP.81 | SDP.130 |
|---|---|---|
| Foreground lens | ||
| RA | 09 | 09 |
| Dec | 00 | |
| Redshift | 0.299 | 0.220 |
| SDSS u (Jy) | 3.9 2.0 | 1.7 1.7 |
| SDSS g (Jy) | 24.9 1.1 | 19.4 0.7 |
| SDSS r (Jy) | 115 2 | 66.1 1.2 |
| SDSS i (Jy) | 198 4 | 109 2 |
| SDSS z (Jy) | 278 8 | 143 7 |
| UKIDSS Y (Jy) | 320 20 | … |
| UKIDSS J (Jy) | 370 20 | … |
| UKIDSS H (Jy) | 510 50 | … |
| UKIDSS K (Jy) | 570 70 | … |
| Spitzer 3.6 m (mJy) | 0.35 0.04 | 0.213 0.03 |
| Spitzer 4.5 m (mJy) | 0.22 0.04 | 0.230 0.01 |
| Background SMG: observed quantities | ||
| Redshift | 3.042 | 2.625 |
| Magnification | 25 7 | 6 1 |
| Keck/LRIS g (Jy) | 0.13 | 0.20 |
| Keck/LRIS i (Jy) | 0.20 | 0.35 |
| UKIDSS Y (Jy) | 6.27 | … |
| UKIDSS J (Jy) | 9.23 | … |
| UKIDSS H (Jy) | 8.52 | … |
| UKIDSS K (Jy) | 13.5 | … |
| Spitzer 3.6 m (mJy) | 0.062 0.04 | 0.044 0.01 |
| Spitzer 4.5 m (mJy) | 0.126 0.05 | 0.047 0.01 |
| PACS 70 m (mJy) | 8.0 | 9.0 |
| PACS 100 m (mJy) | 62 | … |
| PACS 160 m (mJy) | 51 5 | 45 8 |
| SPIRE 250 m (mJy) | 130 20 | 105 17 |
| SPIRE 350 m (mJy) | 180 30 | 128 20 |
| SPIRE 500 m (mJy) | 170 30 | 108 18 |
| SMA 880 m (mJy) | 76 4 | 39 2 |
| IRAM 1200 m (mJy) | 19.6 0.9 | 11.2 1.2 |
| Background SMG: derived quantities | ||
| 2.0 0.6 | 5.6 1.2 | |
| 4.4 0.6 | 5.0 0.5 | |
| SFR ( yr-1) | 74 30 | 150 50 |
| ( ) | 1.4 | 2.7 |
| ( ) | 2.5 1.7 | 4.5 2.5 |
| ( ) | 3.4 1.0 | 11 2 |
| 0.05 0.01 | 0.08 0.01 | |
4. Spectral energy distribution of the lensed SMGs
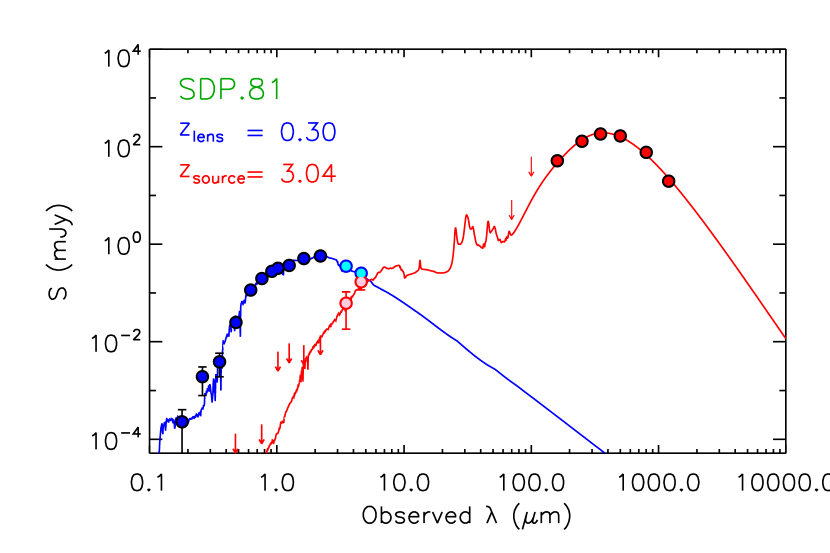
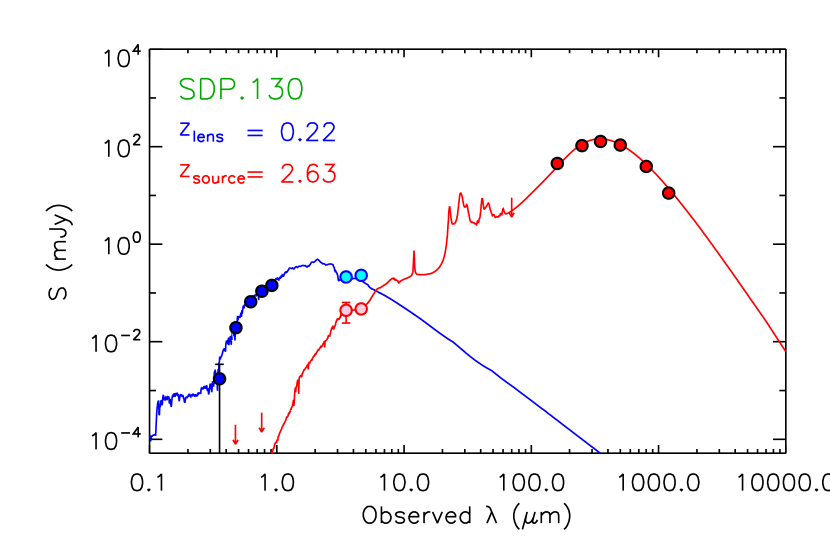
The GALFIT-integrated magnitudes for each component of the final SDP.81 and SDP.130 models were converted to flux density to extend the existing multi-waveband photometry (see table 1 and N10, and references therein) into the near-IR. We assign 1 errors to the photometry obtained from the final GALFIT model profiles, using the magnitude distributions for all the GALFIT trials that converged. PACS re-imaging of the lensed H-ATLAS sources provides new photometry at 160m and upper limits at 70m (I. Valtchanov et al. in preparation; Ibar et al. 2010). For the goal of deriving physical properties, the IRAC photometry adds particularly important constraints to the SMG SEDs, which previously consisted of just upper limits at wavelengths below 250m for SDP.130 and 160m for SDP.81.
The SEDs of the SMGs are fitted using the models of da Cunha et al. (2008), calibrated to reproduce the ultraviolet-to-infrared SEDs of local, purely star-forming Ultra Luminous Infrared Galaxies (ULIRGs; 10 ; da Cunha et al. 2010). The SED models assume a Chabrier (2003) initial mass function (IMF) that is cutoff below 0.1 and above 100 ; using a Salpeter IMF instead gives stellar masses that are a factor of larger. We find that a significant attenuation by dust (4-5) is required to be consistent with the IRAC photometry and optical/near-IR upper limits (Figure 4), which is consistent with other ULIRGs and SMGs (e.g. Geach et al. 2007; Hainline et al. 2010; Michałowski et al. 2010; Wardlow et al. 2010).
Using the Chabrier (2003) IMF, with parameters derived from the SED fits, we find that SDP.81 and SDP.130 have stellar masses () of and , respectively (see table 1). However, we note that there is an additional systematic error of up to a factor of 10, due to uncertainty in the appropriate mass-to-light ratio (see Wardlow et al. 2010 for a discussion) and magnification factors, as well as a lack of observations at optical/near-IR wavelengths. J and Ks photometric data on these galaxies with VLT/HAWK-I observations (A. Verma et al. in preparation 2011) could potentially improve the estimates of extinction and stellar mass.
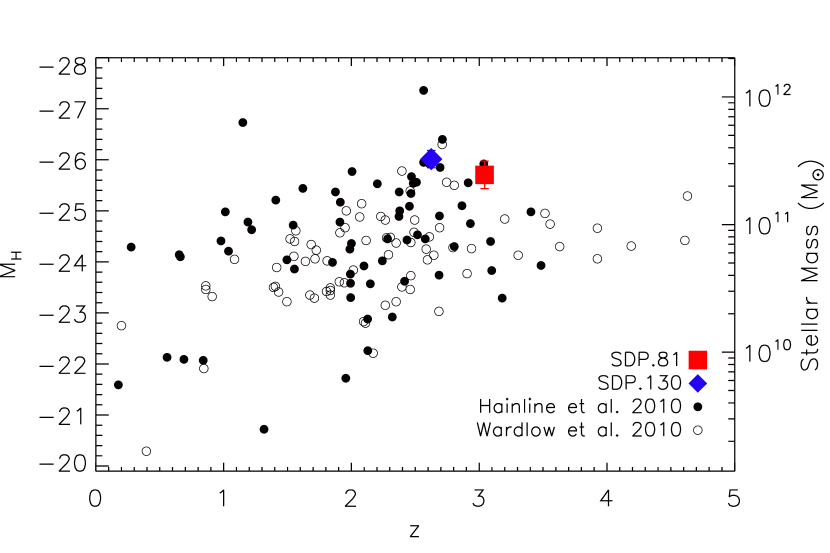
Rest-frame absolute H-band magnitudes () provide a guide to galaxy stellar masses that is not complicated by the details of the assumed star formation history and is straightforward to compare to other similarly selected samples. In the top panel of Figure 4 we plot against redshift for SDP.81 and SDP.130 compared to 850 and 870 m selected SMGs (Hainline et al. 2010; Wardlow et al. 2010). The H-ATLAS lensed galaxies are brighter than the majority of the – m selected SMGs, thus if there is no active galactic nucleus contribution to their -band luminosities they are likely to be amongst the most massive.
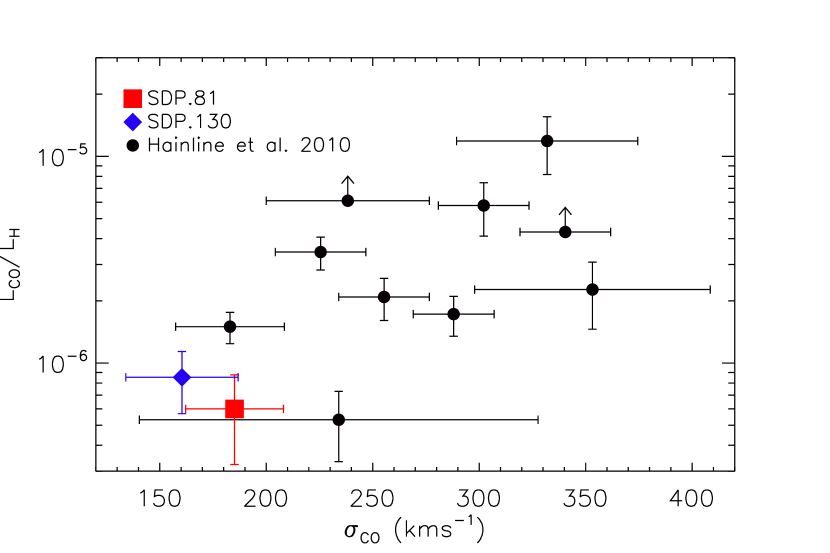
We next consider the CO(10)-to--band luminosity ratio (), a representation of the gas-to-stellar mass fraction that is mostly independent of the lensing model. However, the IRAC data trace stellar emission, which may originate from a spatially different region of the SMG to the far-infrared emission. As such there may be variation in the lensing amplifications across the source plane, potentially leading to a small effect on The bottom panel of Figure 4 shows against the CO linewidth () for the two H-ATLAS lensed galaxies, compared to 850-m selected SMGs (Hainline et al. 2010). is independent of and is indicative of the dynamical mass of the system, although some scatter is introduced due to the dependence on the inclination angle and the size of the CO emitting region. Published CO luminosities of the 850 m selected sample (Greve et al. 2005, Coppin et al. 2008; Frayer et al. 2008, Tacconi et al. 2008; Bothwell et al. 2010) are converted to the equivalent CO(10) values using and (Ivison et al. 2010). Galaxies with poorly defined are excluded. The H-ATLAS lensed galaxies have low (representative of gas fraction) and low (representative of dynamical mass) compared to 850-m selected galaxies (Figure 4). There may also be a weak inverse trend between and for all the SMGs, although a larger sample is required for confirmation.
Summary: We have studied the background SMGs of two sub-mm bright gravitational lenses, identified in the H-ATLAS SDP data. The intrinsic sub-mm flux densities of these SMG are below the Herschel confusion noise and, therefore, undetectable without the fortuitous lensing by foreground ellipticals. The full 550 deg2 survey area of H-ATLAS will recover a sample of lensed SMGs, and Spitzer follow-up observations will enable us to study the physical properties of SMGs over a wide range of redshift and far-IR luminosities. Studies such as this are necessary to further understand the nature of sources that contribute to the bulk of the cosmic far-infrared background.
References
- (1) Blain, A. W. 1996, MNRAS, 283, 1340
- (2) Bothwell, M. S., et al. 2010, MNRAS, 405, 219
- (3) Chabrier, G. 2003, PASP, 115, 763
- (4) Coppin, K., et al., 2008, MNRAS, 389, 45
- (5) da Cunha, E., Charlot, S., & Elbaz, D. 2008, MNRAS, 388, 1595
- (6) da Cunha, E., Charmandaris, V., Díaz-Santos, T., Armus, L., Marshall, J. A., & Elbaz, D. 2010, A&A, 523, A78
- (7) de Vaucouleurs, G. 1948, Ann. Astrophys., 11, 247
- (8) Eales, S., et al. 2010, PASP, 122, 499
- (9) Fazio, G. G., et al. 2004, ApJS, 154, 10
- (10) Frayer, D. T., et al. 2008, ApJ, 680, L21
- (11) Frayer, D., et al. 2011, ApJ, 726, L22
- (12) Geach, J. E., Smail, I., Chapman, S. C., Alexander, D. M., Blain, A. W., Stott, J. P., & Ivison, .R. J. 2007, ApJ, 655, L9
- (13) Greve, T. R., et al. 2005, MNRAS, 259, 1165
- (14) Hainline, L. J., Blain, A. W., Smail, I., Alexander, D. M., Armus, L., Chapman, S. C., & Ivison, R. J. 2010, MNRAS, submitted (arXiv:1006.0238)
- (15) Ibar, E., et al. 2010, MNRAS, 409, 38
- (16) Ivison, R. J., Papadopoulos, P. P., Smail I., Greve, T. R., Thomson, A. P. , Xilouris, E. M., & Chapman, S. C. 2010, MNRAS, in press (arXiv:1009.0749)
- (17) Lupu, R., et al. 2010, ApJ, submitted (arXiv:1009.5983)
- (18) Makovoz, D., Marleau, F. R. 2005, PASP, 117, 1113
- (19) McCarthy, J. K., et al. 1998, Proc. SPIE, 3355, 81
- (20) Michałowski, M. J., Hjorth, J., & Watson, D. 2010, A&A, 514, A67
- (21) Negrello, M., Perrotta, F., González-Nuevo, J., Silva, L., de Zotti, G, Granato, G. L., Baccigalupi, C. & Danese, L. 2007, MNRAS, 377, 1557
- (22) Negrello, M., et al. 2010, Science, 330, 800
- (23) Oke, J. B., et al., 1995, PASP, 107, 375
- (24) Pascale, E., et al. 2010, MNRAS, submitted (arXiv:1010.5782)
- (25) Peng, C. Y., Ho, L. C., Impey, C. D., Rix, H.-W. 2002, AJ, 124, 266
- (26) Perrotta, F., Baccigalupi, C., Bartelmann, M., De Zotti, G. Granato, G. L. 2002, MNRAS, 329, 445
- (27) Pilbratt, G. L., et al. 2010, A&A, 518, L1
- (28) Rigby, E. E., et al. 2010, MNRAS, submitted (arXiv:1010.5787)
- (29) Tacconi, L. J., et al. 2008, ApJ, 680, 246
- (30) Treu, T. 2010, ARA&A, 48, 87
- (31) Wardlow, J. L., et al. 2010, MNRAS, submitted, (arXiv:1006.2137)